

Tumor microenvironment gene expression profiles associated to complete pathological response and disease progression in resectable NSCLC patients treated with neoadjuvant chemoimmunotherapy
- PMID: 36171009
- PMCID: PMC9528578
- DOI: 10.1136/jitc-2022-005320
Tumor microenvironment gene expression profiles associated to complete pathological response and disease progression in resectable NSCLC patients treated with neoadjuvant chemoimmunotherapy
Abstract
Background: Neoadjuvant chemoimmunotherapy for non-small cell lung cancer (NSCLC) has improved pathological responses and survival rates compared with chemotherapy alone, leading to Food and Drug Administration (FDA) approval of nivolumab plus chemotherapy for resectable stage IB-IIIA NSCLC (AJCC 7th edition) without ALK or EGFR alterations. Unfortunately, a considerable percentage of tumors do not completely respond to therapy, which has been associated with early disease progression. So far, it is impossible to predict these events due to lack of knowledge. In this study, we characterized the gene expression profile of tumor samples to identify new biomarkers and mechanisms behind tumor responses to neoadjuvant chemoimmunotherapy and disease recurrence after surgery.
Methods: Tumor bulk RNA sequencing was performed in 16 pretreatment and 36 post-treatment tissue samples from 41 patients with resectable stage IIIA NSCLC treated with neoadjuvant chemoimmunotherapy from NADIM trial. A panel targeting 395 genes related to immunological processes was used. Tumors were classified as complete pathological response (CPR) and non-CPR, based on the total absence of viable tumor cells in tumor bed and lymph nodes tested at surgery. Differential-expressed genes between groups and pathway enrichment analysis were assessed using DESeq2 and gene set enrichment analysis. CIBERSORTx was used to estimate the proportions of immune cell subtypes.
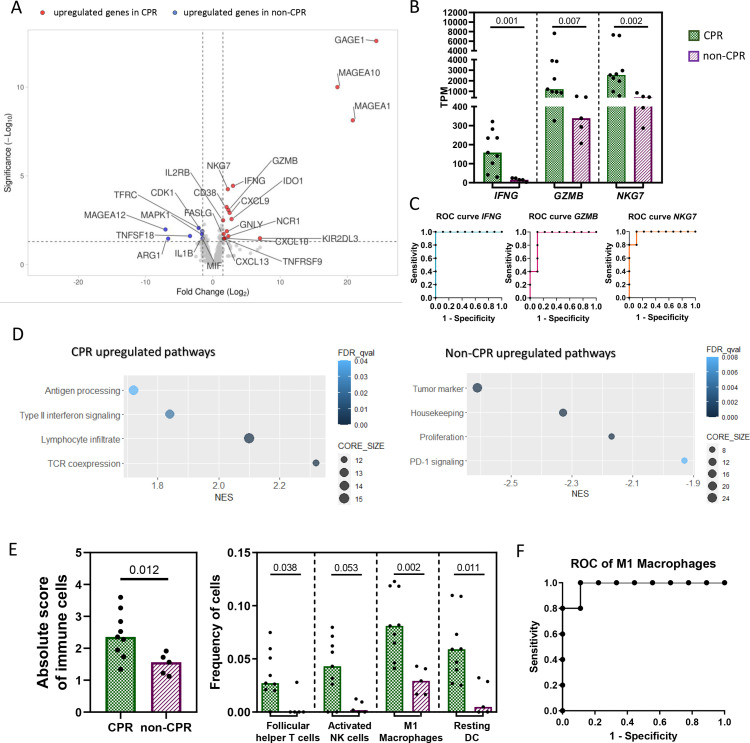
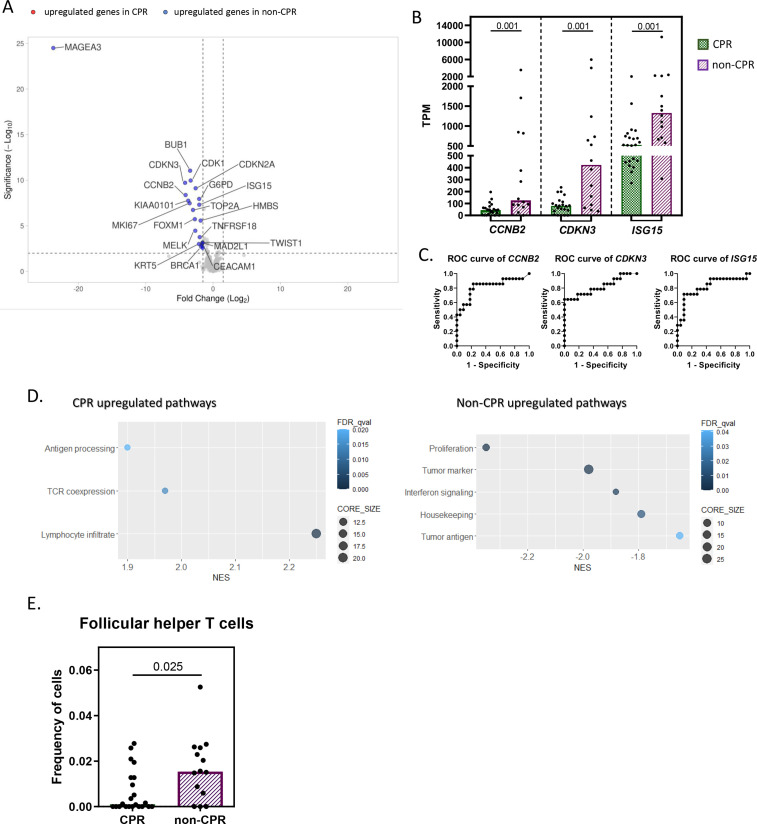
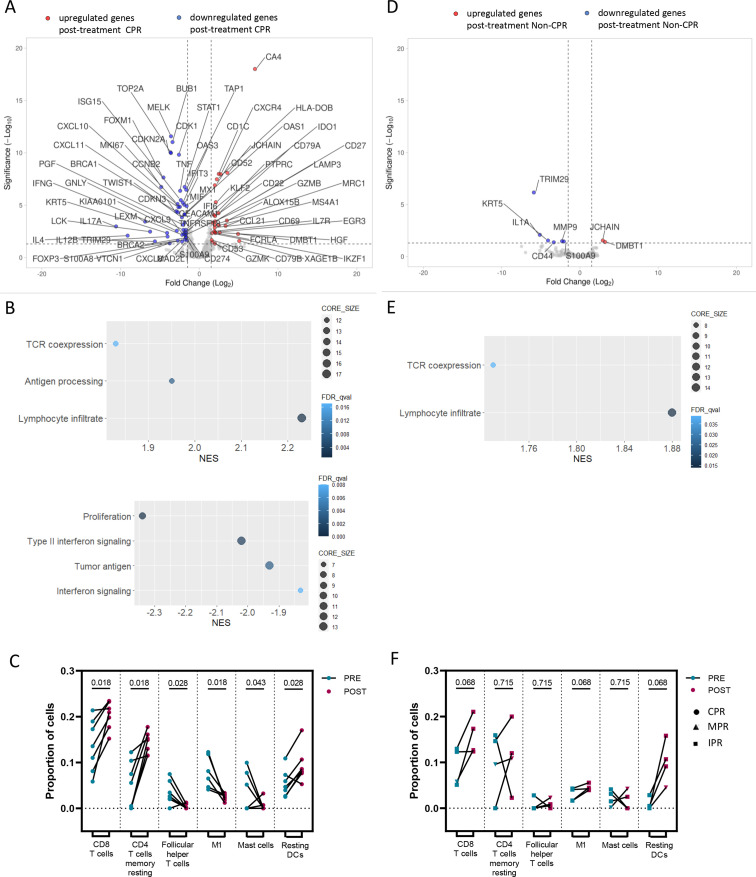
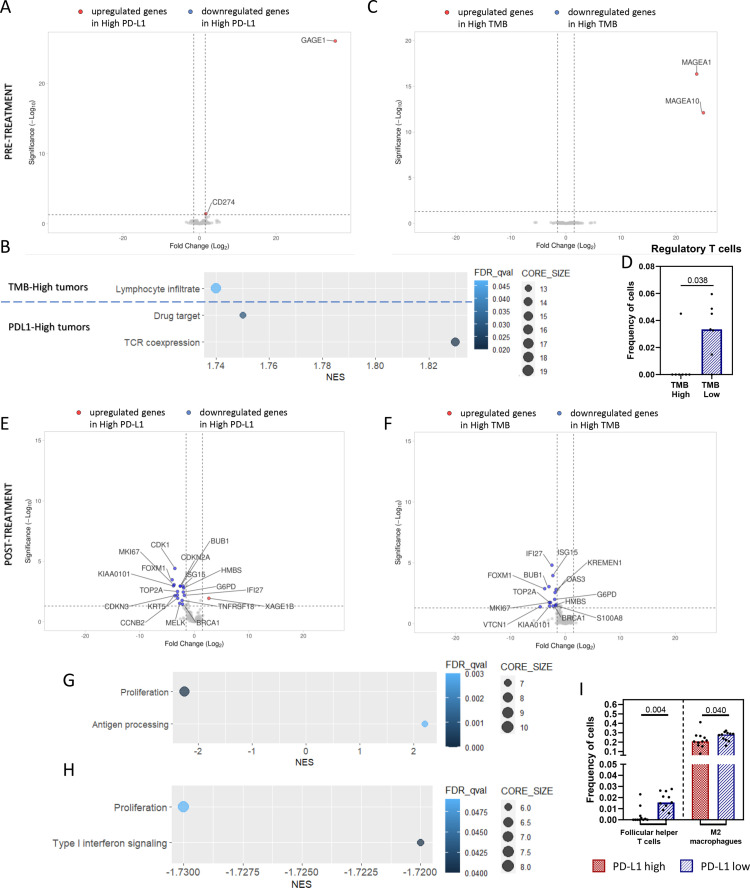
Results: CPR tumors had a stronger pre-established immune infiltrate at baseline than non-CPR, characterized by higher levels of IFNG, GZMB, NKG7, and M1 macrophages, all with a significant area under the receiver operating characteristic curve (ROC) >0.9 for CPR prediction. A greater effect of neoadjuvant therapy was also seen in CPR tumors with a reduction of tumor markers and IFNγ signaling after treatment. Additionally, the higher expression of several genes, including AKT1, BST2, OAS3, or CD8B; or higher dendritic cells and neutrophils proportions in post-treatment non-CPR samples, were associated with relapse after surgery. Also, high pretreatment PD-L1 and tumor mutational burden levels influenced the post-treatment immune landscape with the downregulation of proliferation markers and type I interferon signaling molecules in surgery samples.
Conclusions: Our results reinforce the differences between CPR and non-CPR responses, describing possible response and relapse immune mechanisms, opening the possibility of therapy personalization of immunotherapy-based regimens in the neoadjuvant setting of NSCLC.
Keywords: drug therapy, combination; gene expression profiling; immunotherapy; lung neoplasms; tumor biomarkers.
© Author(s) (or their employer(s)) 2022. Re-use permitted under CC BY-NC. No commercial re-use. See rights and permissions. Published by BMJ.
Conflict of interest statement
Competing interests: MP reports non-financial support (reagents for TCR sequencing) from ThermoFisher; grants, personal fees and non-financial support from BMS; grants, personal fees and non-financial support from ROCHE; grants, personal fees and non-financial support from ASTRAZENECA; personal fees from MSD; personal fees from TAKEDA; outside the submitted work. EN grants or contracts: Roche, Pfizer, Merck-Serono, BMS, and Nanostring. Consulting fees: Roche, BMS, MSD, Merck-Serono, Pfizer, Lilly, Amgen, Boehringer, AstraZeneca, Takeda, Bayer, and Sanofi. Payment honoraria: Roche, BMs, MSD, Merck-Serono, Pfizer, Lilly, Amgen, Boehringer, Astrazeneca, Takeda, Bayer, and Sanofi. Support For attending meetings and travel: MSD, Roche, and BMS. AI consulting fees: Pfizer, Amgen, and AstraZeneca. Payment for expert testimony: Bristol, Pfizer, Takeda, Roche, and AstraZeneca. Support for attending meetings or travels: Roche and Bristol. MRG-C reports personal fees from BMS, personal fees from MSD, personal fees from Roche, personal fees from Pfizer, personal fees from AstraZeneca, outside the submitted work; ML-Q: payment for honoraria: BMS, MSD, Ipsen, Astella, AstraZeneca, and Pfizer. Support for attendings meetings/travels: MSD, Takeda, Janssen, Pfizer, and BMS. MD reports personal fees from Astra-Zeneca, personal fees from BMS, personal fees from Boehringer Ingelheim, personal fees from MSD, personal fees from Pfizer, personal fees from Roche, outside the submitted work; MM reports grants and personal fees from BMS, personal fees and non-financial support from MSD, personal fees and non-financial support from Boehringer Ingelheim; personal fees, non-financial support, and other from AstraZeneca; personal fees, non-financial support, and other from Roche; personal fees from Kyowa Kyrin; personal fees from Pierre Fabre, outside the submitted work; DR-A: consulting fees: Roche, AstraZeneca, BMS, MSD, Lilly, Pfizer, and Novartis. Payment for honoraria: Roche, Astrazeneca, BMS, MSD, Lilly, Pfizer, and Novartis. Support for attending meetings/travels: Roche, MSD, and Novartis; AM-M: advisory board: AstraZeneca, BMS, Roche, MSD, and Pfizer. Speaker's bureau: AstraZeneca, BMS, Roche, MSD, and Pfizer. Support for attending meetings or travel: AstraZeneca, BMS, Roche, MSD, Pfizer, and Lilly. Payment for expert testimony: AstraZeneca. Steering committee member: AstraZeneca. JDCC reports personal fees from Astra Zeneca, personal fees from Boehringer Ingelheim, personal fees from Merck Sharp and Dohme, personal fees from Hoffmann-la Roche, personal fees from Bristol-Myers Squibb, personal fees from Takeda, personal fees from Pfizer, personal fees from Novartis, outside the submitted work; IBA reports consulting or advisory board for Bristol Myers, Takeda, Roche, AstraZeneca, and Behringer Inngelheim; BM reports grants and personal fees from Roche, personal fees and other from BMS, personal fees from Takeda, other from MSD, personal fees from Boehringer, other from Takeda, outside the submitted work; AR: consulting fees: AstraZeneca. Payment or honoraria: Vivo diagnóstico. Advisory board: Takeda. VC: payment or honoraria: Roche, BMS, MSD, AstraZeneca, and Boehringer.
Figures

References
-
- FDA . Opdivo label 2022, 2022.
Publication types
MeSH terms
Substances
LinkOut - more resources
Full Text Sources
Other Literature Sources
Medical
Research Materials
Miscellaneous