Simple and Efficient 3D-Printed Superfusion Chamber for Electrophysiological and Neuroimaging Recordings In Vivo
- PMID: 36171056
- PMCID: PMC9536851
- DOI: 10.1523/ENEURO.0305-22.2022
Simple and Efficient 3D-Printed Superfusion Chamber for Electrophysiological and Neuroimaging Recordings In Vivo
Abstract
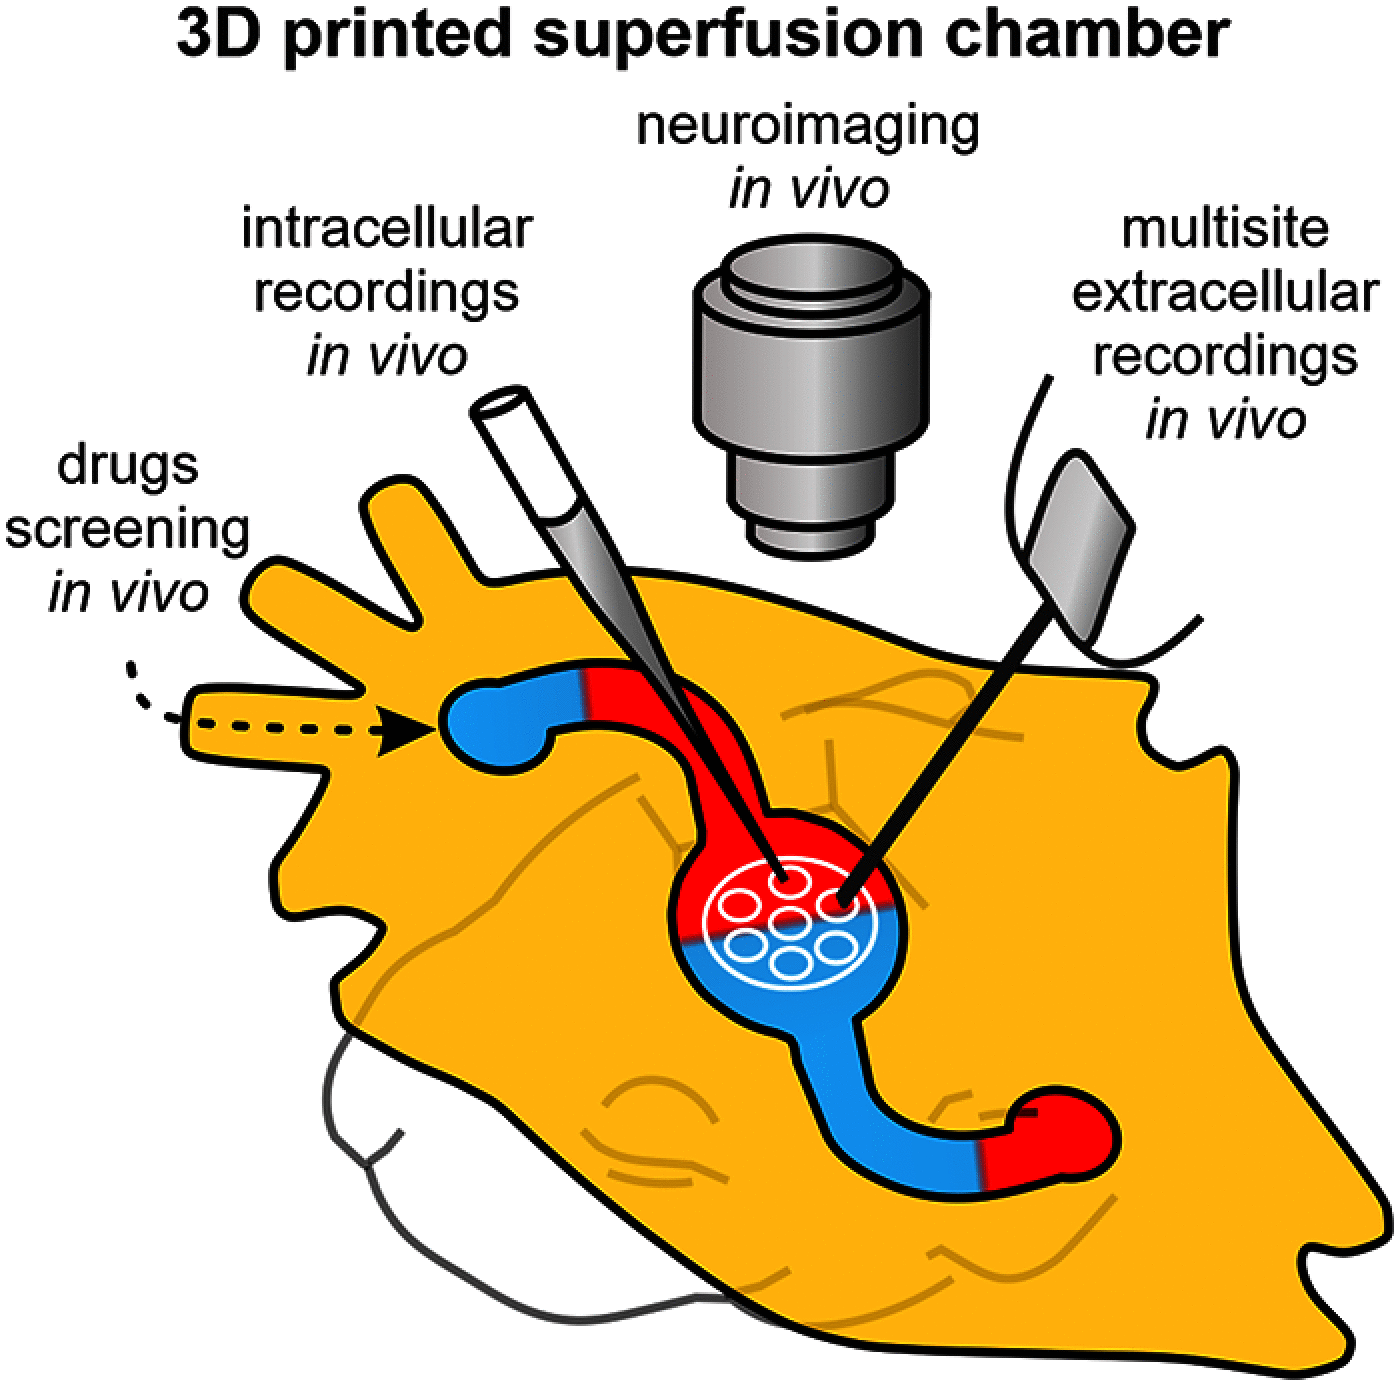
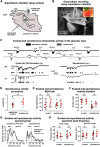
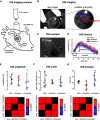
In vitro and in vivo experimentation in the central nervous system are effective approaches to study its functioning. Manipulations in vitro are characterized by easy experimental control and stable experimental conditions. However, transferring these advantages to in vivo research remains technically and ethically challenging, preventing many research teams from acquiring critical recordings in their animal models. In order to transfer the benefits of in vitro experimentation to in vivo experimentation, we developed a suite of 3D-printed tools (a superfusion chamber with an independent brain presser and animal stand). Using the immature rat barrel cortex as a model, we show that our set of tools (further "superfusion preparation") provides stable conditions for electrophysiological and neuroimaging recordings in the neonatal rat neocortex in vivo Highly correlated intracellular and extracellular activity was recorded during spontaneous and evoked cortical activity, supporting the possibility of simultaneous long-lasting electrophysiological recordings from a single cortical column in vivo The optical intrinsic signal of evoked cortical responses was also recorded from the skull-free neocortex, suggesting the effective combination of the superfusion preparation with neuroimaging approaches. Modulation of immature activity by epicortical application of pharmacological agents via superfusion equally supports the use of the superfused cortex preparation in pharmacological screening. In addition to high efficiency (in affordability, reliability, and ease of use in vivo), the 3D-printed set of tools developed should reduce animal use, supporting the 3Rs principle (Replacement, Reduction, and Refinement) of ethical use of animals.
Keywords: 3D printing; drugs screening; electrophysiology; in vivo; neuroimaging.
Copyright © 2022 Suchkov et al.
Figures


Similar articles
-
3D printed rodent skin-skull-brain model: A novel animal-free approach for neurosurgical training.PLoS One. 2021 Jun 23;16(6):e0253477. doi: 10.1371/journal.pone.0253477. eCollection 2021. PLoS One. 2021. PMID: 34161366 Free PMC article.
-
Multi-material Electrohydrodynamic Printing of Bioelectronics with Sub-Microscale 3D Gold Pillars for In Vitro Extra- and Intra-Cellular Electrophysiological Recordings.Adv Sci (Weinh). 2025 Mar;12(9):e2407969. doi: 10.1002/advs.202407969. Epub 2025 Jan 10. Adv Sci (Weinh). 2025. PMID: 39792774 Free PMC article.
-
Engineering of brain-like tissue constructs via 3D Cell-printing technology.Biofabrication. 2020 May 12;12(3):035016. doi: 10.1088/1758-5090/ab7d76. Biofabrication. 2020. PMID: 32143204
-
Infra-slow fluctuations in electrophysiological recordings, blood-oxygenation-level-dependent signals, and psychophysical time series.Neuroimage. 2012 Oct 1;62(4):2201-11. doi: 10.1016/j.neuroimage.2012.02.060. Epub 2012 Feb 28. Neuroimage. 2012. PMID: 22401756 Review.
-
Review of imaging network activities in developing rodent cerebral cortex in vivo.Neurophotonics. 2017 Jul;4(3):031202. doi: 10.1117/1.NPh.4.3.031202. Epub 2016 Nov 23. Neurophotonics. 2017. PMID: 27921066 Free PMC article. Review.
Cited by
-
Dexmedetomidine as a Short-Use Analgesia for the Immature Nervous System.Int J Mol Sci. 2024 Jun 9;25(12):6385. doi: 10.3390/ijms25126385. Int J Mol Sci. 2024. PMID: 38928091 Free PMC article.
References
-
- Ackman JB, Zeng H, Crair MC (2014) Structured dynamics of neural activity across developing neocortex. bioRxiv . doi: 10.1101/012237.10.1101/012237 - DOI
-
- Bolaños F, Bolaños L, Balbi M, Michelson N, LeDue J, Murphy T (2018) Mesoscale cortical calcium imaging reveals widespread synchronized infraslow activity during social touch in mice. bioRxiv . doi: 10.1101/430306.10.1101/430306 - DOI
Publication types
MeSH terms
LinkOut - more resources
Full Text Sources
