

Functional connectivity of the cortico-subcortical sensorimotor loop is modulated by the severity of nigrostriatal dopaminergic denervation in Parkinson's Disease
- PMID: 36171211
- PMCID: PMC9519637
- DOI: 10.1038/s41531-022-00385-w
Functional connectivity of the cortico-subcortical sensorimotor loop is modulated by the severity of nigrostriatal dopaminergic denervation in Parkinson's Disease
Abstract
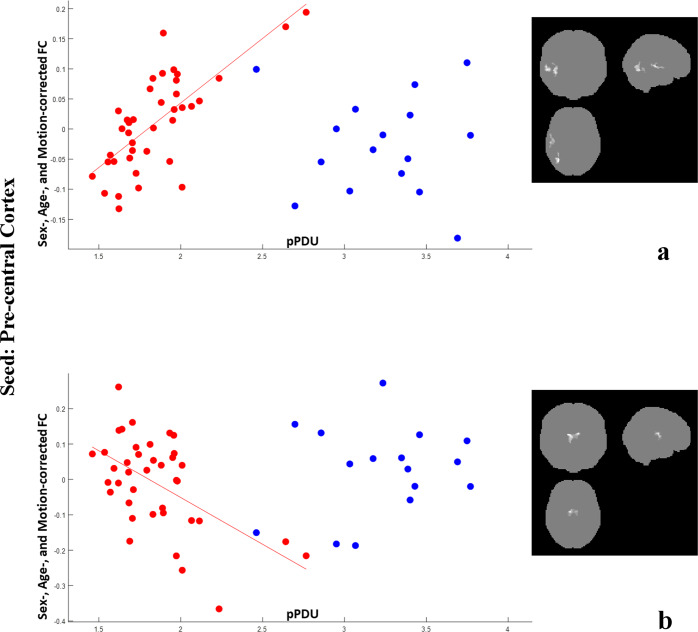
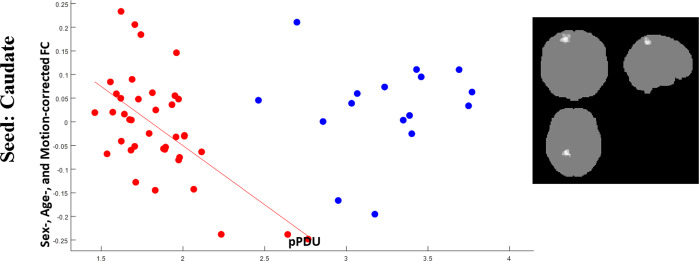
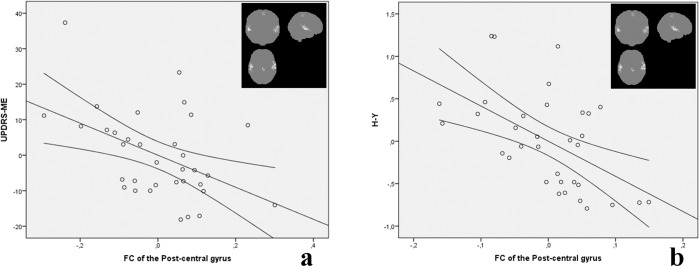
To assess if the severity of nigrostriatal innervation loss affects the functional connectivity (FC) of the sensorimotor cortico-striato-thalamic-cortical loop (CSTCL) in Parkinson's Disease (PD), Resting-State functional MRI and 18F-DOPA PET data, simultaneously acquired on a hybrid PET/MRI scanner, were retrospectively analyzed in 39 PD and 16 essential tremor patients. Correlations between posterior Putamen DOPA Uptake (pPDU) and the FC of the main CSTCL hubs were assessed separately in the two groups, analyzing the differences between the two groups by a group-by-pPDU interaction analysis of the resulting clusters' FC. Unlike in essential tremor, in PD patients pPDU correlated inversely with the FC of the thalamus with the sensorimotor cortices, and of the postcentral gyrus with the dorsal cerebellum, and directly with the FC of pre- and post-central gyri with both the superior and middle temporal gyri and the paracentral lobule, and of the caudate with the superior parietal cortex. The interaction analysis confirmed the significance of the difference between the two groups in these correlations. In PD patients, the post-central cortex FC, in the clusters correlating directly with pPDU, negatively correlated with both UPDRS motor examination score and Hoehn and Yahr stage, independent of the pPDU, suggesting that these FC changes contribute to motor impairment. In PD, nigrostriatal innervation loss correlates with a decrease in the FC within the sensorimotor network and between the sensorimotor network and the superior temporal cortices, possibly contributing to motor impairment, and with a strengthening of the thalamo-cortical FC, that may represent ineffective compensatory phenomena.
© 2022. The Author(s).
Conflict of interest statement
The authors declare no competing interests.
Figures


Similar articles
-
Patterns of striatal and cerebellar functional connectivity in early-stage drug-naïve patients with Parkinson's disease subtypes.Neuroradiology. 2018 Dec;60(12):1323-1333. doi: 10.1007/s00234-018-2101-6. Epub 2018 Sep 22. Neuroradiology. 2018. PMID: 30244415
-
Network degeneration in Parkinson's disease: multimodal imaging of nigro-striato-cortical dysfunction.Brain. 2020 Mar 1;143(3):944-959. doi: 10.1093/brain/awaa019. Brain. 2020. PMID: 32057084
-
Cortico-striatal-thalamic network functional connectivity in hemiparkinsonism.Neurobiol Aging. 2014 Nov;35(11):2592-2602. doi: 10.1016/j.neurobiolaging.2014.05.032. Epub 2014 Jun 11. Neurobiol Aging. 2014. PMID: 25004890
-
Post mortem studies in Parkinson's disease--is it possible to detect brain areas for specific symptoms?J Neural Transm Suppl. 1999;56:1-29. doi: 10.1007/978-3-7091-6360-3_1. J Neural Transm Suppl. 1999. PMID: 10370901 Review.
-
Molecular imaging of movement disorders.World J Radiol. 2016 Mar 28;8(3):226-39. doi: 10.4329/wjr.v8.i3.226. World J Radiol. 2016. PMID: 27029029 Free PMC article. Review.
Cited by
-
Large-scale functional network connectivity mediates the association between nigral neuromelanin hypopigmentation and motor impairment in Parkinson's disease.Brain Struct Funct. 2024 May;229(4):843-852. doi: 10.1007/s00429-024-02761-z. Epub 2024 Feb 12. Brain Struct Funct. 2024. PMID: 38347222
-
Altered brain connectivity in hyperkinetic movement disorders: A review of resting-state fMRI.Neuroimage Clin. 2023;37:103302. doi: 10.1016/j.nicl.2022.103302. Epub 2022 Dec 24. Neuroimage Clin. 2023. PMID: 36669351 Free PMC article.
-
A systematic review of the challenges, emerging solutions and applications, and future directions of PET/MRI in Parkinson's disease.EJNMMI Rep. 2024 Feb 14;8(1):3. doi: 10.1186/s41824-024-00194-9. EJNMMI Rep. 2024. PMID: 38748251 Free PMC article. Review.
-
Drooling disrupts the brain functional connectivity network in Parkinson's disease.CNS Neurosci Ther. 2023 Oct;29(10):3094-3107. doi: 10.1111/cns.14251. Epub 2023 May 5. CNS Neurosci Ther. 2023. PMID: 37144606 Free PMC article.
-
Early Alterations in De Novo Parkinson's Disease Revealed by Diffusion Tensor Imaging: Preliminary Study.Diagnostics (Basel). 2025 Mar 25;15(7):841. doi: 10.3390/diagnostics15070841. Diagnostics (Basel). 2025. PMID: 40218191 Free PMC article.
References
LinkOut - more resources
Full Text Sources
