. 2022 Oct;610(7930):161-172.
doi: 10.1038/s41586-022-05192-0. Epub 2022 Sep 28.

PD-1-cis IL-2R agonism yields better effectors from stem-like CD8+ T cells

Affiliations

PD-1-cis IL-2R agonism yields better effectors from stem-like CD8+ T cells

Laura Codarri Deak et al. Nature. 2022 Oct.

Abstract

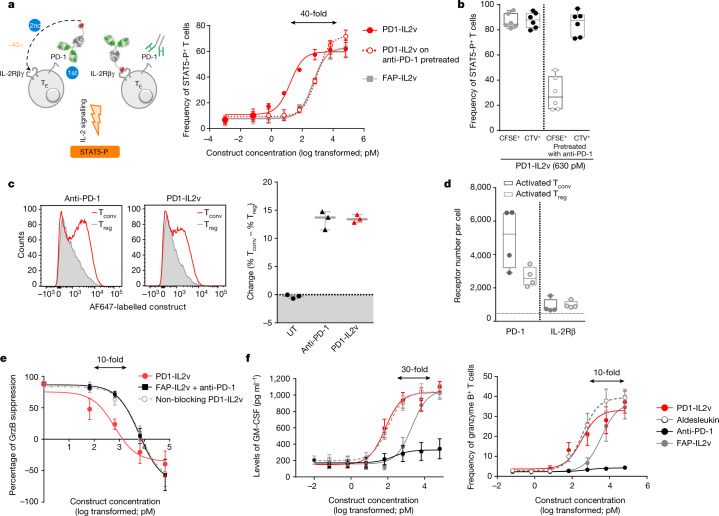
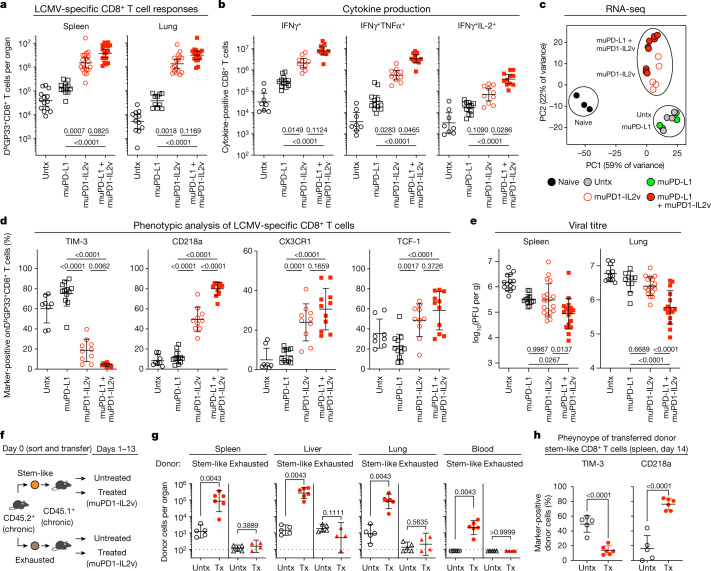
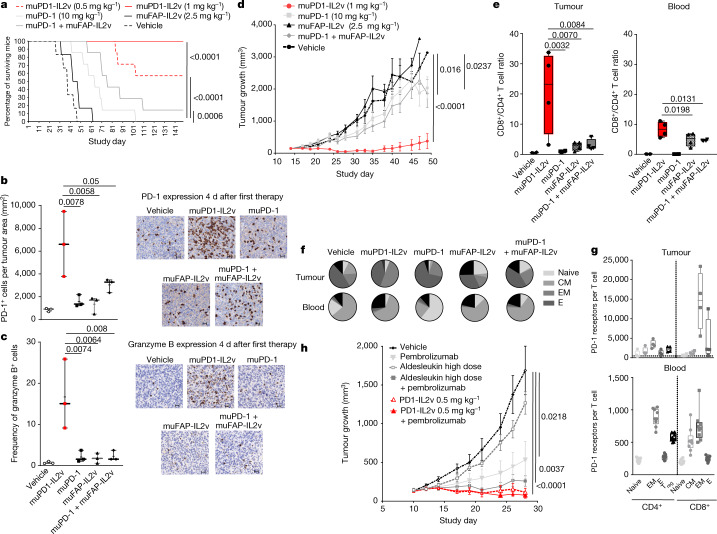
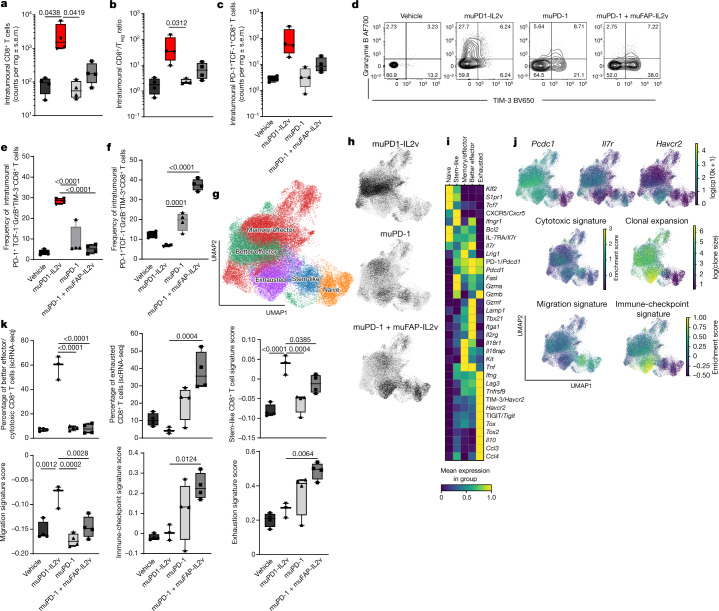
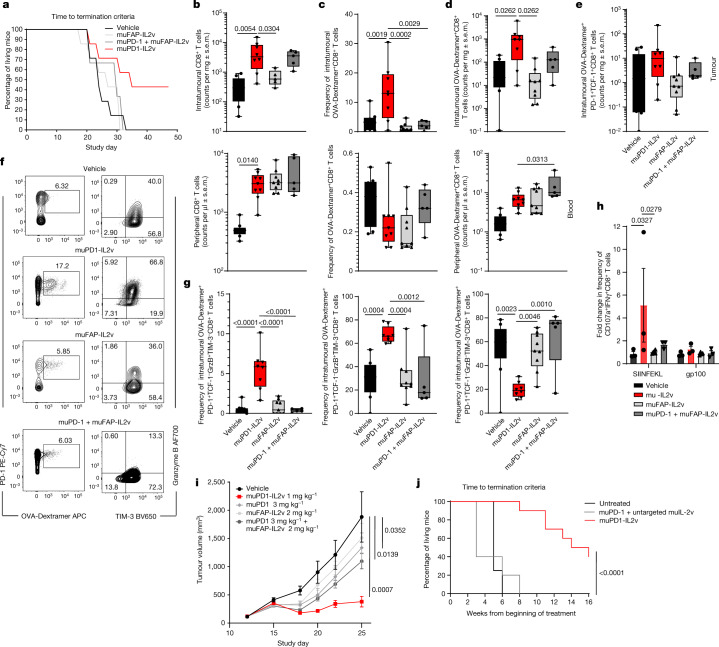
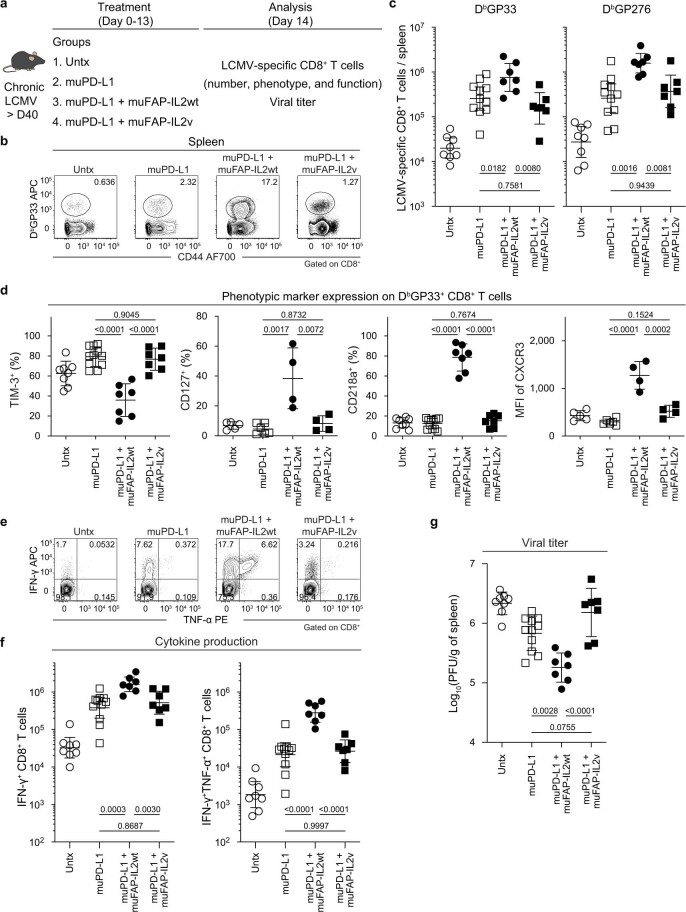
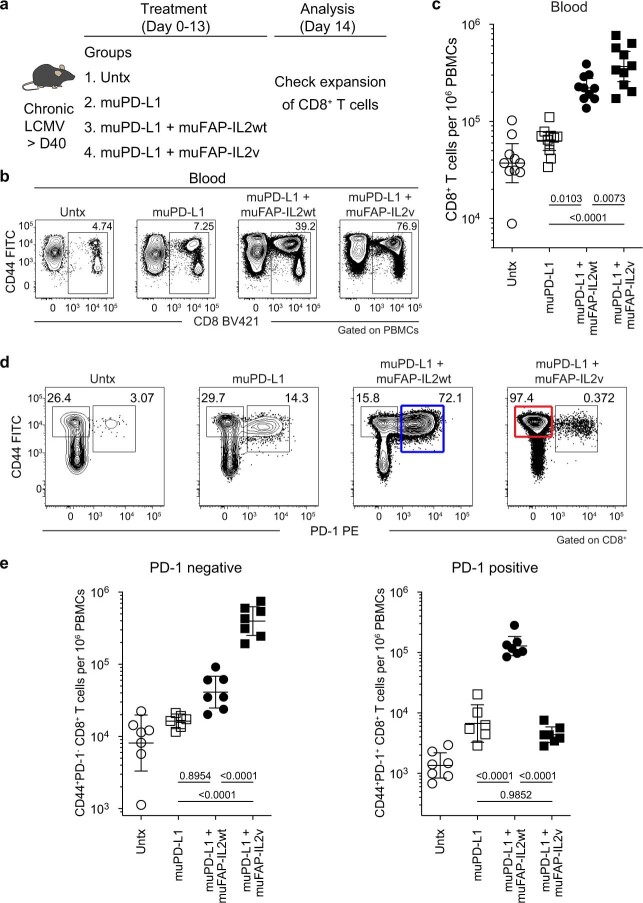
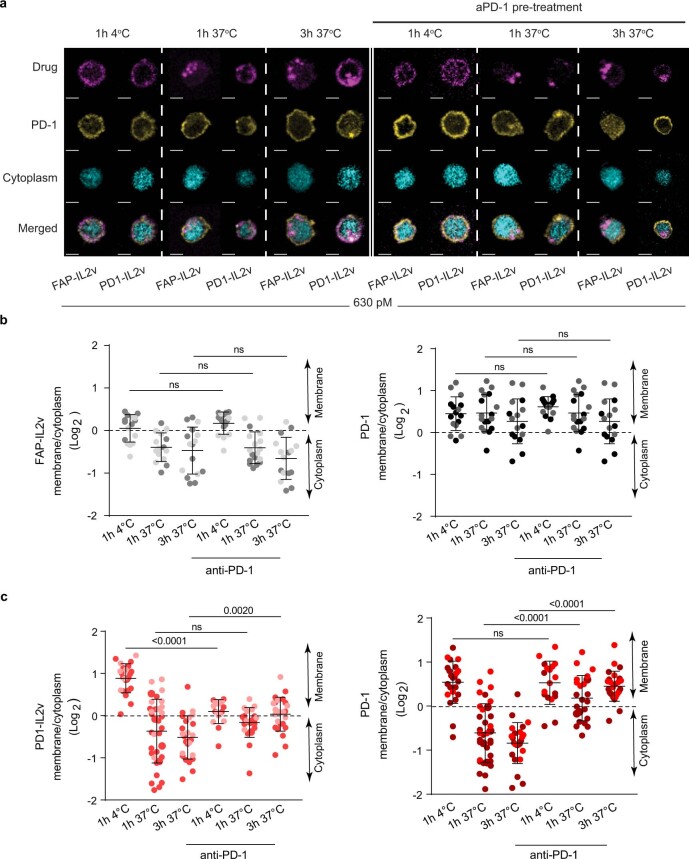
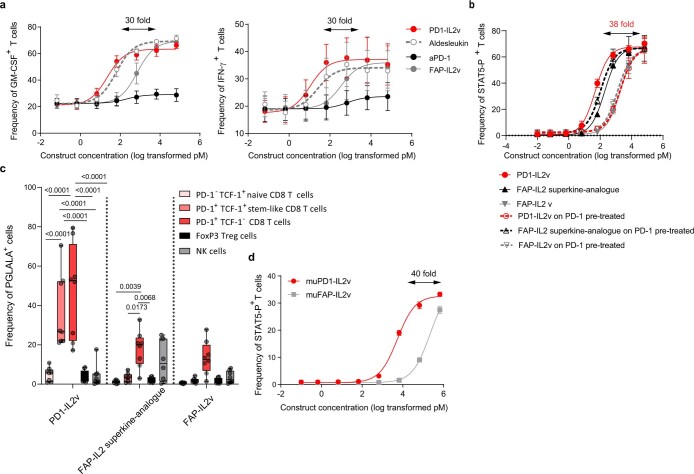
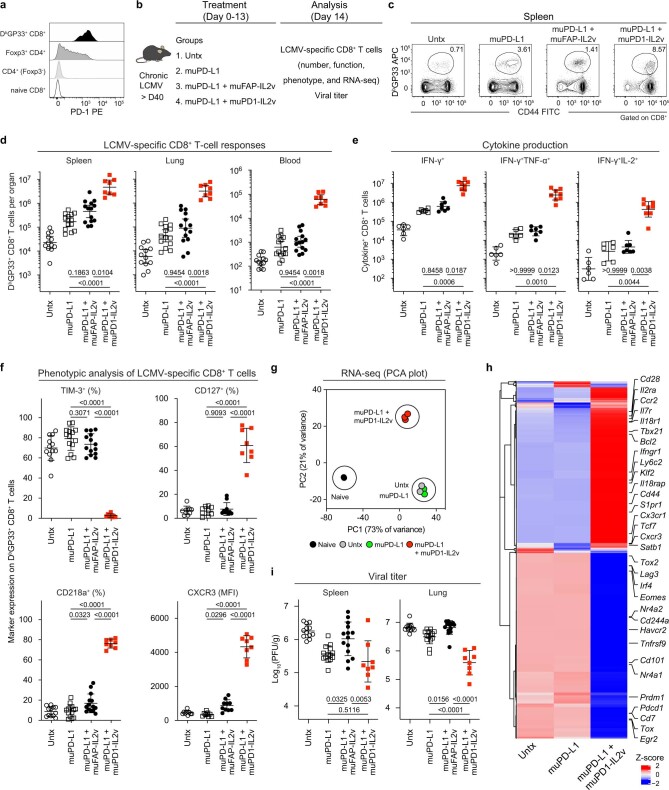
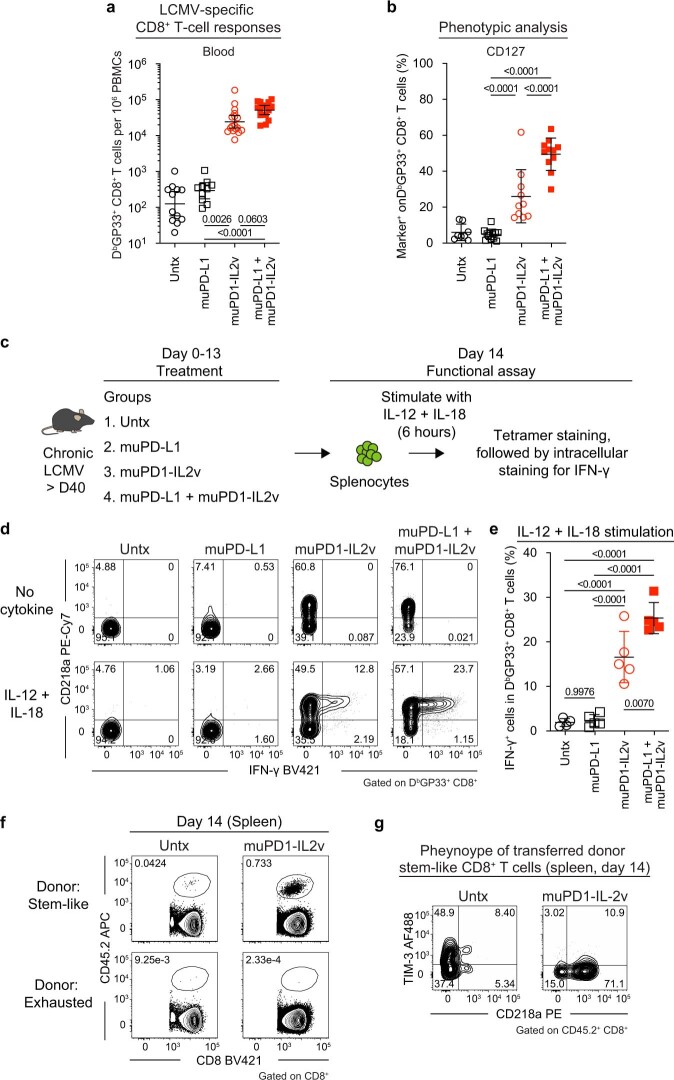
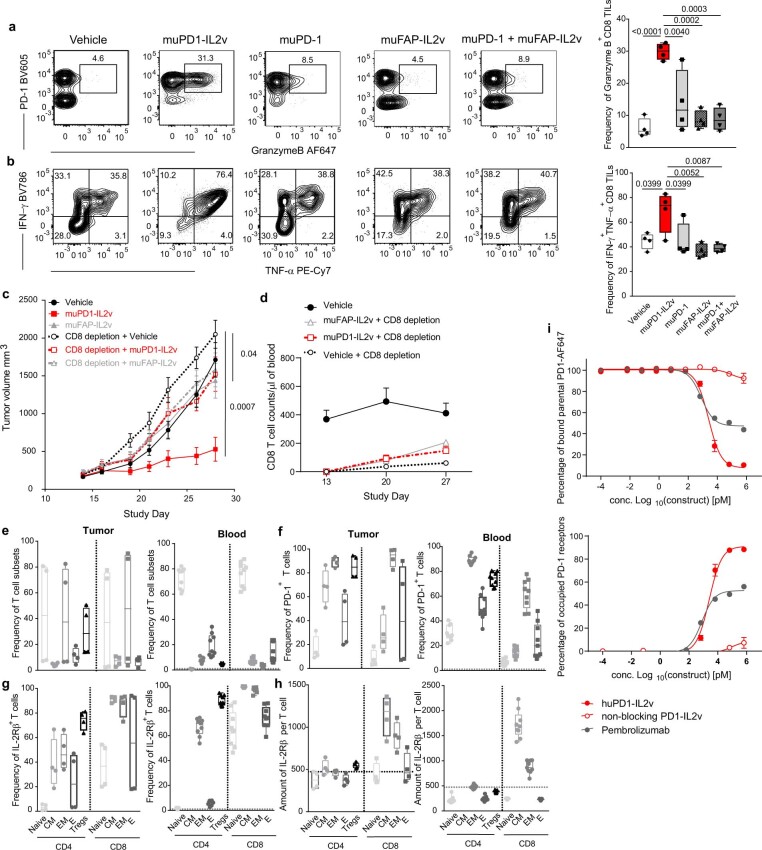
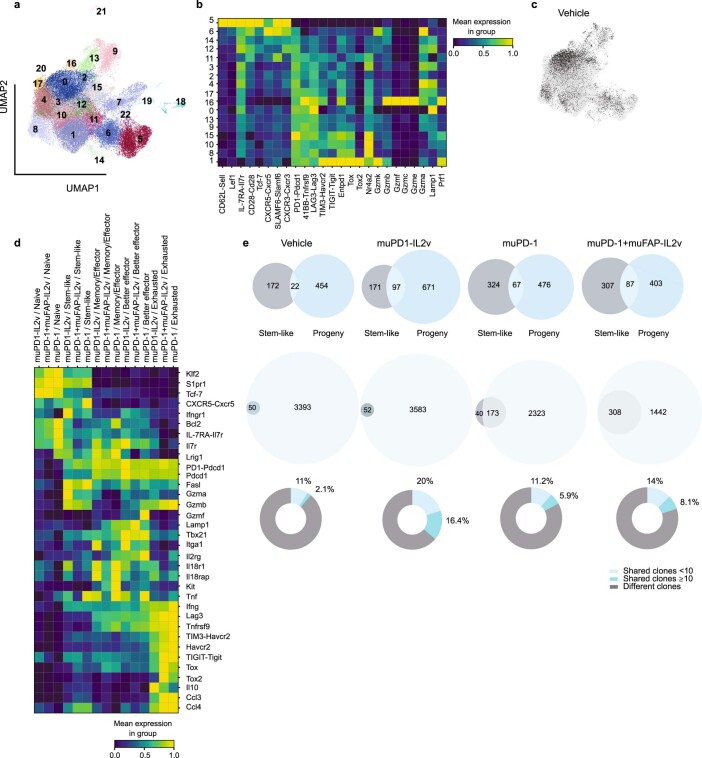
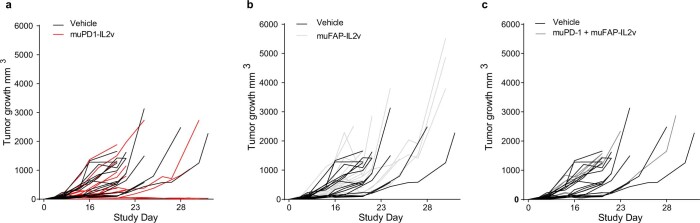
Expansion and differentiation of antigen-experienced PD-1+TCF-1+ stem-like CD8+ T cells into effector cells is critical for the success of immunotherapies based on PD-1 blockade1-4. Hashimoto et al. have shown that, in chronic infections, administration of the cytokine interleukin (IL)-2 triggers an alternative differentiation path of stem-like T cells towards a distinct population of 'better effector' CD8+ T cells similar to those generated in an acute infection5. IL-2 binding to the IL-2 receptor α-chain (CD25) was essential in triggering this alternative differentiation path and expanding better effectors with distinct transcriptional and epigenetic profiles. However, constitutive expression of CD25 on regulatory T cells and some endothelial cells also contributes to unwanted systemic effects from IL-2 therapy. Therefore, engineered IL-2 receptor β- and γ-chain (IL-2Rβγ)-biased agonists are currently being developed6-10. Here we show that IL-2Rβγ-biased agonists are unable to preferentially expand better effector T cells in cancer models and describe PD1-IL2v, a new immunocytokine that overcomes the need for CD25 binding by docking in cis to PD-1. Cis binding of PD1-IL2v to PD-1 and IL-2Rβγ on the same cell recovers the ability to differentiate stem-like CD8+ T cells into better effectors in the absence of CD25 binding in both chronic infection and cancer models and provides superior efficacy. By contrast, PD-1- or PD-L1-blocking antibodies alone, or their combination with clinically relevant doses of non-PD-1-targeted IL2v, cannot expand this unique subset of better effector T cells and instead lead to the accumulation of terminally differentiated, exhausted T cells. These findings provide the basis for the development of a new generation of PD-1 cis-targeted IL-2R agonists with enhanced therapeutic potential for the treatment of cancer and chronic infections.


Conflict of interest statement

Patent application number 15/943,237, with relevance to this work, has been filed by Roche. L.C.D., C.K., L.L., V.N., S.S., I.W. and P.U. are named inventors on this patent family. R.A. holds patents related to the PD-1 pathway. H.K., M.H. and R.A. declare no additional financial interests. L.C.D., V.N., M.K., P.S., L.L., E.M.V., M.R., E.B., J.S., S.J., F.C., M.P., L.K., E.Y., T.H., R.S., M.M., V. Tosevski, S.H., M.B., I.W., S.C., X.G., S.L., A.F.-G., S.S., V. Teichgräber, C.K. and P.U. are employees of Roche and declare ownership of Roche stock. Work performed at Emory for this manuscript was supported by the Roche pRED ROADS program.

Figures

Fig. 1
Fig. 1. PD1-IL2v mediates cis delivery of IL-2v to PD-1+ T cells, providing preferential stimulation of PD-1+ T cells, overcoming Treg-mediated suppression and inducing T cell effector functions.
a, Frequency of in vitro-activated polyclonal human STAT5-P+CD4+ T cells following exposure for 12 min to increasing concentrations of either PD1-IL2v or FAP-IL2v. As an additional control, a portion of the PD-1+ T cells were pretreated with anti-PD-1 antibody to prevent PD-1-mediated targeting of PD1-IL2v (dotted line) (n = 3 healthy donors, 3 independent experiments; mean ± s.e.m.). TE, effector T cell; αPD-1, anti-PD-1 antibody. Arrows indicate the difference in potency. b, Frequency of in vitro-activated polyclonal human STAT5-P+CD4+ T cells following exposure for 12 min to 630 pM PD1-IL2v of CFSE-labelled PD-1+ or PD-1-preblocked (PD-1) T cells co-cultured with CTV-labelled PD-1+ T cells (n = 6 healthy donors, 3 independent experiments; box plots represent the median, minimum/maximum and individual points). c, Left, flow cytometry histogram plots of binding competition of directly conjugated anti-PD-1 antibody or PD1-IL2v to human CD4+ Tconv versus Treg cells, cultured together, from one representative donor of three. Right, change in the frequency of human CD4+ Tconv and Treg cells stained with labelled anti-PD-1 antibody or PD1-IL2v (n = 3 healthy donors, 3 independent experiments; mean ± s.e.m.). UT, untreated. d, Number of PD-1 receptors and IL-2Rβ per T cell on Tconv and Treg cells (n = 4 healthy donors; box plots represent the median, minimum/maximum and individual points). e, Treg suppression of Tconv secretion of granzyme B (GrzB) in the presence of increasing concentrations of PD1-IL2v, FAP-IL2v in combination with anti-PD-1 antibody, and non-blocking PD1-IL2v (n = 5 healthy donors, 5 independent experiments; mean ±s.e.m.). f, Dose-dependent GM-CSF and granzyme B secretion by in vitro-activated polyclonal human CD4+ T cells following stimulation for 5 d with increasing concentrations of PD1-IL2v, aldesleukin, FAP-IL2v or anti-PD-1 antibody (n = 4 healthy donors, 2 independent experiments; mean ± s.e.m.).
Fig. 2
Fig. 2. Targeted delivery of IL-2v to PD-1+ T cells using the muPD1-IL2v construct increases LCMV-specific CD8+ T cell responses and improves viral control during chronic infection by enhancing the proliferation and differentiation of PD-1+TCF-1+ stem-like resource CD8+ T cells.
Chronically LCMV-infected mice (more than 40 d after infection) were left untreated (Untx) or treated with muPD-L1, muPD1-IL2v or muPD-L1 + muPD1-IL2v for 2 weeks and then analysed for CD8+ T cell responses and viral titre. a, Numbers of DbGP33+CD8+ T cells in the indicated tissues. b, Number of IFNγ+, IFNγ+TNFα+ and IFNγ+IL-2+ LCMV-specific CD8+ T cells in the spleen. c, PCA plot of RNA-seq data for naive CD8+ T cells from uninfected mice and DbGP33+CD8+ T cells from chronically LCMV-infected mice after the indicated treatments. d, Phenotypic marker expression on DbGP33+CD8+ T cells in the spleen. e, Viral titre in the indicated tissues. PFU, plaque-forming units. f, Experimental design for T cell transfer experiments. Sorted stem-like (PD-1+CXCR5+TIM-3) and exhausted (PD-1+CXCR5TIM-3+) CD8+ T cells isolated from CD45.2+ chronically LCMV-infected mice (more than 40 d after infection) were adoptively transferred into infection-matched CD45.1+ recipient mice, followed by muPD1-IL2v therapy for 2 weeks. g, Numbers of donor CD45.2+CD8+ T cells in various tissues. The dotted line on the y axis indicates the limit of detection for the number of donor cells. Tx, treated. h, TIM-3 and CD218a expression on transferred donor stem-like CD45.2+CD8+ T cells in the spleen of recipients after 2 weeks of treatment. Results were pooled from 4–7 experiments with n = 2–4 mice per group in each experiment (a,b,d,e) or from two experiments with n = 4–6 mice per group (g,h). RNA-seq data are from Extended Data Fig. 5 and additional samples from six experiments to obtain various CD8+ T cell populations with n = 1–15 mice per group in each experiment (c). Data are presented as the geometric mean and 95% confidence interval (CI) (a,b,g) or the mean and s.d. (d,e,h) with P values. Statistical comparisons were performed using the Kruskal–Wallis test with Dunn’s multiple-comparisons test (a,b), one-way ANOVA with Tukey’s multiple-comparisons test (d,e), the Mann–Whitney test (two tailed) (g) or an unpaired two-tailed t test (h). Source Data
Fig. 3
Fig. 3. muPD1-IL2v favours CD8+ versus CD4+ T cells in the tumour microenvironment and expands less differentiated TILs, which provide tumour eradication and survival benefit to treated mice.
In vivo efficacy study in syngeneic or human PD-1-transgenic mice bearing orthotopic or subcutaneous Panc02-H7-Fluc tumours treated for 4 or 2 weeks, respectively, with the indicated treatment options. a, Survival curve, in days, of control syngeneic mice and mice receiving the indicated therapies bearing an orthotopic tumour (n = 7 mice per treatment group). b,c, Number of PD-1+ cells (b) and frequency of granzyme B+ cells (c) within the tumour by immunohistochemistry; scale bars, 20 μm  (n = 3; box plots represent median, minimum/maximum and individual points). d, Tumour growth curves of subcutaneous tumours in syngeneic control mice and mice treated with the indicated therapies (n = 6 mice per treatment group; mean ± s.e.m.). e,f, CD8+ to CD4+ T cell ratio (e) and T cell differentiation state (f) in the tumour and blood of mice across different treatment groups (n = 4; box plots represent the median, minimum/maximum and individual points). CM, central memory; E, effector; EM, effector memory; other cells are in black. g, Quantification of PD-1 receptors per cell on the surface of T cells isolated from the tumours and blood of untreated human PD-1-transgenic mice (n = 4 and n = 9 mice, respectively, from more than two independent experiments; box plots represent the median, minimum/maximum and individual points). h, Tumour growth curves of subcutaneous tumours in human PD-1-transgenic mice receiving the respective therapies (n = 7–12 mice per treatment group; mean ± s.e.m.). In af and h, n ≥ 3 independent experiments. To test for significant differences in tumour growth inhibition between group means for multiple comparisons, standard ANOVA (one-way ANOVA) was used with Dunnett’s post hoc test in the Panc02 mouse tumour model. Wilcoxon’s test was used for survival analysis of the orthotopic Panc02 mouse tumour model. Statistical comparisons among multiple immuno-pharmacodynamic groups were performed using one-way ANOVA with Tukey’s multiple-comparisons test. Source Data
Fig. 4
Fig. 4. muPD1-IL2v expands and differentiates PD-1+TCF-1+ stem-like resource CD8+ TILs into a new population of better effector CD8+ TILs.
Immuno-pharmacodynamic study on the effect of the different therapies, given twice, on the abundance, phenotype, effector function and molecular signature of intratumoural CD8+ T cells obtained from syngeneic mice bearing subcutaneous Panc02-H7-Fluc tumours. a, Number of intratumoural CD8+ T cells. b, CD8+ T cell to Treg ratio within the tumour. c, Number of stem-like (PD-1+TCF-1+) CD8+ T cells. In ac, n = 4 (box plots represent the median, minimum/maximum and individual points; treatment groups appear in the same order in each panel). d, Representative contour plots depicting granzyme B and TIM-3 expression on PD-1+TCF-1CD8+ TILs from tumour single-cell suspensions acquired by flow cytometry 3 d after administration of the second dose of the treatment as indicated. e,f, Frequencies of granzyme B+TIM-3 (e) and granzyme BTIM-3+ (f) intratumoural PD-1+TCF-1CD8+ T cells (n = 4; box plots represent the median, minimum/maximum and individual points). g,h, Two-dimensional (2D) UMAP visualization of CD8+ TILs coloured according to subset (g) and specific treatment effect (h). i, Average relative expression of selected genes (RNA and/or protein level) across the distinct T cell subsets within the CD8+ TILs depicted in g and h. j, Expression of selected markers, signature scores and TCR clonal expansion among CD8+ TILs using a 2D UMAP visualization as in g and h. log(cp10k), natural logarithm of counts per 10,000; log(clone size), natural logarithm of clone size. k, Percentage of better effectors and exhausted CD8+ T cells relative to all CD8+ TILs across the different treatments and average signature enrichment scores among effector CD8+ T cells per treatment group and individual animal (3–4 mice per group; box plots represent the median, minimum/maximum and individual points). In a and k, n = 3–4 mice per group per experiment, >3 independent experiments; statistical comparisons were performed using one-way or two-way ANOVA with Dunnett’s multiple-comparisons test. Source Data
Fig. 5
Fig. 5. muPD1-IL2v provides survival benefit and control of tumour growth in mice with subcutaneous B16-F10-OVA tumours by expanding cytotoxic OVA-specific better effector CD8+ TILs.
In vivo efficacy study and immuno-pharmacodynamic study on the effect of the different therapies, given twice, on the number, phenotype and effector function of intratumoural and peripheral CD8+ T cells in syngeneic mice bearing subcutaneous B16-F10-OVA tumours. ad, Survival (a), counts of total CD8+ T cells (b), and frequency (c) and count (d) of OVA-specific CD8+ T cells in the tumour and blood of syngeneic mice bearing subcutaneous B16-F10-OVA tumours receiving the indicated treatment (n = 5–8; box plots represent the median, minimum/maximum and individual points). e, Treatment effect on counts of intratumoural OVA-specific PD-1+TCF-1+ stem-like CD8+ T cells (n = 5–8; box plots represent the median, minimum/maximum and individual points). f, Representative contour plots depicting PD-1+OVA-Dextramer+ double-positive CD8+ TILs and their granzyme B and TIM-3 expression 3 d after administration of the second dose of treatment as indicated. g, Treatment effect on frequencies of granzyme B+TIM-3 (left), granzyme B+TIM-3+ (middle) and granzyme BTIM-3+ (right) intratumoural OVA-specific CD8+ T cells (n = 5–8; box plots represent the median, minimum/maximum and individual points). h, Fold increase in the frequency of CD107a+IFNγ+CD8+ TILs from the different treatment groups following re-stimulation for 5 h with either SIINFEKL or gp100 peptide (n = 3; box plots represent the median, minimum/maximum and individual points). i, Tumour growth inhibition in the MCA-205 sarcoma model in syngeneic mice (n = 9 mice per treatment group; mean ± s.e.m.). j, Survival graph of tumour-bearing RIP-Tag5 mice either left untreated or subjected to treatment as indicated. Tumour progression was monitored by ultrasound imaging for 16 weeks. Two mice in the muPD1-IL2v group developed hyperglycaemia due to complete islet tumour regression and had to be killed before the predefined study end of 16 weeks. These mice were still counted as complete responders. Numbers of mice were as follows: untreated, n = 4; muPD1 + untargeted muIL-2v, n = 5; muPD1-IL2v, n = 10. Statistical analysis was performed by log-rank Mantel–Cox test: muPD1-IL2v versus muPD1 + untargeted muIL-2v, P < 0.0001. In ah, n = 5–8 mice per treatment group, 2 independent experiments; statistical comparisons were performed using one-way or two-way ANOVA with Dunnett’s multiple-comparisons test. Source Data
Extended Data Fig. 1
Extended Data Fig. 1. MuFAP-IL2v fails to synergize with muPD-L1 therapy during chronic LCMV infection.
a, Chronically LCMV-infected mice (> day 40 post-infection) were left untreated or treated with muPD-L1, muPD-L1 + muFAP-IL2wt, and muPD-L1 + muFAP-IL2v therapy for 2 weeks and then CD8+ T-cell responses and viral titer were examined. b, Representative FACS plots for DbGP33+ CD8+ T cells in spleen. c, Numbers of DbGP33+ and DbGP276+ CD8+ T cells. d, Phenotypic marker expression on DbGP33+ CD8+ T cells. e, Representative FACS plots for IFN-γ+ and INF-γ+TNF-α+ LCMV-specific CD8+ T cells. f, Numbers of IFN-γ+ and INF-γ+TNF-α+ LCMV-specific CD8+ T cells. g, Viral titer in spleen. Results were pooled from 2-3 experiments with n = 2–5 mice per group in each experiment. Data are presented as geometric mean and 95% CI (c,f) or mean and SD (d,g) with p values. Statistical comparisons were performed using one-way ANOVA with Tukey’s multiple comparison test. Untx, untreated; AF, Alexa Fluor. Source Data
Extended Data Fig. 2
Extended Data Fig. 2. MuFAP-IL2v is biologically active in vivo but non-specifically expands CD8 T cells.
a, Chronically LCMV-infected mice (> day 40 post-infection) were left untreated or treated with muPD-L1, muPD-L1 + muFAP-IL2wt, and muPD-L1 + muFAP-IL2v for 2 weeks and then analyzed for expansion of CD8 T cells. b, Representative FACS plots for CD8+ T cells in PBMCs. c, Numbers of CD8+ T cells per 106 PBMCs. d, Representative FACS plots for CD44 and PD-1 expressions on CD8+ T cells in PBMCs. e, Numbers of CD44+PD-1 and CD44+PD-1+ CD8+ T cells per 106 PBMCs. Results were pooled from 3-4 experiments with n = 2–5 mice per group in each experiment. Data are presented as geometric mean and 95% CI with p values. Statistical comparisons were performed using one-way ANOVA with Tukey’s multiple comparison test. Untx, untreated. Source Data
Extended Data Fig. 3
Extended Data Fig. 3. PD1-IL2v is internalized upon binding to PD-1 and IL-2Rβγ and drives the internalization of the bound PD-1 receptors.
a. Representative confocal images of IL2v and PD-1 receptor internalization kinetics at 37 °C in in vitro activated polyclonal PD-1+ CD4 T cells upon incubation with 630 pM of PD1-IL2v or FAP-IL2v for 1 or 3 h, with or without anti-PD1 pre-treatment to prevent PD-1 binding by PD1-IL2v. PD1-IL2v and FAP-IL2v are in pink, PD-1 surface staining in yellow, and the cytoplasm is in cyan. bc. Quantification of average drug intensity in membrane/cytoplasm (Log2). Log2 = 0: Equal amount of drug at the membrane and in the cytoplasm (dotted line). Log2>0: More drug is on the membrane. Log2<0: Drug localizes in the cytoplasm. Each dot represents quantification from a single CD4 T cell; clear and dark dots indicate T cells derived from two different donors, from 2 independent experiments. Mean and SD are shown. One-way ANOVA with a post hoc Tukey multiple comparison test.
Extended Data Fig. 4
Extended Data Fig. 4. In vitro CD4 T cell activation and cytokine release by PD1-IL2v and in vivo expansion of antigen-specific polyfunctional CD8 T cells by muPD1-IL2v.
a. Dose dependent increase in frequencies of GM-CSF+ and IFN-γ+ human polyclonal CD4 T cells upon 5 days of in vitro stimulation with increasing concentrations of either PD1-IL2v, Aldesleukin, FAP-IL2v or PD-1 antibody (n = 4 healthy donors, 2 independent experiments, mean ± SEM). b. Frequency of in vitro activated, polyclonal human STAT5-P+ CD4 T cells upon exposure for 12 min to increasing concentrations of either PD1-IL2v, FAP-IL2v or FAP-IL2 superkine-analogue. As additional control, part of the PD-1+ T cells were pre-treated with PD-1 antibody to prevent PD-1-mediated targeting of PD1-IL2v (dotted line) (n = 2 donors from 2 independent experiments, mean ± SEM). c. Targeting of several T cell subsets and NK cells from fresh PBMCs by PD1-IL2v, FAP-IL2v and FAP-IL2 superkine-analogue (n = 8 healthy donors from 4 independent experiments, box plots representing median, minimum/maximum and individual points). Statistical comparisons were performed using two-way ANOVA with Tukey’s multiple comparison test. d. Frequency of in vitro activated, STAT5-P+ murine CD4 T cells upon exposure for 12 min to increasing concentrations of either muPD1-IL2v or muFAP-IL2v in vitro (n = 2 mice from 2 independent experiments, mean ± SEM.
Extended Data Fig. 5
Extended Data Fig. 5. Comparative analysis of muPD1-IL2v versus muFAP-IL2v in combination therapy with muPD-L1 during chronic LCMV infection.
a, Representative histogram for expression of PD-1 by DbGP33+ CD8+ T cells, Foxp3+ CD4+ T cells (Tregs), conventional (Foxp3) CD4+ T cells, and naïve (CD44lo) CD8+ T cells. All T cells except naïve CD8+ T cells were isolated from spleens of chronically LCMV-infected mice (> day 40 post-infection). Naïve CD8+ T cells were isolated from uninfected C57BL/6J mice. The results are representative of two experiments (n = 6 for chronically LCMV-infected mice and n = 2 for uninfected mice). b, Chronically LCMV-infected mice (> day 40 post-infection) were treated with muPD-L1, muPD-L1 + muFAP-IL2v, and muPD-L1 + muPD1-IL2v for 2 weeks and then analyzed for CD8 T-cell responses and viral titer. c, Representative FACS plots for DbGP33+ CD8+ T cells in spleen. d, Numbers of DbGP33+ CD8+ T cells in the indicated tissues. e, Numbers of IFN-γ+, INF-γ+TNF-α+, and INF-γ+IL-2+ LCMV-specific CD8+ T cells in spleen. f, Phenotypic marker expression on DbGP33+ CD8+ T cells in spleen. g, PCA plot of RNA-seq for naïve CD8+ T cells from uninfected mice and DbGP33+ CD8+ T cells from chronically LCMV-infected mice after the indicated treatments. h, Heat map showing mean relative expressions of all differentially expressed genes (n = 1954) across treatment groups. i, Viral titer in the indicated tissues. Results were pooled from 3–5 experiments with n = 2–5 mice per group in each experiment (cf, i). RNA-seq data for groups of naive, Untx, and muPD-L1 were obtained from GSE206722. RNA-seq data for muPD-L1 + muPD1-IL2v group were generated from biological triplicates with n = 2 mice per replicate (g,h). Data are presented as geometric mean and 95% CI (d,e) or mean and SD (f,i) with p values. Statistical comparisons were performed using Kruskal-Wallis test with Dunn’s multiple comparison test (d,e), one-way ANOVA with Tukey’s multiple comparison test (f,i). Untx, untreated. Source Data
Extended Data Fig. 6
Extended Data Fig. 6. Immunotherapy of chronically LCMV-infected mice with muPD-L1 and muPD1-IL2v.
Chronically LCMV-infected mice (> day 40 post-infection) were left untreated or treated with muPD-L1, muPD1-IL2v, and muPD-L1 + muPD1-IL2v for 2 weeks and then analyzed for CD8 T-cell responses. a, Numbers of DbGP33+ CD8+ T cells per 1 x10⁶ PBMCs. b, CD127 expression on DbGP33+ CD8+ T cells in spleen. c, Spleen cells were isolated from chronically LCMV-infected mice after the indicated treatments for 2 weeks. One million cells were cultured with recombinant mouse IL-12 and IL-18 (20 ng/ml each) for 5 h, then GolgiPlug was added, followed by culturing for 1 h. Cells were stained with surface markers including DbGP33-specific tetramer, fixed, and followed by intracellular staining for IFN-γ. d, Representative FACS plots for co-staining of CD218a and IFN-γ gated on DbGP33+ CD8+ T cells. e, Frequency of IFN-γ+ cells among DdGP33+ CD8+ T cells in response to stimulation with IL-12 + IL-18. f, g, Sorted stem-like (PD-1+CXCR5+TIM-3) and exhausted (PD-1+CXCR5TIM-3+) CD8+ T cells isolated from CD45.2+ chronically LCMV-infected mice (> 40 days post-infection) were adoptively transferred into infection-matched CD45.1+ recipient mice, followed by muPD1-IL2v therapy for 2 weeks. Representative FACS plots for the frequency of donor CD45.2+ cells (f) and TIM-3 and CD218a expression on transferred donor stem-like CD45.2+ CD8+ T cells in spleen of recipients after 2 weeks of the treatments (g). Results were pooled from 2–6 experiments with n = 2–4 mice per group in each experiment. Data are presented as geometric mean and 95% CI (a) or mean and SD (b,e) with p values. Statistical comparisons were performed using Kruskal-Wallis test with Dunn’s multiple comparison test (a) or one-way ANOVA with Tukey’s multiple comparison test (b,e). Untx, untreated; AF, Alexa Fluor. Source Data
Extended Data Fig. 7
Extended Data Fig. 7. CD8 T cells acquire a polyfunctional effector profile upon muPD1-IL2v and are critical for its efficacy. Frequency and amount of PD-1 and IL-2Rβ per T cell in the tumor and blood of huPD1-transgenic mice.
a-b. Left, representative FACS contour plot of PD-1+ CD8 TILs secreting granzyme B, IFN-γ and TNF-α across different treatment groups; right, frequency of PD-1+ granzyme B+ and IFN-γ+ TNF-α+ CD8 TILs (n = 4 mice per group per experiment from 3 independent experiments, box plots representing median, minimum/maximum and individual points). Statistical comparisons were performed using one-way ANOVA with Tukey’s multiple comparison test. c. Tumor growth inhibition and d. CD8 T cell count in blood of syngeneic mice bearing subcutaneous Panc02-H7-Fluc tumors with or without CD8 depletion before the start of the indicated treatments (n = 11 mice per treatment group, mean ± SEM). eh. Frequencies of receptor positive T cells and quantification of PD-1 receptors and IL-2Rβ on T cells isolated from tumors and blood of untreated human PD-1 transgenic mice bearing Panc02-H7-Fluc (n = 4 and n = 9 mice respectively, box plots representing median, minimum/maximum and individual points). i. (Top) Percentage of directly conjugated Alexa Fluor-647 parental anti-PD-1 bound to 3 days activated CD4 T cells previously exposed to increasing concentrations of either PD1-IL2v, pembrolizumab or non-blocking PD1-IL2v; (bottom) percentage of PD-1 receptors occupied by either PD1-IL2v, pembrolizumab or non-blocking PD1-IL2v and therefore unavailable for binding of the directly conjugated Alexa Fluor-647 parental anti-PD1 (n = 2 healthy donors from 2 independent experiments, mean ± SEM). Source Data
Extended Data Fig. 8
Extended Data Fig. 8. MuPD1-IL2v expands PD-1+ TCF-1+ stem-like resource CD8+ TILs and their progeny and enhances their cytotoxicity.
a. Joint 2D UMAP visualization of all cells across all treatments and individual mice colored according to Leiden clusters. b. Selected relative average marker expression at RNA and protein (in capitals) level identifies the majority of cells as CD8 T cells as expected (21, 18, 19 exception, 7 myeloid/T cell doublet, 22 Th17, 20 regulatory T cell specific expression within CD8+) (left). Among CD8 T cell clusters, 5 shows naïve specific, 6 stem-like, 11 and 1 exhausted-like, 3, 4, 12, 14, 16, 17 better effector and the rest more broadly memory/effector-like (right). c. 2D UMAP visualization of the CD8 T cell distribution in the vehicle (control) group. d. Relative marker expression stratified per cell type and treatment for 3 main treatment groups: muPD1-IL2v, muPD-1 monotherapy and combination with FAP-IL2v. e. (Top) Number of distinct TCR clones present within stem-like T cells, within their progeny (all CD8 effector/exhausted subsets) and the ones shared between the two per treatment group; (middle) number of cells (normalized to 10.000) with a high clonotype expansion (≥10), per treatment group; (bottom) percentages of TCR clones in the stem-like T cells that are shared with their progeny with low clonotype (<10) or high clonotype expansion (≥10). (a-e). n = 3-4 mice per treatment group.
Extended Data Fig. 9
Extended Data Fig. 9. Tumor growth inhibition and survival curves in B16-F10-OVA tumor mouse model.
a. Tumor growth kinetics upon muPD1-IL2v, b. muFAP-IL2v and c. muPD-1 in combination with muFAP-IL2v. (a-c) n = 5-8 mice per treatment group, 2 independent experiments. Source Data

Comment in

References

    1. Siddiqui I, et al. Intratumoral Tcf1+PD-1+CD8+ T cells with stem-like properties promote tumor control in response to vaccination and checkpoint blockade immunotherapy. Immunity. 2019;50:195–211. doi: 10.1016/j.immuni.2018.12.021. - DOI - PubMed
    1. Jansen CS, et al. An intra-tumoral niche maintains and differentiates stem-like CD8 T cells. Nature. 2019;576:465–470. doi: 10.1038/s41586-019-1836-5. - DOI - PMC - PubMed
    1. Miller BC, et al. Subsets of exhausted CD8+ T cells differentially mediate tumor control and respond to checkpoint blockade. Nat. Immunol. 2019;20:326–336. doi: 10.1038/s41590-019-0312-6. - DOI - PMC - PubMed
    1. Hudson WH, et al. Proliferating transitory T cells with an effector-like transcriptional signature emerge from PD-1+ stem-like CD8+ T cells during chronic infection. Immunity. 2019;51:1043–1058. doi: 10.1016/j.immuni.2019.11.002. - DOI - PMC - PubMed
    1. Hashimoto, M. et al. PD-1 combination therapy with IL-2 modifies CD8+ T cell exhaustion program. Nature10.1038/s41586-022-05257-0 (2022). - PMC - PubMed

Publication types

MeSH terms