. 2022 Oct;610(7930):205-211.
doi: 10.1038/s41586-022-05255-2. Epub 2022 Sep 28.

Visualizing translation dynamics at atomic detail inside a bacterial cell

Affiliations

Visualizing translation dynamics at atomic detail inside a bacterial cell

Liang Xue et al. Nature. 2022 Oct.

Erratum in

Abstract

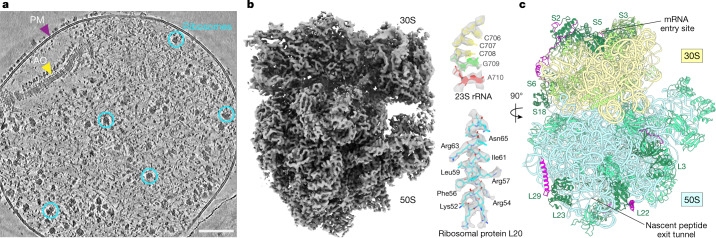
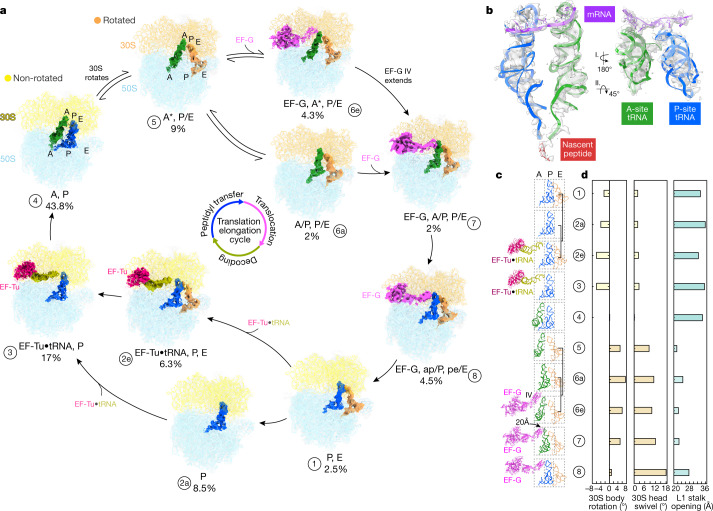
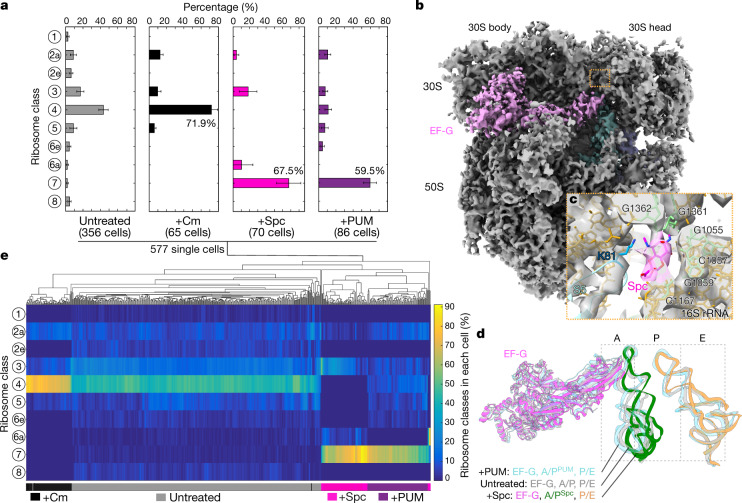
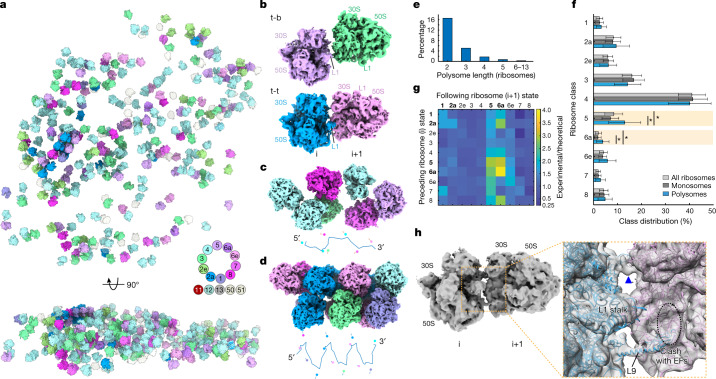
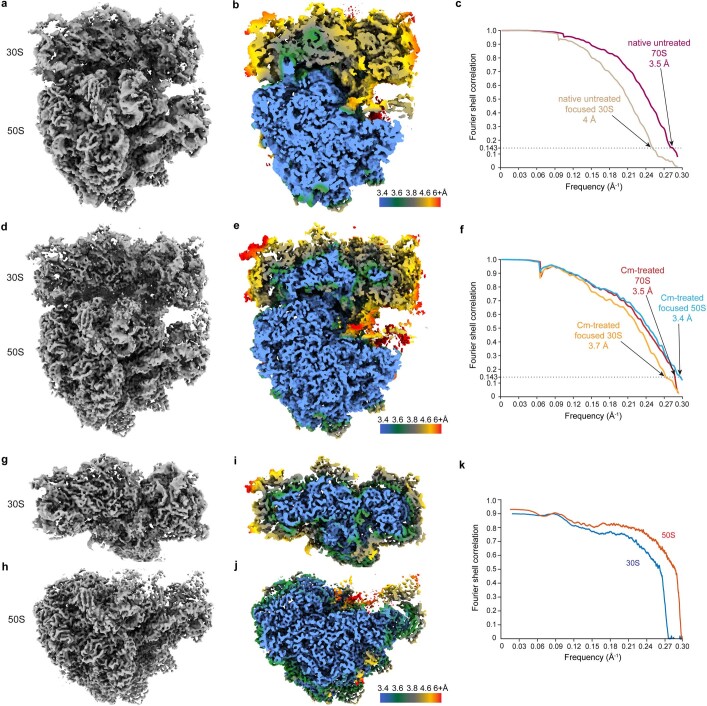
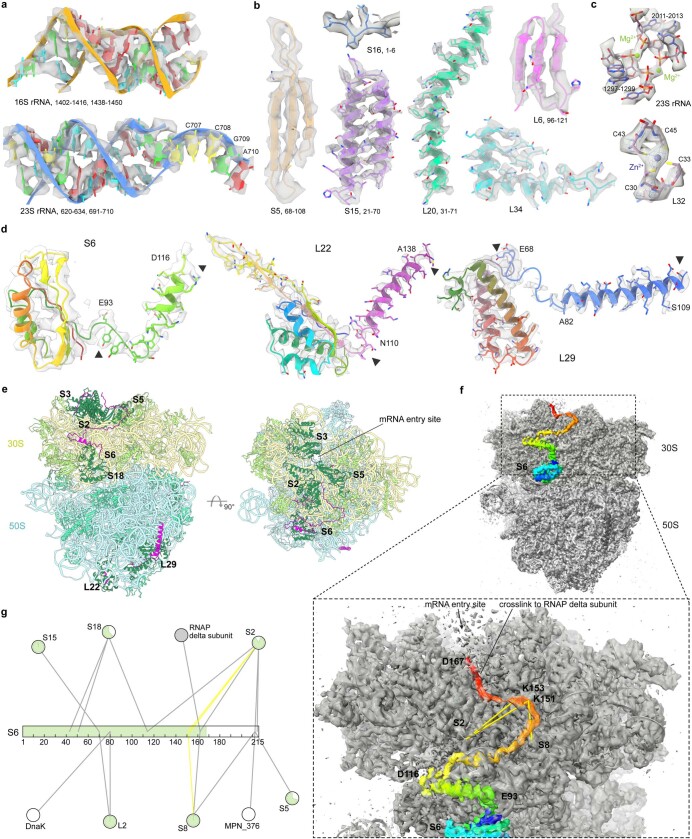
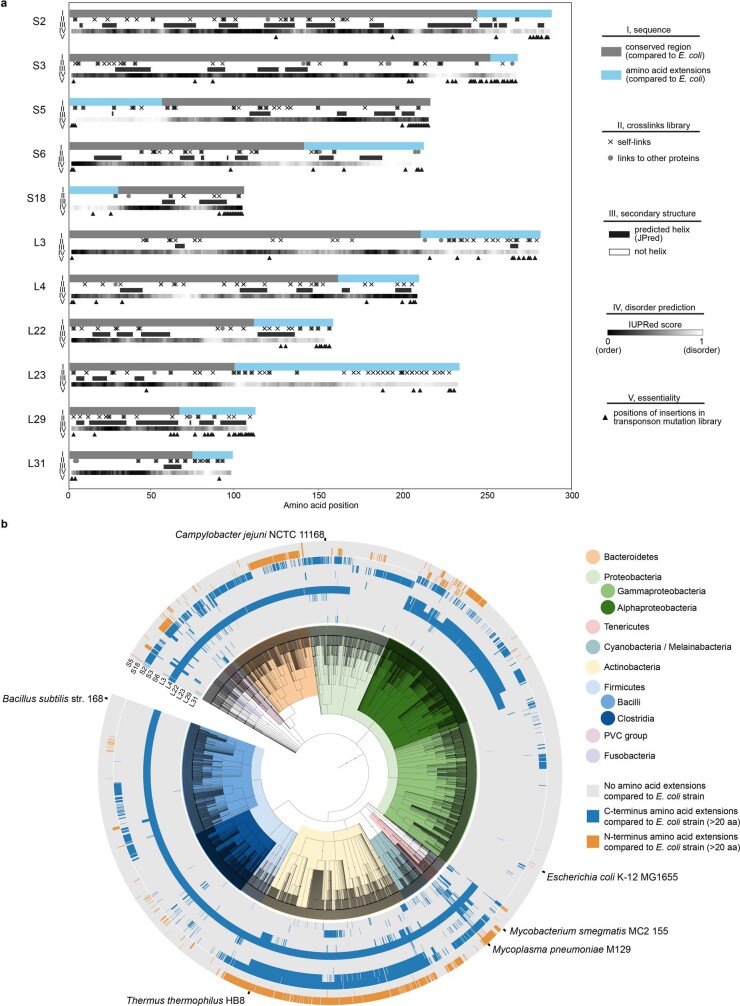
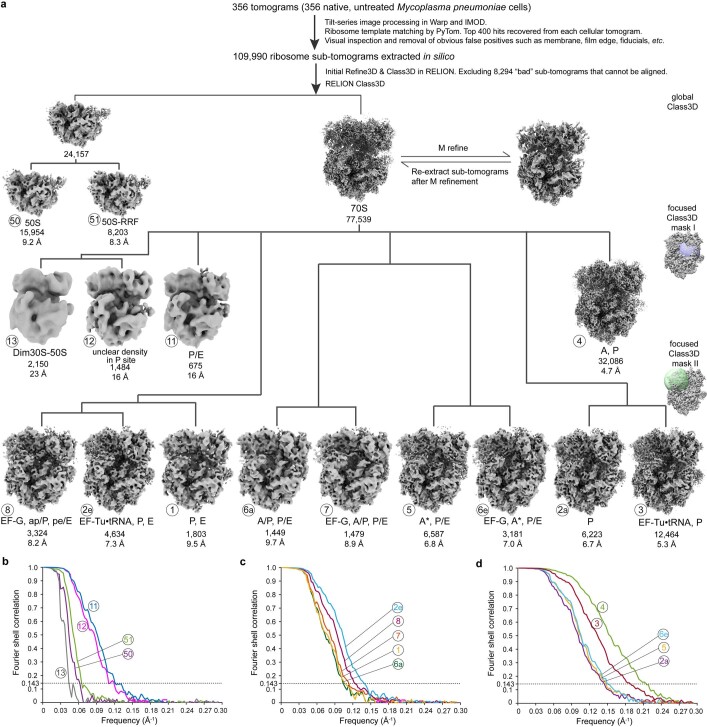
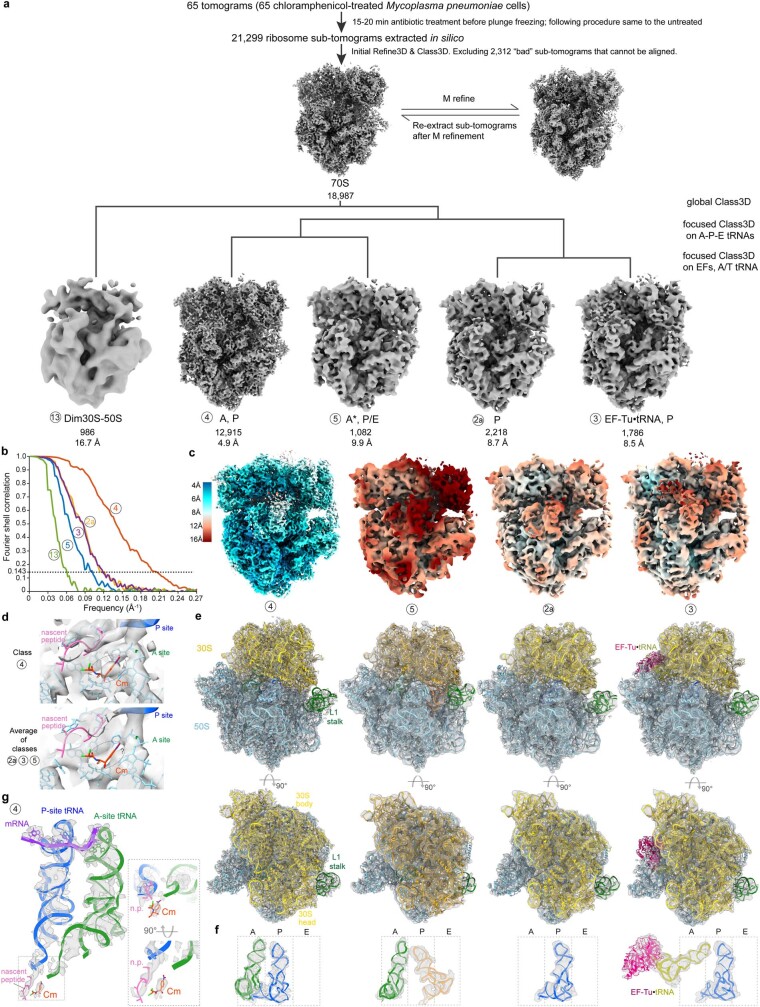
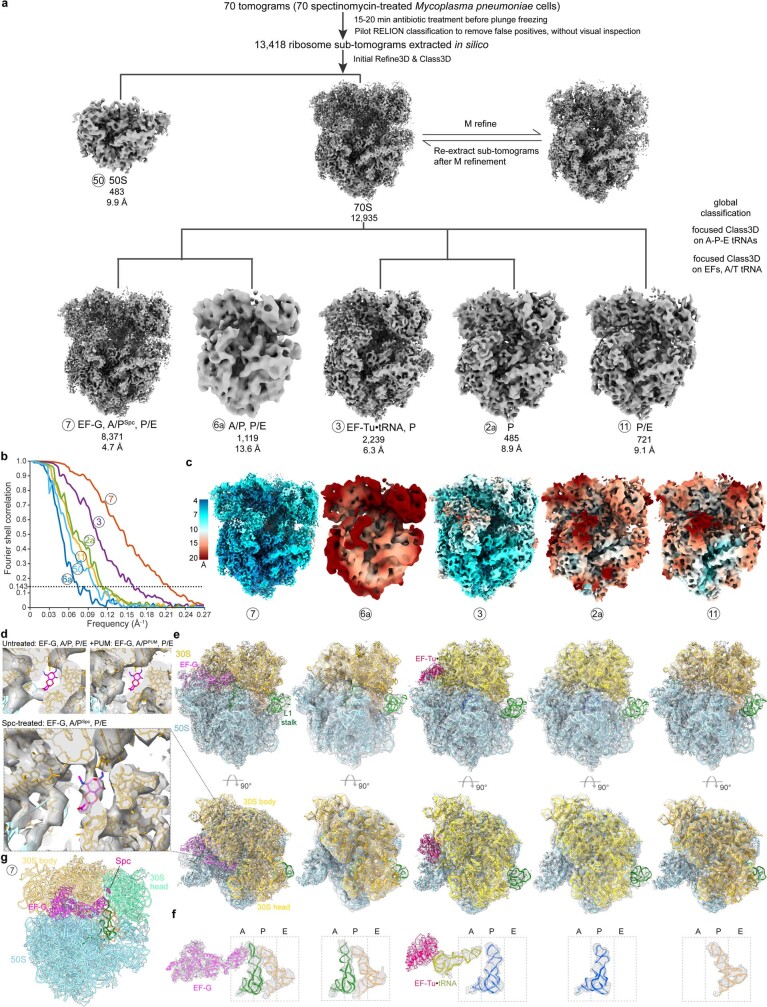
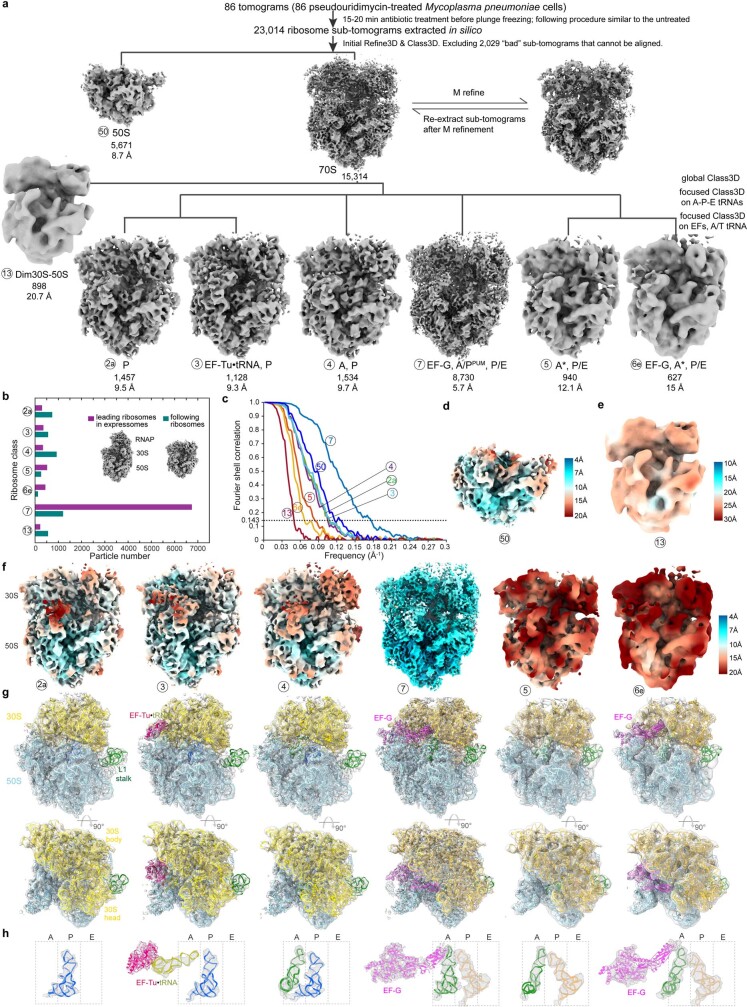
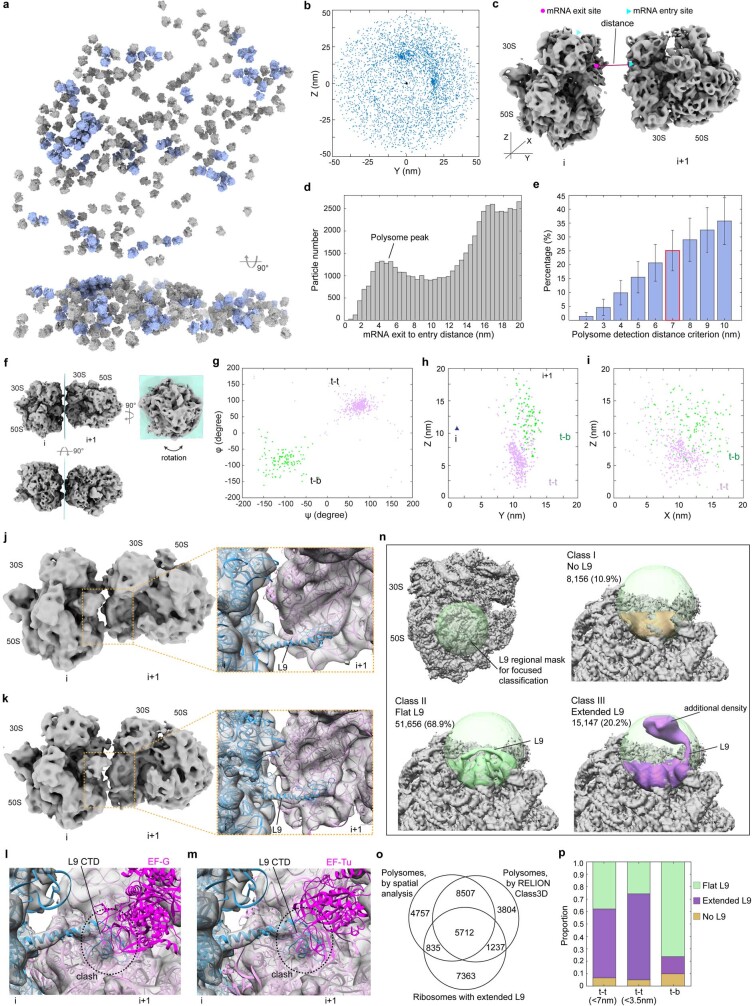
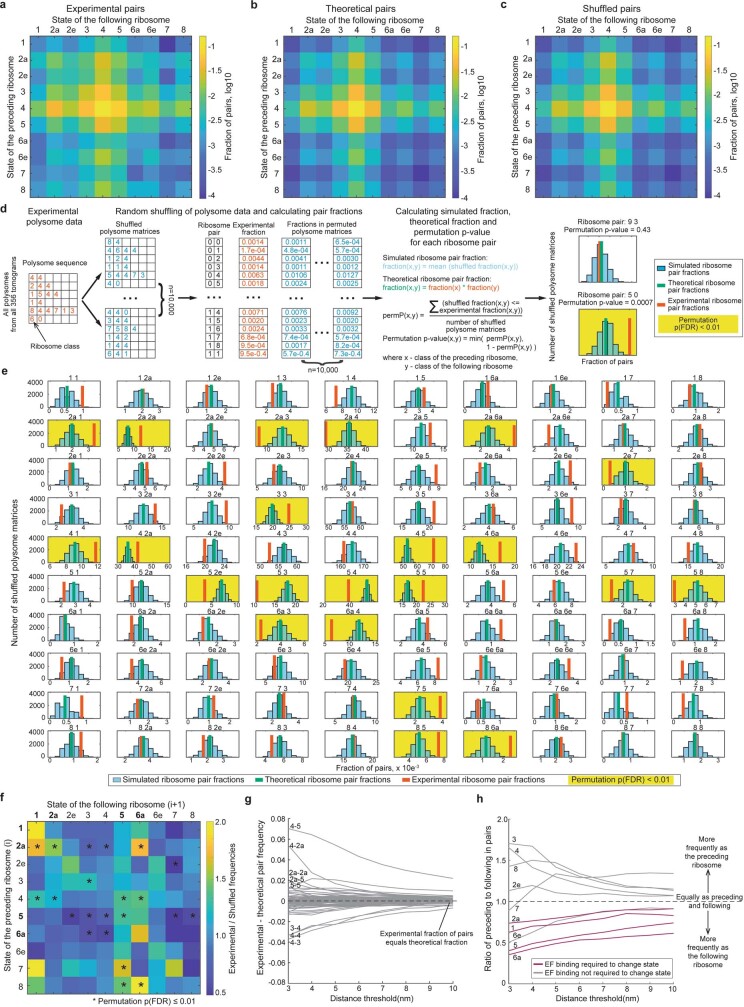
Translation is the fundamental process of protein synthesis and is catalysed by the ribosome in all living cells1. Here we use advances in cryo-electron tomography and sub-tomogram analysis2,3 to visualize the structural dynamics of translation inside the bacterium Mycoplasma pneumoniae. To interpret the functional states in detail, we first obtain a high-resolution in-cell average map of all translating ribosomes and build an atomic model for the M. pneumoniae ribosome that reveals distinct extensions of ribosomal proteins. Classification then resolves 13 ribosome states that differ in their conformation and composition. These recapitulate major states that were previously resolved in vitro, and reflect intermediates during active translation. On the basis of these states, we animate translation elongation inside native cells and show how antibiotics reshape the cellular translation landscapes. During translation elongation, ribosomes often assemble in defined three-dimensional arrangements to form polysomes4. By mapping the intracellular organization of translating ribosomes, we show that their association into polysomes involves a local coordination mechanism that is mediated by the ribosomal protein L9. We propose that an extended conformation of L9 within polysomes mitigates collisions to facilitate translation fidelity. Our work thus demonstrates the feasibility of visualizing molecular processes at atomic detail inside cells.


Conflict of interest statement

The authors declare no competing interests.

Figures

Fig. 1
Fig. 1. Ribosome structure in M.pneumoniae cells.
a, A denoised tomographic slice of a M.pneumoniae cell. AO, attachment organelle; PM, plasma membrane. Examples of ribosomes are circled. The representative tomogram (selected from 15) was acquired with a Volta phase plate for better visualization of the cellular morphology. Similar imaging conditions, excluding the use of a phase plate, were used for the acquisition of all tomograms for subsequent analysis. Scale bar, 100 nm. b, A 3.5-Å in-cell ribosome map (left) shows well-resolved rRNA bases and ribosomal protein side chains (right). c, An atomic model of the M.pneumoniae ribosome shows structural similarity to other bacterial ribosomes. Eleven ribosomal proteins (dark green) have sequence extensions (magenta).
Fig. 2
Fig. 2. Ribosome classification reconstructs the translation elongation cycle.
a, Ten 70S structures determined inside M.pneumoniae cells represent translation elongation intermediate states, which are characterized by the binding of different elongation factors (EFs) and tRNAs. The frequencies of occurrence for different intermediates are calculated from the classified particle numbers (Extended Data Fig. 4). b, Densities for mRNA, tRNAs and the nascent peptide chain are well-resolved in the most-populated 'A, P' state. c, Trajectories of the elongation factors EF-Tu and EF-G and the A-, P- and E-site tRNAs along translation elongation. d, Major conformational changes of the ribosome along the elongation trajectory: 30S body rotation, 30S head swivel and L1 stalk opening.
Fig. 3
Fig. 3. Antibiotics induce distinct translation elongation landscapes in cells.
a, Distribution of translation elongation intermediates in native untreated cells, and in cells treated with three different antibiotics. Bar and whiskers indicate mean and s.d. for each class across all cells in the different treatment groups: untreated (n = 356 cells); +Cm, chloramphenicol-treated (n = 65 cells); +Spc, spectinomycin-treated (n = 70 cells); and +PUM, pseudouridimycin-treated (n = 86 cells). b, Ribosomes in Spc-treated cells are largely stalled in the 'EF-G, A/PSpc, P/E' state. c, The Spc molecule (magenta) is well-resolved and built in the 'EF-G, A/PSpc, P/E' ribosome model. It is surrounded by several 16S rRNA bases and loop 2 of ribosomal protein S5 near the 30S neck. d, The major state in Spc-treated cells is similar to the 'EF-G, A/PPUM, P/E' class in PUM-treated cells (light blue) and the 'EF-G, A/P, P/E' class in untreated cells (light grey), differing only in the position of the A/P-site tRNA on the 50S side. e, Single-cell clustering analysis on the basis of the translation elongation states of 577 individual cells under native and different antibiotic treatment conditions.
Fig. 4
Fig. 4. Spatial and functional organization of ribosomes in native cells.
a, Three-dimensional map of ribosomes in a representative native untreated cell (selected from 356). Top, xy view; bottom, orthogonal view. The 70S intermediates within the translation elongation cycle (classes 1–8, as in Fig. 2a), and additional classes (classes 11–13 and 50–51 as detailed in Extended Data Fig. 4) are coloured as indicated in the colour scheme (inset). 50S: light grey. b, 'top-back' (t-b) and 'top-top' (t-t) assembly patterns of adjacent ribosomes in polysomes. c,d, Representative long polysomes of loose (c) and tight (d) topologies, with the corresponding putative mRNA paths and nascent chain vectors shown underneath (not drawn to scale). e, Distribution of polysome lengths. f, Distribution of elongation states in polysomes compared to all ribosomes and mono-ribosomes. Bars and whiskers are mean and s.d. across 356 tomograms of untreated cells (n = 356 cells). Highlighted are states for which the fraction in polysomes differs by more than 50% compared to all ribosomes or mono-ribosomes. Asterisks indicate false discovery rate (FDR)-adjusted P value (PFDR) < 0.01 (two-sided Wilcoxon rank sum test). PFDR values for class 5: 6.44 × 10−23 (polysome versus all) and 2.76 × 10−39 (polysome versus monosome); class 6a: 3.06 × 10−28 and 1.44 × 10−34, respectively. g, Occurrence frequencies of elongation state pairs of adjacent ribosomes in polysomes normalized to the theoretical probability of random pairs. States that require elongation factor binding to proceed are 1, 2a, 5 and 6a (in bold). h, Map of a di-ribosome within polysomes shows the intervening mRNA density (inset: blue arrowhead) and the extended L9 of the preceding ribosome (i). The C-terminal domain of extended L9 can interfere with elongation factor (EF) binding to the following ribosome (i+1).
Extended Data Fig. 1
Extended Data Fig. 1. M. pneumoniae in-cell ribosome maps.
a, 70S ribosome map determined from 77,539 sub-tomograms from 356 untreated M. pneumoniae cells. b, Map coloured by local resolutions. 50S has the highest local resolutions as it dominates the overall alignment. The relatively lower local resolutions of the 30S indicate their high flexibility during active translation. c, Fourier shell correlation (FSC) curves for global 70S and focused 30S refinement, and the reported resolution value at FSC = 0.143. The Nyquist limit for the data is 3.4 Å. d, 70S ribosome map determined from 18,987 sub-tomograms from 65 Cm-treated cells. e, Map coloured by local resolutions. f, FSC curves of the Cm-treated 70S ribosome, and of focused refinements on 30S and 50S respectively. g-h, Focused refined 30S and 50S maps from the Cm-treated dataset. i-j, The corresponding local-resolution maps. Atomic models for 30S and 50S were first built based on maps in g and h. k, Model-to-map FSC curves for 30S and 50S, respectively.
Extended Data Fig. 2
Extended Data Fig. 2. Structural features of the M. pneumoniae ribosome.
a,b, Examples of regions of the atomic model fitted into the density map for rRNAs (a) and proteins (b). c, Densities corresponding to ions are also observed. d, Extensions of ribosomal proteins S6, L22 and L29 form secondary structures (between arrowheads) that were clearly resolved in the map. e, The 70S model showing ribosomal proteins with sequence extensions (dark green). The extensions built in the model are highlighted in magenta. In addition to the helix-forming sequences of S6, L22 and L29, some loops can be traced, especially the long C-terminal loop of S6. f, Whole-cell cross-linking mass spectrometry data confirms the model built for the long loop extension of S6. g, The cross-linking network of S6 identified in the previous work, with the sequence range (1–167) resolved in the map coloured in green.
Extended Data Fig. 3
Extended Data Fig. 3. Ribosomal protein extensions.
a, Eleven ribosomal proteins in M. pneumoniae have sequence extensions compared to E. coli. Along the sequences, cross-links identified by in-cell cross-linking mass spectrometry, secondary structure prediction, disorder prediction, and sequence essentiality prediction based on a transposon mutation library are displayed (quantified in Supplementary Table 2). b, Extensions in the eleven ribosomal proteins are found throughout bacteria, but are not specific to any sub-groups.
Extended Data Fig. 4
Extended Data Fig. 4. Classification and refinement of ribosomes in native untreated cells.
a, A diagram of the image-processing workflow. The classification process can be grouped into three tiers: global classification, focused classification on the tRNA path region (mask I), and focused classification on elongation factor and A/T tRNA binding region (mask II). For each class, a unique number identifier and class name are assigned for tracking. The particle number and the global map resolution at FSC = 0.143 are provided for each class. b-d, FSC curves for all refined maps.
Extended Data Fig. 5
Extended Data Fig. 5. Validation of ribosome detection and classification.
a, Mask I for focused classification on tRNA path region. b, A representative RELION classification job with mask I. Each line indicates the change in particle numbers in one class over 25 iterations. Classes that show the same structure were grouped according to the tRNA occupancy ('a, P/E', 'P, E', 'P', 'A, P'). 'a, P/E' contains heterogeneous density around the A site. c, Results of the classification job as shown in b, and of three additional parallel jobs. d, Results of following classification jobs that further classify the 'a, P/E' class into 'A*, P/E' and 'A/P, P/E'. e, Mask II for focused classification on elongation factor (EF) and A/T tRNA sites. f, Changes in particle numbers over iterations in a representative classification job with the mask II. g, Results of parallel focused classification jobs with mask II. h, Distribution of the ribosome classes against template matching cross-correlation scores used for ribosome localization. For each of the 356 tomograms of untreated cells, the 400 highest scoring hits were extracted and ranked. Obvious false positives were manually excluded first. Additional false positives were identified during RELION classification. 70S classes that are structurally similar were grouped in the plot for better visualization. i, Same as h, but only showing the 70S classes in the elongation phase. The proportions of different 70S classes remain stable across the top 400 hits, demonstrating that the classification results are not biased by the ribosome picking.
Extended Data Fig. 6
Extended Data Fig. 6. Local-resolution maps for ribosome classes in untreated cells.
Maps of the 15 classes determined in the dataset of untreated cells (Extended Data Fig. 4), coloured by local resolution calculated in RELION.
Extended Data Fig. 7
Extended Data Fig. 7. Model building for ribosome classes in untreated cells.
a-j, Models of the ten ribosome classes in the elongation phase constructed by flexible fitting. k, The model for the ribosome with hybrid P/E-site tRNA. l, Free 50S in complex with ribosome recycling factor (RRF).
Extended Data Fig. 8
Extended Data Fig. 8. Early-to-late translocation intermediates during elongation.
a, Early translocation intermediates prior to EF-G binding. Only tRNAs in the aligned class models are displayed. b, Early-to-late translocation intermediates in the presence of EF-G. Continuous structural changes are observed from class 6e to 7 to 8, including a roughly 20 Å movement of EF-G’s domain IV toward the A site (black arrow), an overall rotation of the entire EF-G (orange arrows) and inter-domain conformational changes. c-e, Densities and models for EF-G and tRNAs in classes 6e, 7 and 8. In class 6e, EF-G’s domain IV is less resolved in the map (red circle). It may contain a mixture of intermediate states with domain IV moving toward the A site. The fitted model represents the average position. Further classification could not address the high flexibility. f, From class 6e to 7, EF-G undergoes a small overall rotation (orange arrows) and an inter-domain rearrangement. Inset (rotated view, aligned on EF-G domains I-III) shows rotation of domain IV relative to other domains. Movement of EF-G’s domain IV towards the A site results from both overall rotation on the ribosome and inter-domain rearrangement. g, From class 7 to 8, EF-G rotates as one body without significant inter-domain rearrangement (inset, rotated view, aligned on EF-G domains I-III). h, Class 6e shows structural similarity to a reported early translocation state 'H1-EF-G–GDP-pi' (PDB 7PJV) determined by Petrychenko et al. 2021. i, Class 7 resembles 'PRE–EF-G–GDP–Pi' (PDB 7SSL) reported by Carbone et al. 2021, and 'INT1' (PDB 7N2V, not shown) by Rundlet et al. 2021. j, Class 8 resembles the late translocation intermediates reported by Rundlet et al. 2021 ('INT2', PDB 7N2C) and Petrychenko et al. 2021 ('CHI1-EF-G-GDP', PDB 7PJY). k-m, Minor inter-domain conformational difference found between EF-Gs in our models and those in the reported in vitro structures.
Extended Data Fig. 9
Extended Data Fig. 9. Classification, refinement and modelling of ribosomes in Cm-treated cells.
a, Image-processing workflow for the Cm-treated dataset. The sub-tomogram classification and refinement are similar to those developed for the untreated dataset (Extended Data Fig. 4a). Heterogeneity may exist in the minor classes (2a, 3, 5), but the low particle numbers hindered further classification. b, FSC curves for all classes calculated following RELION refinements. c, Local-resolution maps. d, Density of the Cm molecule is resolved in the major 'A, P' class, but not in the other three minor classes owing to relatively low resolutions of these maps. e, Models built for the four classes, fitted into their corresponding densities. f, Elongation factors and tRNAs in the four classes. g, In the predominant 'A, P' class, mRNA, A- and P-site tRNA, the nascent peptide chain, and the Cm drug are well-resolved. The nascent chain has strong continuous density linked to the P-site tRNA, resulting from the inhibition of peptidyl transfer by the Cm molecule.
Extended Data Fig. 10
Extended Data Fig. 10. Classification, refinement and modelling of ribosomes in Spc-treated cells.
a, Image-processing workflow for the Spc-treated dataset. The sub-tomogram classification and refinement are similar to those developed for the untreated dataset (Extended Data Fig. 4a), except for exclusion of the manual inspection step after template matching. b, FSC curves for all classes calculated following refinements. c, Local-resolution maps for Spc-treated 70S classes. d, Density corresponding to the Spc molecule (magenta) is clearly resolved in the major 'EF-G, A/PSpc, P/E' class. Densities from the untreated and PUM-treated data, where Spc is not present, are shown for comparison. e, Models built for the five Spc-treated 70S classes. f, Elongation factors and tRNAs in the five classes. g, The model of 'EF-G, A/PSpc, P/E' shows Spc binds to the 30S neck region, confirming its role in inhibiting 30S head dynamics and mRNA translocation.
Extended Data Fig. 11
Extended Data Fig. 11. Classification, refinement and modelling of ribosomes in PUM-treated cells.
a, Image-processing workflow for the PUM-treated dataset. The sub-tomogram classification and refinement are similar to those developed for the untreated dataset (Extended Data Fig. 4a). b, Distribution of translation states for ribosomes collided with a PUM-stalled RNA polymerase (purple; stalled expressome) and for the remaining ribosomes (green) in the PUM-treated cells. c, FSC curves for all classes calculated after refinements. d-f, Local-resolution maps. g, Models built for PUM-treated 70S classes. h, Elongation factors and tRNAs in the six 70S ribosome classes.
Extended Data Fig. 12
Extended Data Fig. 12. Spatial analysis of ribosomes and polysomes in native untreated cells.
a, 70S ribosomes (grey) and detected polysomes (light blue) in a representative tomogram. b, Distribution of neighbouring ribosomes within a 50 nm centre-to-centre distance. Rotation normalized. c, Illustration of the polysome detection approach based on the distance from the mRNA exit site of one ribosome to the mRNA entry site of the next. d, Histogram of distances from the mRNA exit site of one ribosome to the mRNA entry sites of all neighbouring ribosomes. e, Percentages of ribosomes detected as polysomes using different distance thresholds (d). Mean and s.d. are across 356 tomograms (n = 356 cells). A 7 nm threshold was selected. f, In polysomes, the following ribosome (i) adopts various orientations relative to the preceding ribosome (i+1), mainly with regard to rotation around a plane perpendicular to the preceding ribosome’s mRNA exit site. g, Rotations of the following ribosome relative to the preceding ribosome in polysomes. The two clusters correspond to the previously defined 't-t' and 't-b' configurations. h-i, Positions of the following ribosomes (coloured according to different rotations) relative to the preceding ribosome (triangle indicates the mRNA exit site). j-k, Two representative di-ribosome pairs in polysomes with extended L9. l-m, Clash between the C-terminal domain of the extended L9 and the superposed EF-G and EF-Tu, respectively. n, De novo focused classification on the L9 region using a spherical mask (light green) of 70S ribosomes resulted in three classes: no L9 resolved (I), flat L9 (II) and extended L9 (III). The additional density connecting to the extended L9 originates from the neighbouring ribosome. o, Overlap between polysomes independently defined based on spatial analysis, RELION classification for polysomes and classified ribosomes with the extended L9. p, The extended L9 is more frequent in the 't-t' ribosome pairs, especially in compacted ones.
Extended Data Fig. 13
Extended Data Fig. 13. Correlation of translation elongation states within polysomes in native untreated cells.
a, Occurrence frequencies of elongation state pairs of two adjacent ribosomes (preceding ribosome i versus following ribosome i+1) within polysomes calculated from the experimental data. b, Theoretical frequencies of elongation state pairs if there is no cross-influence within the polysome and ribosome state pairs form randomly. c, Frequencies of elongation state pairs calculated after random shuffling of the experimental data. d, Schematic representation of polysome shuffling analysis and permutation p-value calculation. Detailed procedure can be found in the Materials and Methods. e, Comparison of the experimental and shuffled pair fractions for all major pairs. f, Fold changes between the experimental and shuffled pair fractions from the shuffling experiments. Ribosomes of states that need elongation factor binding to proceed (states 1 and 2a for EF-Tu, and states 5 and 6a for EF-G) are more frequently engaged as the following ribosomes. Permutation p-values were adjusted for multiple hypotheses testing with the Benjamini–Hochberg procedure, and are provided in Supplementary Table 7. g, Difference between experimental and theoretical pair frequencies when using different distance thresholds for polysome definition. h, Ratios of the number of ribosomes in each state being the preceding one against the following one in polysome pairs (across all polysomes), calculated using different distance thresholds to define polysomes. Symmetric engagement as the preceding and following ribosome results in a ratio of 1.

References

    1. Voorhees RM, Ramakrishnan V. Structural basis of the translational elongation cycle. Annu. Rev. Biochem. 2013;82:203–236. - PubMed
    1. O'Reilly FJ, et al. In-cell architecture of an actively transcribing–translating expressome. Science. 2020;369:554–557. - PMC - PubMed
    1. Tegunov D, Xue L, Dienemann C, Cramer P, Mahamid J. Multi-particle cryo-EM refinement with M visualizes ribosome–antibiotic complex at 3.5 Å in cells. Nat. Methods. 2021;18:186–193. - PMC - PubMed
    1. Brandt F, et al. The native 3D organization of bacterial polysomes. Cell. 2009;136:261–271. - PubMed
    1. Rodnina MV. Translation in prokaryotes. Cold Spring Harb. Perspect. Biol. 2018;10:a032664. - PMC - PubMed

Publication types

MeSH terms