. 2022 Nov;611(7934):148-154.
doi: 10.1038/s41586-022-05272-1. Epub 2022 Sep 28.

LRRC15+ myofibroblasts dictate the stromal setpoint to suppress tumour immunity

Affiliations

LRRC15+ myofibroblasts dictate the stromal setpoint to suppress tumour immunity

Akshay T Krishnamurty et al. Nature. 2022 Nov.

Abstract

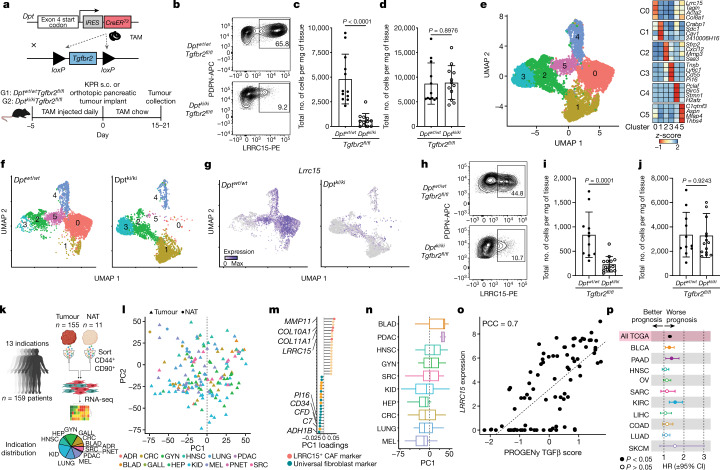
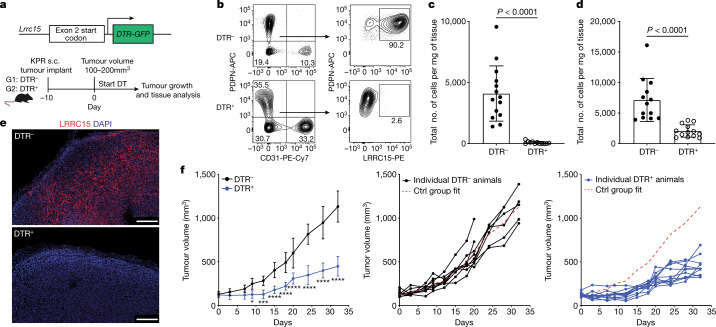
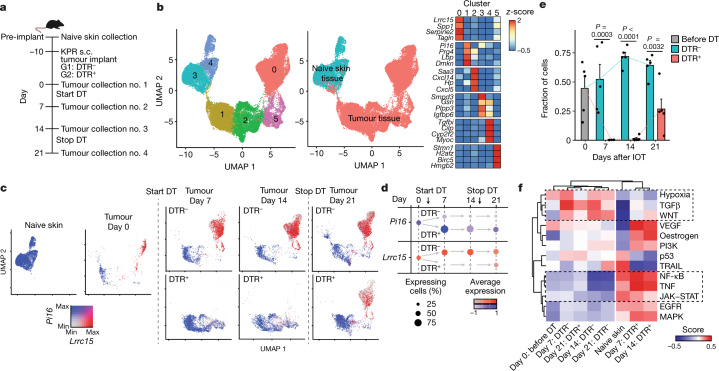
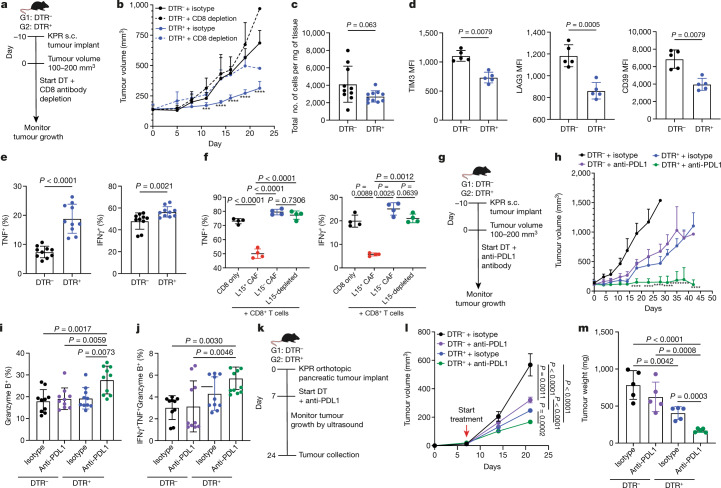
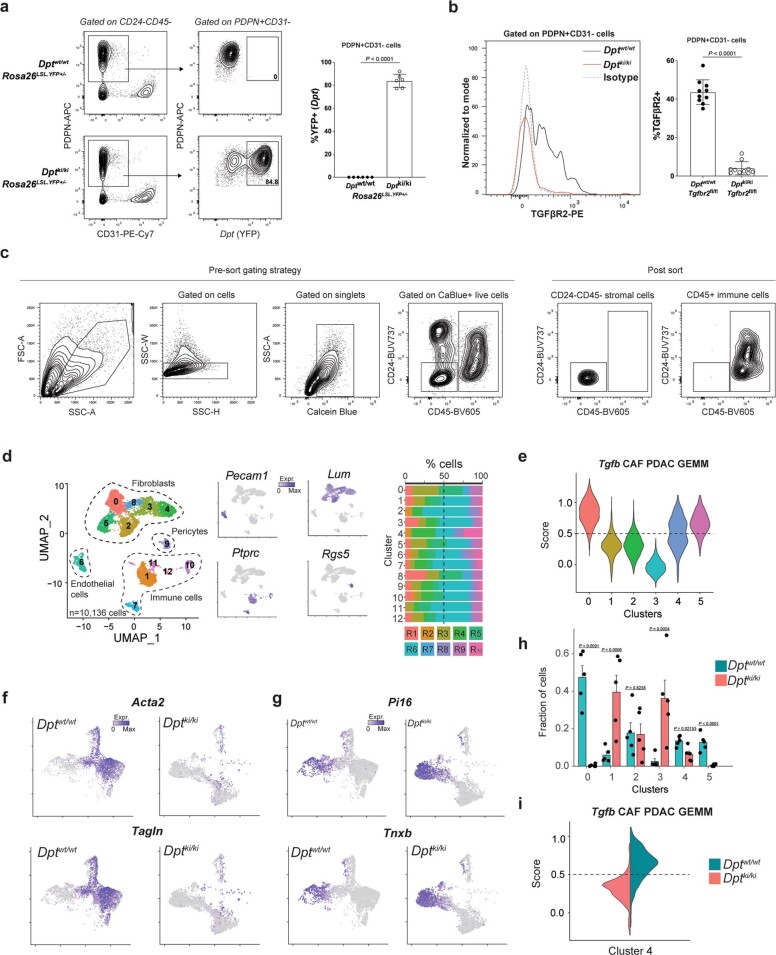
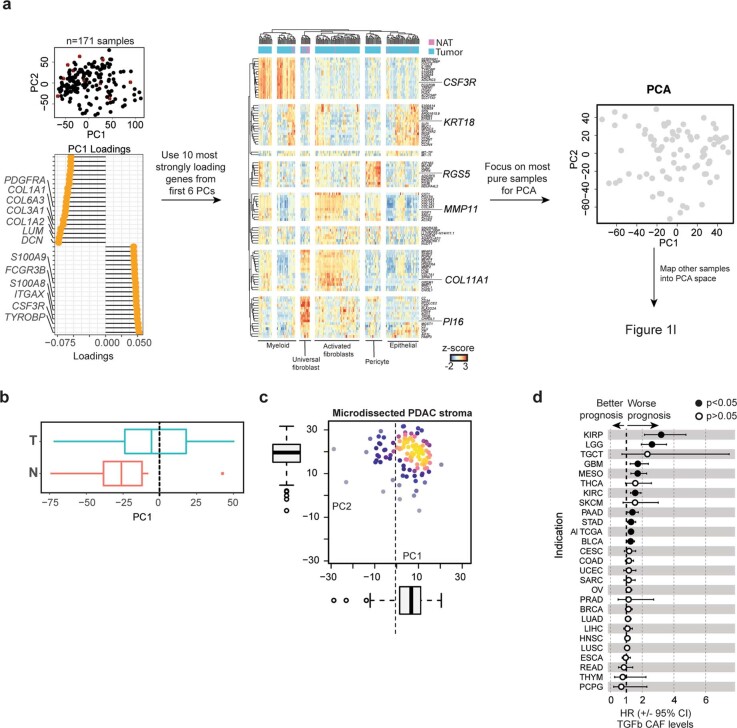
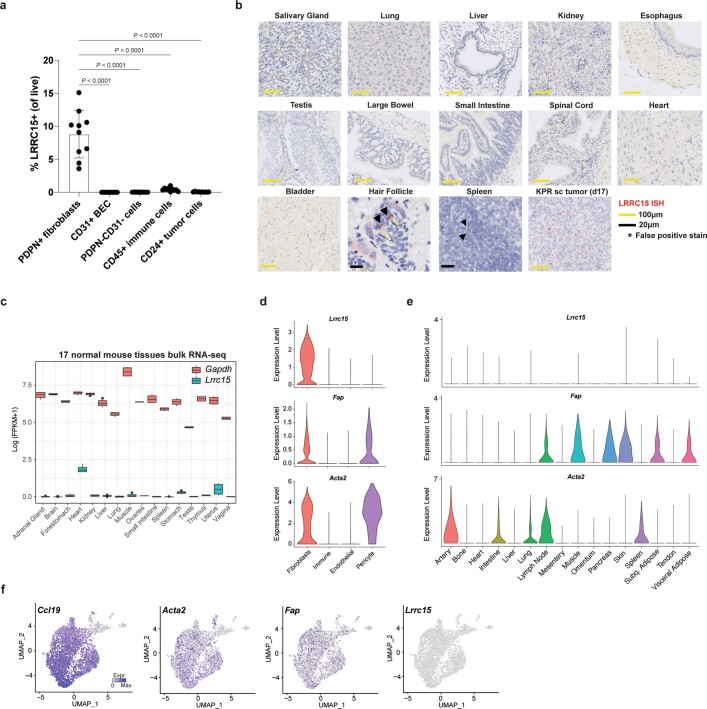
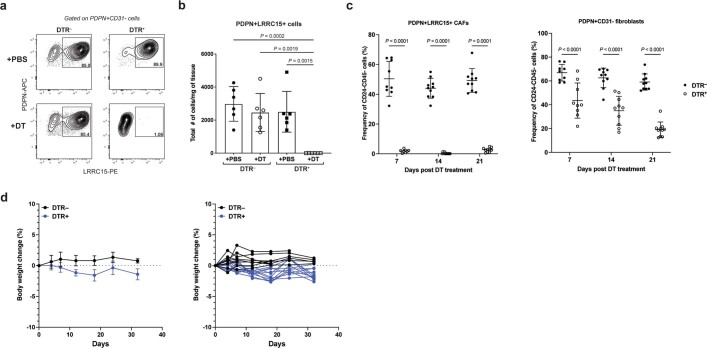
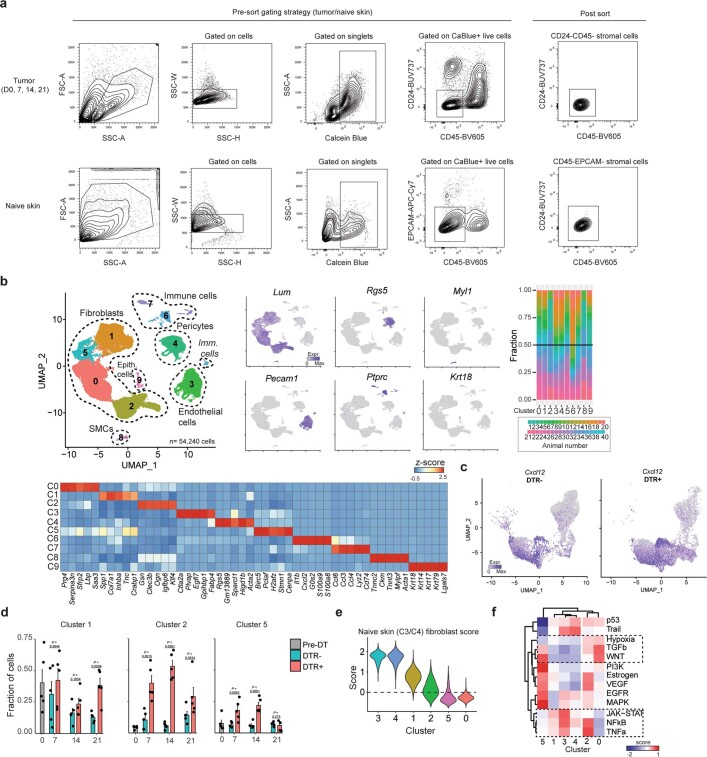
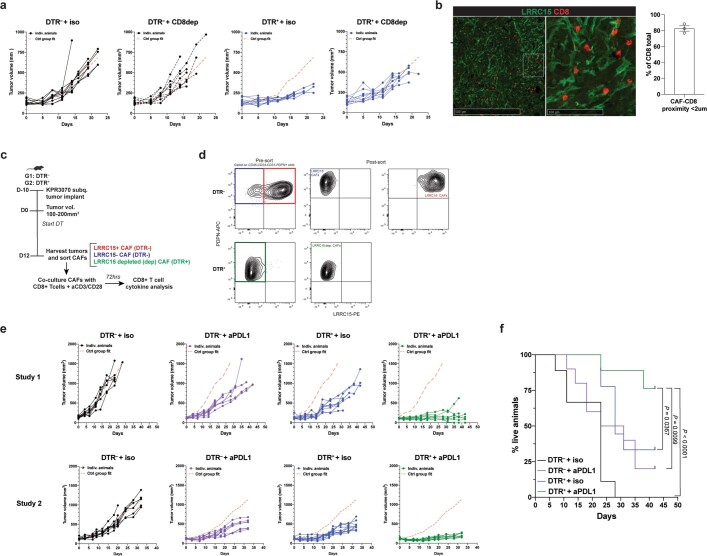
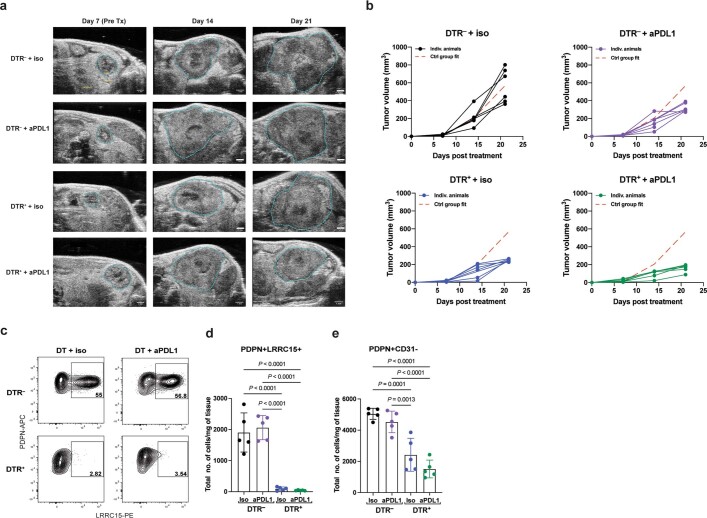
Recent single-cell studies of cancer in both mice and humans have identified the emergence of a myofibroblast population specifically marked by the highly restricted leucine-rich-repeat-containing protein 15 (LRRC15)1-3. However, the molecular signals that underlie the development of LRRC15+ cancer-associated fibroblasts (CAFs) and their direct impact on anti-tumour immunity are uncharacterized. Here in mouse models of pancreatic cancer, we provide in vivo genetic evidence that TGFβ receptor type 2 signalling in healthy dermatopontin+ universal fibroblasts is essential for the development of cancer-associated LRRC15+ myofibroblasts. This axis also predominantly drives fibroblast lineage diversity in human cancers. Using newly developed Lrrc15-diphtheria toxin receptor knock-in mice to selectively deplete LRRC15+ CAFs, we show that depletion of this population markedly reduces the total tumour fibroblast content. Moreover, the CAF composition is recalibrated towards universal fibroblasts. This relieves direct suppression of tumour-infiltrating CD8+ T cells to enhance their effector function and augments tumour regression in response to anti-PDL1 immune checkpoint blockade. Collectively, these findings demonstrate that TGFβ-dependent LRRC15+ CAFs dictate the tumour-fibroblast setpoint to promote tumour growth. These cells also directly suppress CD8+ T cell function and limit responsiveness to checkpoint blockade. Development of treatments that restore the homeostatic fibroblast setpoint by reducing the population of pro-disease LRRC15+ myofibroblasts may improve patient survival and response to immunotherapy.


Conflict of interest statement

All authors are employees of Genentech Inc., a member of the Roche group.

Figures

Fig. 1
Fig. 1. TGFβR2 signalling in DPT+ universal fibroblasts drives LRRC15+ myofibroblast differentiation.
a, Schematic of the genetic (top) and experimental (bottom) approach for the generation of DptIresCreERT2Tgfbr2fl/fl mice. s.c., subcutaneous. bg, Data are from subcutaneous KPR tumours 21 days after implantation in Dptwt/wtTgfbr2fl/fl and Dptki/kiTgfbr2fl/fl mice. b, Representative flow cytometry plots showing the frequency of PDPN+LRRC15+ cells. Cells were gated on PDPN+CD31 cells. c,d, Quantification of the total number of PDPN+LRRC15+ cells (c) and PDPN+CD31 cells (d) normalized by tumour weight (n = 12 mice). e, Uniform manifold approximation and projection (UMAP) plot of 6,525 single fibroblasts coloured by cluster membership (left, n = 5 mice per group) and the relative average expression of indicated marker genes in clusters (C0–C5) from the UMAP (right). f, UMAP as in e split by genotype. g, UMAP as in e split by genotype and coloured by expression of Lrrc15. hj, Data are from orthotopic pancreatic KPR tumours 15 days after implantation in Dptwt/wtTgfbr2fl/fl or Dptki/kiTgfbr2fl/fl mice h, Representative flow cytometry plots showing the frequency of PDPN+LRRC15+ cells. Cells were gated on PDPN+CD31 cells. i,j, Quantification of the total number of PDPN+LRRC15+ cells (i) and PDPN+CD31 cells (j) normalized by tumour weight (n = 11 or 14 mice). k, Scheme of collection of the human samples. NAT, normal adjacent tissue; BLAD, bladder urothelial carcinoma; GYN, gynaecologic tumours; PDAC, pancreatic ductal adenocarcinoma; HNSC, head and neck squamous cell carcinoma; SRC, sarcoma; KID, kidney cancer; HEP, liver hepatocellular carcinoma; CRC, colorectal cancer; LUNG, lung cancer; MEL, melanoma; ADR, adrenal cancer; PNET, pancreatic neuroendocrine tumour; GALL, gallbladder cancer. l, PCA of stromal cell samples. Shapes indicate the sample origin; colours represent the cancer indication. m, Gene loadings for PC1 from l. n, Distribution of samples from specified indications across PC1 from l. o, Pearson’s correlation coefficient (PCC) between LRRC15 expression and TGFβ pathway activity across samples (filled circles). Linear regression line (dashed line). p, Forest plot depicting TGFβ CAF overall survival hazard ratios (HRs) across specified TCGA indications. Data in c, d, i and j are the mean ± s.d. Data in c, d, i and j are pooled from two or three independent experiments. For n, whiskers represent the minimum and maximum, the box represents the interquartile range, and the centre line represents the median. For p, the centre point shows the HR, lines represent 95% confidence interval (CI). Statistics were calculated using two-tailed, unpaired Student’s t-test (c,d,i,j) or Cox proportional hazards regression model (p). Source data
Fig. 2
Fig. 2. Targeted depletion of LRRC15+ CAFs significantly reduces tumour growth.
a, Schematic of the genetic (top) and experimental (bottom) approach for Lrrc15DTRGFP mice. be, Data are from subcutaneous KPR tumours 8 days after DT treatment in DTR and DTR+ mice. b, Representative flow cytometry plots showing the frequency of PDPN+LRRC15+ cells. Cells were gated on CD24CD45 cells (left) or PDPN+CD31 cells (right). c,d, Quantification of the total number of PDPN+LRRC15+ cells (c) and PDPN+CD31 cells (d) normalized by tumour weight (n = 12 or 14 mice). e, Representative immunofluorescence images of LRRC15 and DAPI. Scale bar, 250 µm. f, Tumour growth curves from DTR and DTR+ mice treated with DT (n = 9 or 11 mice per group). Left: average tumour volume across all animals (*P = 0.015, ***P = 0.0006, ****P < 0.0001). Middle and right: individual animal growth curves per genotype. The x axis represents days after DT treatment. The dashed red line represents the average reference fit for the control (Ctrl) group. Data in c and d are pooled from four independent experiments. Data in e and f are representative of two or three independent experiments. Data in c, d and f are the mean ± s.d. Statistics were calculated using two-tailed, unpaired Student’s t-test (c and d) or ordinary two-way analysis of variance (f). Source data
Fig. 3
Fig. 3. Normal tissue universal fibroblast-like activity is enriched following LRRC15+ CAF depletion.
a, Experimental scheme (n = 5 mice per timepoint and group). b, UMAP plot of 37,383 single fibroblasts coloured by cluster membership (left) or coloured by tissue of origin (middle). Relative average expression of indicated marker genes across clusters from left UMAP (right). c, UMAP as in b, coloured by expression of Pi16 and Lrrc15 and split by time point and condition. d, Dot plot visualizing the percentage of positive fibroblasts (dot size) and the relative average expression (colour) for Lrrc15 and Pi16 at each time point and condition in tumour-bearing samples. e, Fraction of cells in cluster 0 of each treatment group (n = 5 mice per group) at all four time points in tumour-bearing samples. f, PROGENy pathway enrichment scores (colour) for cells pooled for each of the indicated time points and conditions (bottom row). Data in e are the mean + s.e.m., and statistics were calculated using two-tailed, unpaired Student’s t-test. Source data
Fig. 4
Fig. 4. LRRC15+ CAF depletion enhances CD8+ T cell effector function and responsiveness to anti-PDL1 treatment.
a,b, Data are from DTR and DTR+ mice bearing subcutaneous KPR tumours treated with DT and a CD8-depleting antibody. a, Experimental scheme. b, Average tumour growth curves (n = 10 mice per group; *** P = 0.0002, **** P < 0.0001). ce, Subcutaneous KPR tumour analysis on day 12 after DT treatment in DTR and DTR+ mice. c, Quantification of CD8+ T cells normalized by tumour weight (n = 10 mice). d, Quantification of mean fluorescence intensity (MFI) of TIM3, LAG3 and CD39 on CD8+PD1+ T cells (n = 5 mice). e, Quantification of the frequency of TNF+ and IFNγ+ CD8+ T cells (n = 10 mice). f, Quantification of the frequency of TNF+ and IFNγ+ of anti-CD3 and anti-CD28-activated CD8+ T cells after 72 h of culture alone or with sorted CAFs (L15, LRRC15; n = 4 samples). gj, Data are from DTR and DTR+ mice bearing subcutaneous KPR tumours treated with DT and an anti-PDL1 antibody. g, Experimental scheme. h, Average tumour growth curves (n = 9 or 10 mice per group; ****P < 0.0001). i,j, Subcutaneous KPR tumour analysis 12 days after treatment showing quantification of frequency of granzyme B+ CD8+ T cells (n = 10 mice) (i) and TNF+IFNγ+granzyme B+ CD8+ T cells (n = 10 mice) (j). km, Data are from DTR and DTR+ mice bearing orthotopic pancreatic KPR tumours treated with DT and an anti-PDL1 antibody k, Experimental scheme. l, Average tumour growth curves (n = 7 mice per group). The x axis represents days after implantation. m, Tumour weight on day 24 after implantation (n = 5 mice). Data in bf, hj, l and m are the mean ± s.d. Data in b, h, d and f are representative of two independent experiments and l and m are representative of one independent experiment. Data in c, e, I and j are pooled from two independent experiments. Statistics were calculated using ordinary one-way analysis of variance test (b,f,hj,l,m) or two-tailed, unpaired Student’s t-test (c,d,e). Significance values mark the DTR+ + isotype group in b and the DTR+ + anti-PDL1 group in h relative to the other three groups. Source data
Extended Data Fig. 1
Extended Data Fig. 1. TGFβR2 staining on CAFs and scRNAseq from DptIresCreERT2Tgfbr2fl/fl mice.
a. From subcutaneous KPR tumours 21 days post implantation in Dptwt/wtRosa26LSLYFP+/- and Dptki/kiRosa26LSLYFP+/- mice showing representative flow cytometry plots (left) and quantification of frequency (right) of Dpt-YFP+ cells in PDPN+CD31 fibroblasts (n = 6 mice). b-i. From subcutaneous KPR tumours 21 days post implantation in Dptwt/wtTgfbr2fl/fl and Dptki/kiTgfbr2fl/fl mice after experimental regimen from Fig. 1a showing b. Representative flow cytometry histogram (left) and quantification of frequency (right) of TGFβR2+ cells in PDPN+CD31 fibroblasts (n = 10 mice). c. Representative pre-sort gating strategy (left) and post sort purity analysis (right) of CD24-CD45- stromal cells and CD45+ immune cells d. UMAP plot of 10,136 stroma and immune cells colored by cluster membership (left), marker gene expression (middle), and frequency of individual cell hashed samples in clusters from UMAP (n = 5 mice per group). e. Violin plots showing the score for a Tgfb CAF PDAC GEMM gene signature for cells in each cluster from Fig. 1e. f,g. UMAPs as in Fig. 1f, colored by expression of indicated markers. h. Fraction of cells in each cluster from each condition from Fig. 1e (n = 5 animals per condition). i. Scores for the same geneset as in e, here for cells in the proliferating cluster (C4) from Fig. 1e and split by condition. Data in a,b are pooled from two or three independent experiments. Data in a,b are mean +/− s.d. and in h are mean + s.e.m. Statistics in a,b,h were calculated using a two-tailed, unpaired Student’s t-test. Source data
Extended Data Fig. 2
Extended Data Fig. 2. Stromal cell transcriptional analysis across human cancers.
a. Strategy for the analysis of sorted CAF populations from human tumours: Left: PCA was performed on all samples and the 20 most strongly positive and negative loading genes from each PC were extracted. Middle: Hierarchical clustering was performed, and samples without any contamination were isolated. Right: PCA was performed on these pure samples. Samples with some contaminations were projected into this PCA space obtained from pure samples to derive Fig. 1l. b. Distribution of normal adjacent (N) and tumour (T) tissues along PC1 from Fig. 1l. c. Projection of 123 microdissected PDAC RNA-seq samples into the PCA space obtained in Fig. 1b. d. Same forest plot as in Fig.  1p, here for all cancer indications in TCGA. In data in b,c, whiskers represent the minimum and maximum, the box represents IQR, and the center line represents the median. In data in d, the center point shows the hazard ratio and the lines represent the 95% confidence interval. Statistics were calculated using a Cox Proportional-Hazards Regression Model in d. Source data
Extended Data Fig. 3
Extended Data Fig. 3. LRRC15 expression is restricted to tumour-associated fibroblasts.
a. Quantification of frequency of LRRC15+ cells in subcutaneous KPR tumours 17 days post implantation in PDPN+ fibroblasts, CD31+ blood endothelial cells (BEC), PDPNCD31 stromal cells, CD45+ immune cells, and CD24+ tumour cells (n = 10 mice). b. Representative LRRC15 in situ hybridization images of select healthy murine tissues and subcutaneous KPR tumour tissue 17 days post implantation. c. Bulk RNAseq data of 17 normal mouse tissues showing Lrrc15 and Gapdh (control) expression. Number of samples per tissue are in the source data. d-f. Fap, Acta2, and Lrrc15 gene expression from d. scRNAseq analysis of fibroblasts, immune cells, endothelial cells, and pericytes from KPR tumours 21 days post implantation in Dptwt/wtTgfbr2fl/fl mice. e. scRNAseq of Pdgfrα+ steady state fibroblasts across murine tissues. f. scRNAseq of fibroblasts and pericytes from murine naive skin-draining lymph nodes along with Ccl19 expression. Data in a are pooled from three independent experiments. Data in b are representative of one independent experiment. Data in a are mean +/− s.d. In data in c, whiskers represent the minimum and maximum, the box represents IQR, and the center line represents the median. Statistics in a were calculated using an ordinary one-way ANOVA test. Source data
Extended Data Fig. 4
Extended Data Fig. 4. Selective depletion of LRRC15+ CAFs is achieved in Lrrc15DTR mice.
a,b. From subcutaneous KPR tumours 8 days post PBS or DT treatment in DTR and DTR+ mice. a. Representative flow cytometry plots showing frequency of LRRC15+ cells in PDPN+CD31 fibroblasts and b. Quantification of total number of PDPN+LRRC15+ cells normalized by tumour weight (n = 6 mice) c. Quantification of frequency of PDPN+LRRC15+ cells (left) and PDPN+CD31 fibroblasts (right) on days 7 (n = 8 or 9 mice), 14 (n = 10 mice), and 21 (n = 10 mice) post DT treatment in subcutaneous KPR tumour bearing DTR and DTR+ mice. d. Body weight change curves from DTR and DTR+ mice treated with DT (n = 9 or 11 mice/group). Average body weight change across all animals (left); Individual body weight change curves per genotype (right). X-axis represents days post DT treatment. Data in b,c are pooled from two or three independent experiments. Data in d are representative of three independent experiments. Data in b,c,d are mean +/− s.d. Statistics were calculated using an Ordinary one-way ANOVA test in b and an Ordinary two-way ANOVA in c. Source data
Extended Data Fig. 5
Extended Data Fig. 5. Kinetic scRNAseq of naïve skin fibroblasts and tumour-associated fibroblasts following LRRC15+ CAF ablation.
a. Representative pre-sort gating strategy (left) and post sort purity analysis (right) of stromal cells from subcutaneous KPR tumour tissue (top) or naive skin tissue (bottom). b. UMAP plot of 54,240 stromal cells colored by cluster membership (left). UMAP as on the left, here colored by indicated marker gene expression (middle) and frequency of individual cell hashed samples in clusters from UMAP (right). Relative average expression of top 5 marker genes in each cluster (bottom). c. UMAP (D0,7,14,21; left, D7,14,21; right) as in 3b split colored by expression of Cxcl12. d. Fraction of cells in C1, C2, and C5 from Fig. 3b in each condition (n = 5 animals/condition) at all four time points in tumour bearing samples. e. Violin plots showing the score for a naive skin C3/C4 gene signature for cells from each cluster in Fig. 3b. f. PROGENY pathway enrichment scores (color) for cells pooled for each cluster in Fig. 3b. Data in d are mean + s.e.m. Statistics in d were calculated using a two-tailed, unpaired Student’s t-test. Source data
Extended Data Fig. 6
Extended Data Fig. 6. Tumour growth curves in LRRC15+ CAF depleted tumours combined with CD8+ T cell depletion or anti-PDL1 treatment and CAF sorting strategy.
a. Individual tumour growth curves from DT-treated subcutaneous KPR tumour bearing DTR and DTR+ mice in combination with CD8 depleting antibody or isotype control (n = 10 mice/group). Dashed red line represents the average reference fit from the control group (DTR + isotype). b. Immunofluorescence analysis of subcutaneous KPR tumours stained for LRRC15 and CD8 (left) and quantification of frequency of CD8+ T cells in a proximity of less than 2um from an LRRC15+ CAF. c,d. Experimental scheme (c) and sorting strategy (d) for CAF-CD8+ T cell co-culture experiment for results in 4f. e,f. From DT-treated subcutaneous KPR tumour bearing DTR and DTR+ mice in combination with aPDL1 antibody or isotype control e. Two independent studies showing individual tumour growth curves (Study 1: n = 9 or 10 mice/group; Study 2: n = 9 or 11 mice/group). Dashed red line represents the average reference fit from the control group (DTR + isotype). f. Survival analysis of time to progression to tumour volumes reaching 1000m3 or tumour ulceration bigger than 5mm (n = 9 or 10 mice/group). Data in b are mean +/− s.e.m. Data in a,f are representative of two independent experiments. Statistics in f were calculated using a Log-rank Mantel-Cox test. Source data
Extended Data Fig. 7
Extended Data Fig. 7. Tumour growth curves and CAF analysis in LRRC15+ CAF depleted orthotopic pancreatic KPR tumours combined with anti-PDL1 treatment.
a–e. From DT-treated orthotopic pancreatic KPR tumour bearing DTR and DTR+ mice in combination with aPDL1 antibody or isotype control a. Representative ultrasound images of pancreatic KPR tumours across all treatment groups and timepoints. Hashed blue line marks circumference of tumour. b. Individual tumour growth curves (n = 7 mice/group). Dashed red line represents the average reference fit from the control group (DTR + isotype). c. Representative flow cytometry plots showing frequency of LRRC15+ cells in PDPN+CD31 fibroblasts d,e. Quantification of total number of PDPN+LRRC15+ cells (d) and PDPN+CD31+ cells (e) normalized by tumour weight (n = 5 mice). Data in d,e are mean +/− s.d. Data in a-e are representative of one independent experiment. Statistics in d,e were calculated using an ordinary one-way ANOVA test. Source data

Comment in

References

    1. Dominguez CX, et al. Single-cell RNA sequencing reveals stromal evolution into LRRC15+ myofibroblasts as a determinant of patient response to cancer immunotherapy. Cancer Discov. 2020;10:232–253. doi: 10.1158/2159-8290.CD-19-0644. - DOI - PubMed
    1. Kieffer Y, et al. Single-cell analysis reveals fibroblast clusters linked to immunotherapy resistance in cancer. Cancer Discov. 2020;10:1330–1351. doi: 10.1158/2159-8290.CD-19-1384. - DOI - PubMed
    1. Bartoschek M, et al. Spatially and functionally distinct subclasses of breast cancer-associated fibroblasts revealed by single cell RNA sequencing. Nat. Commun. 2018;9:5150. doi: 10.1038/s41467-018-07582-3. - DOI - PMC - PubMed
    1. Sahai E, et al. A framework for advancing our understanding of cancer-associated fibroblasts. Nat. Rev. Cancer. 2020;20:174–186. doi: 10.1038/s41568-019-0238-1. - DOI - PMC - PubMed
    1. Biffi G, Tuveson DA. Diversity and Biology of cancer-associated fibroblasts. Physiol. Rev. 2021;101:147–176. doi: 10.1152/physrev.00048.2019. - DOI - PMC - PubMed

Publication types

Substances