. 2022 Oct;610(7930):173-181.
doi: 10.1038/s41586-022-05257-0. Epub 2022 Sep 28.

PD-1 combination therapy with IL-2 modifies CD8+ T cell exhaustion program

Affiliations

PD-1 combination therapy with IL-2 modifies CD8+ T cell exhaustion program

Masao Hashimoto et al. Nature. 2022 Oct.

Abstract

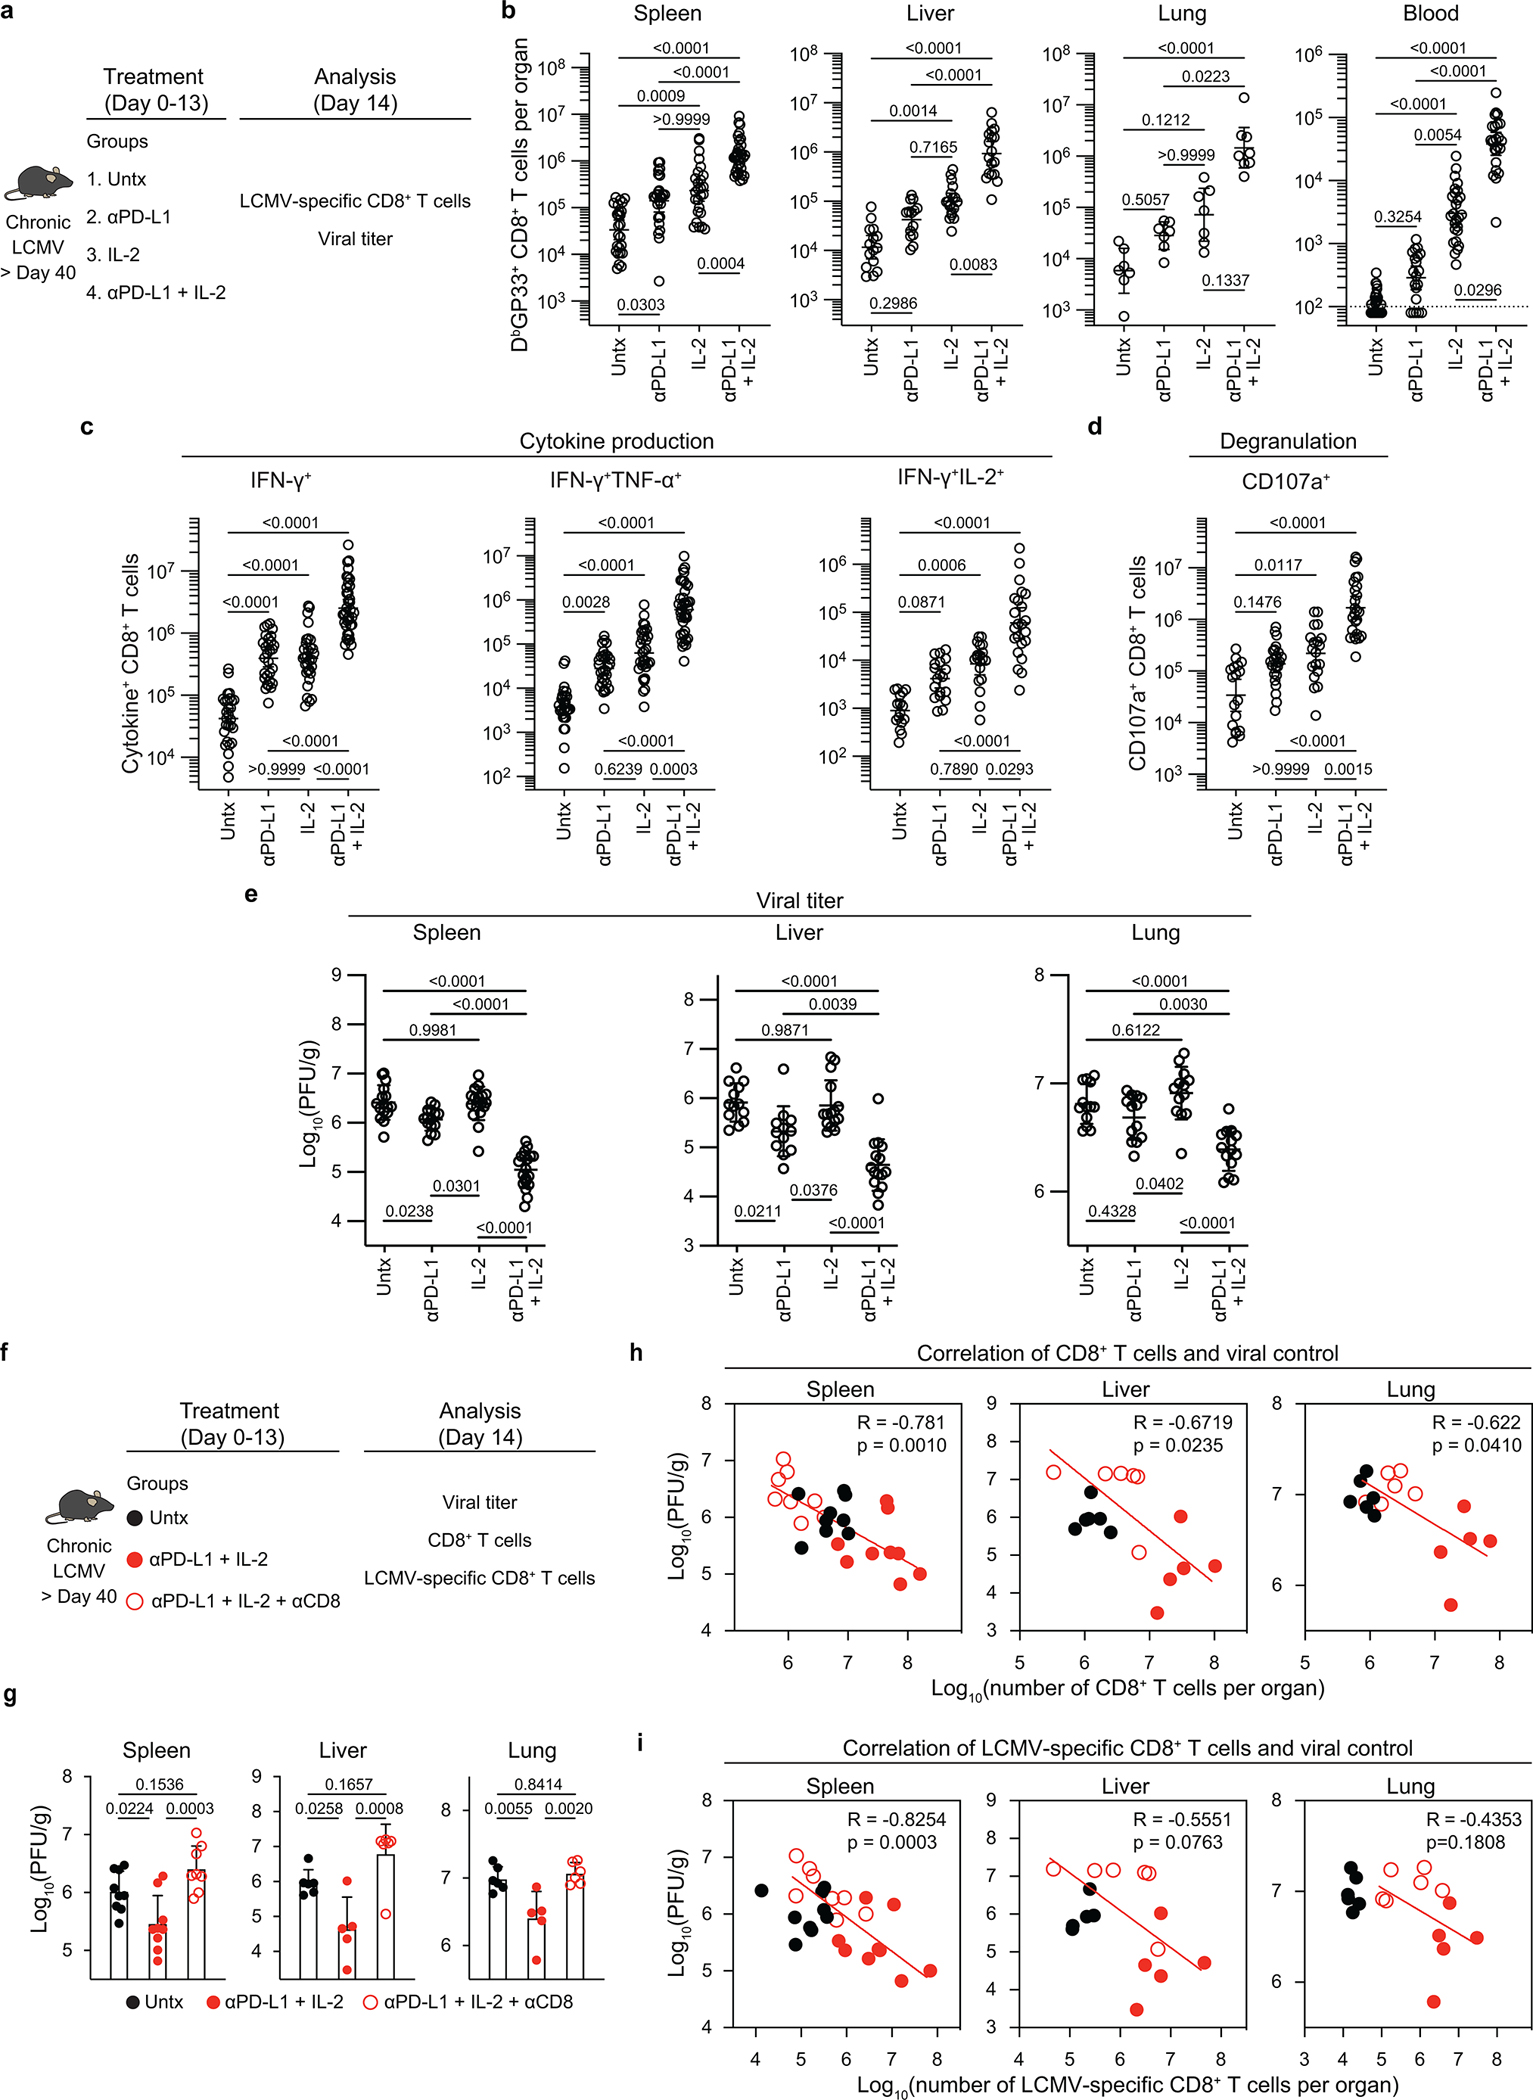
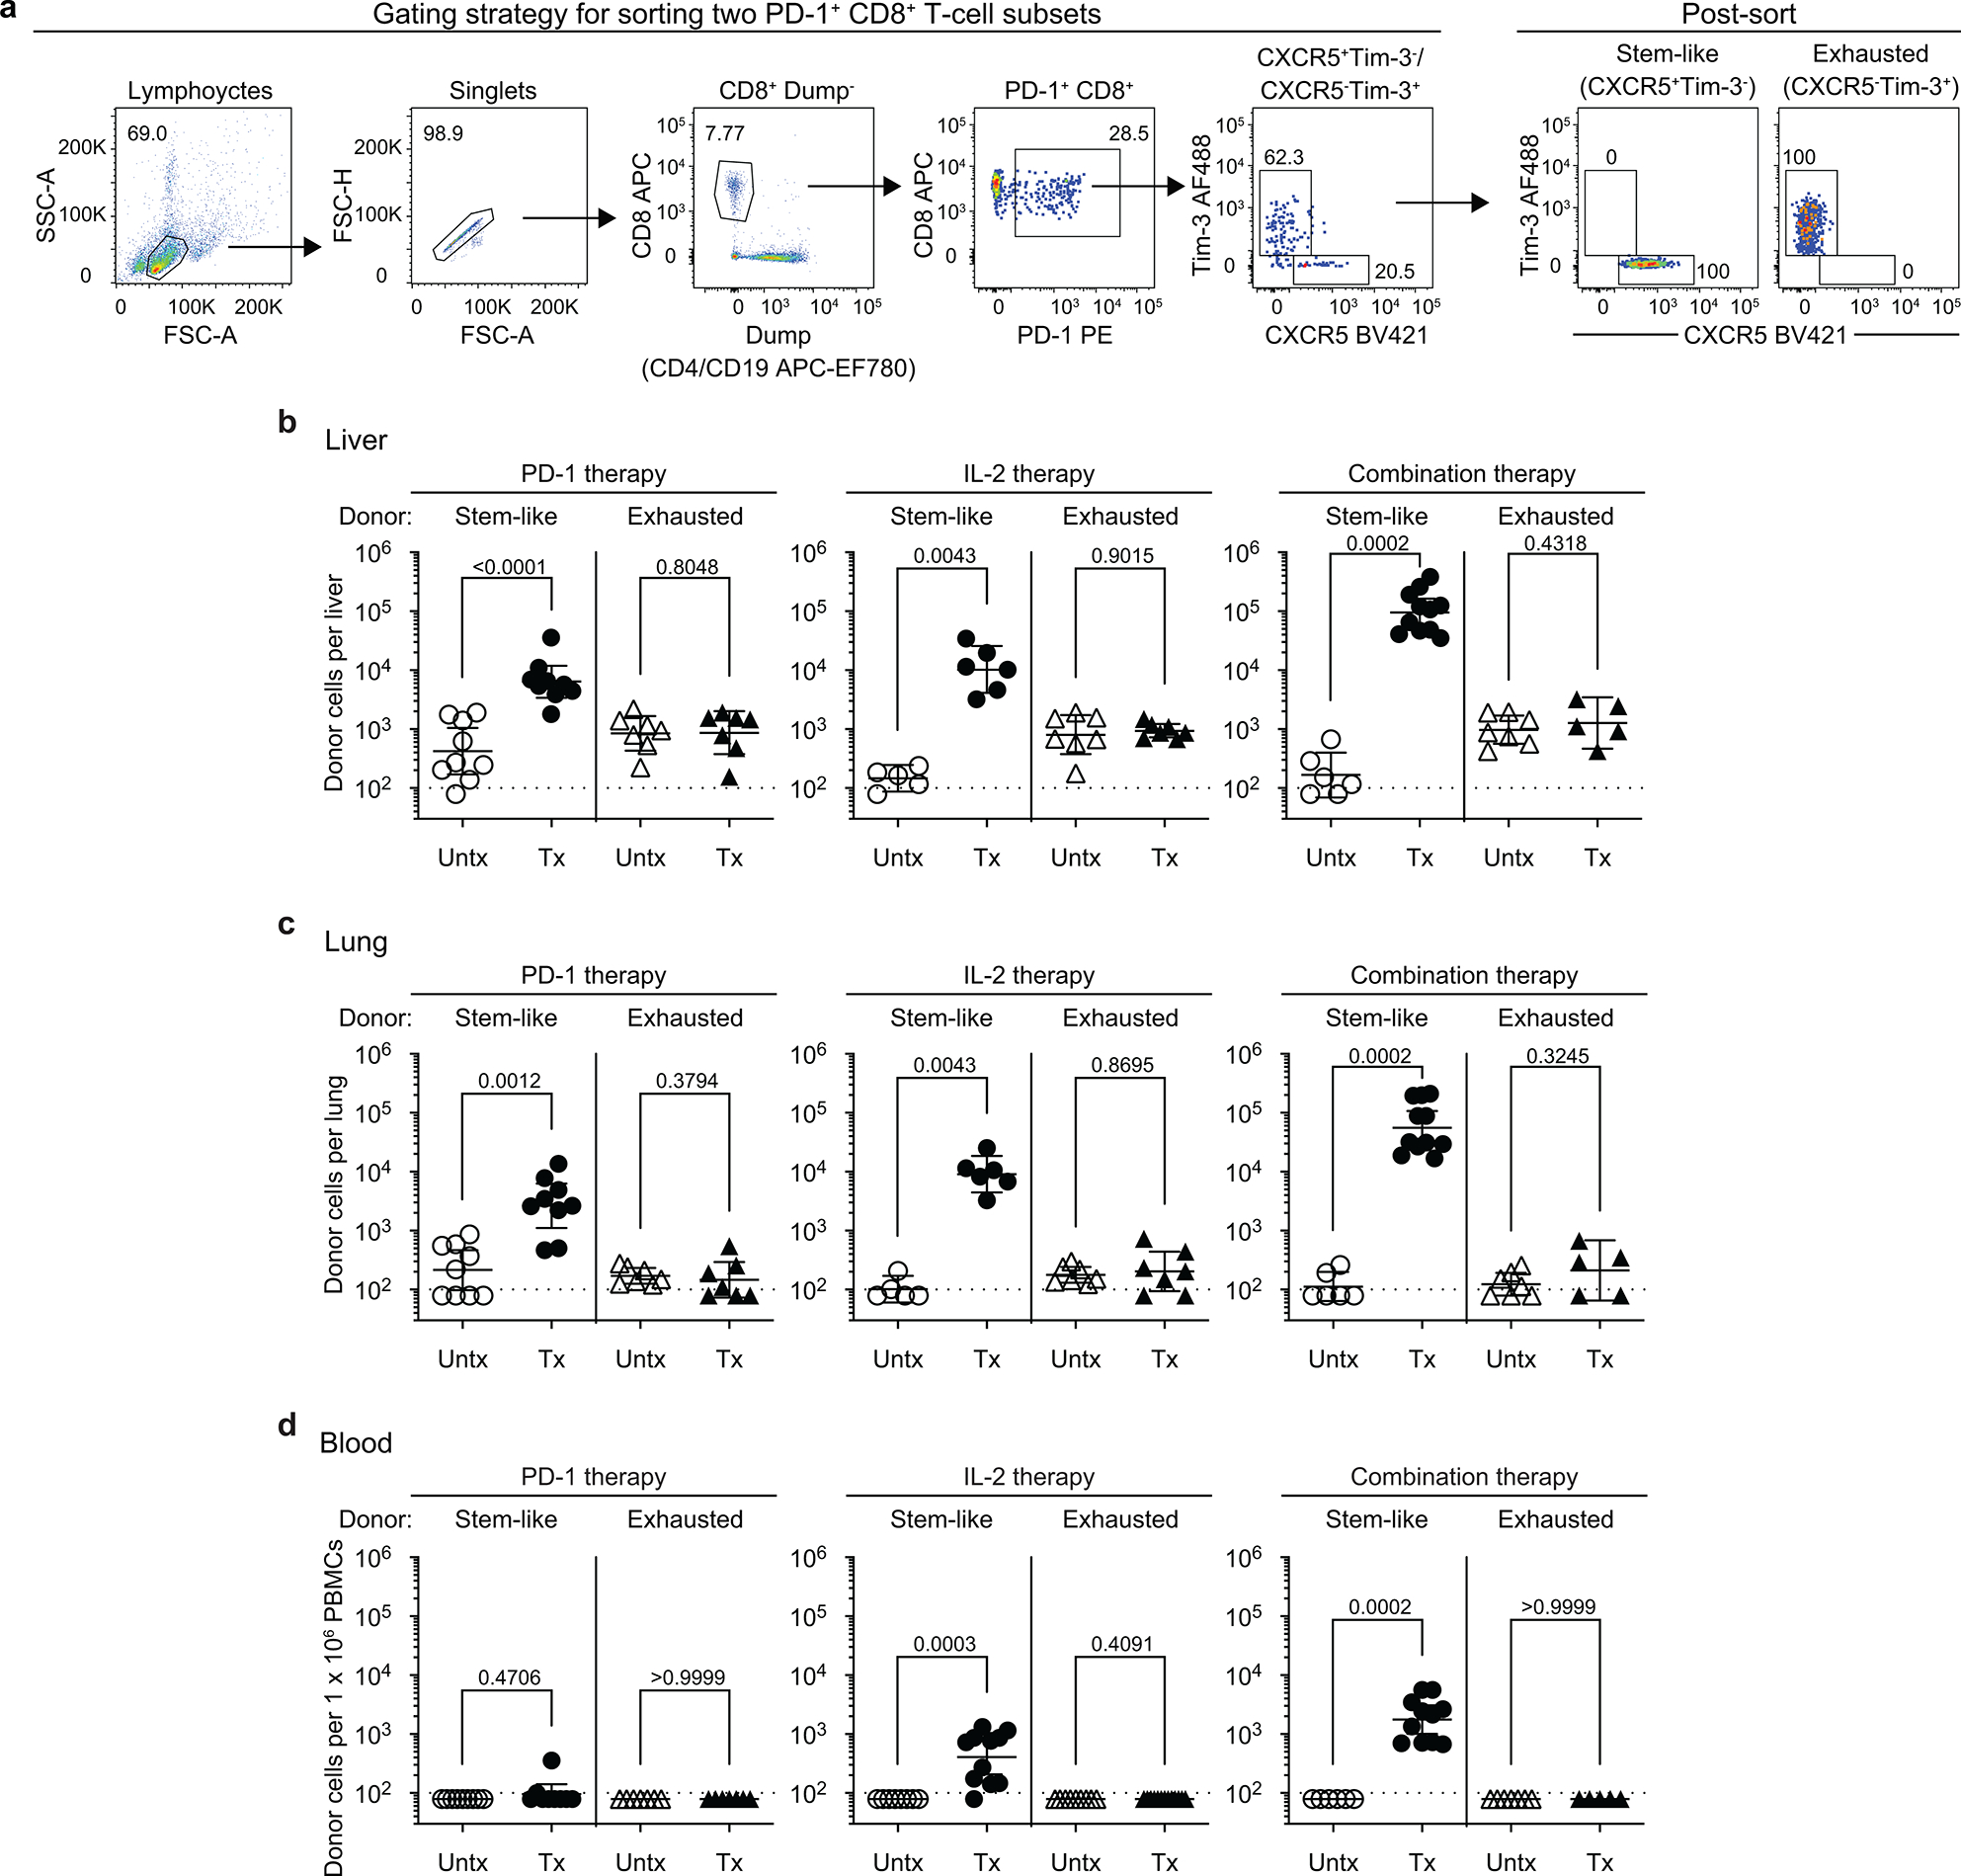
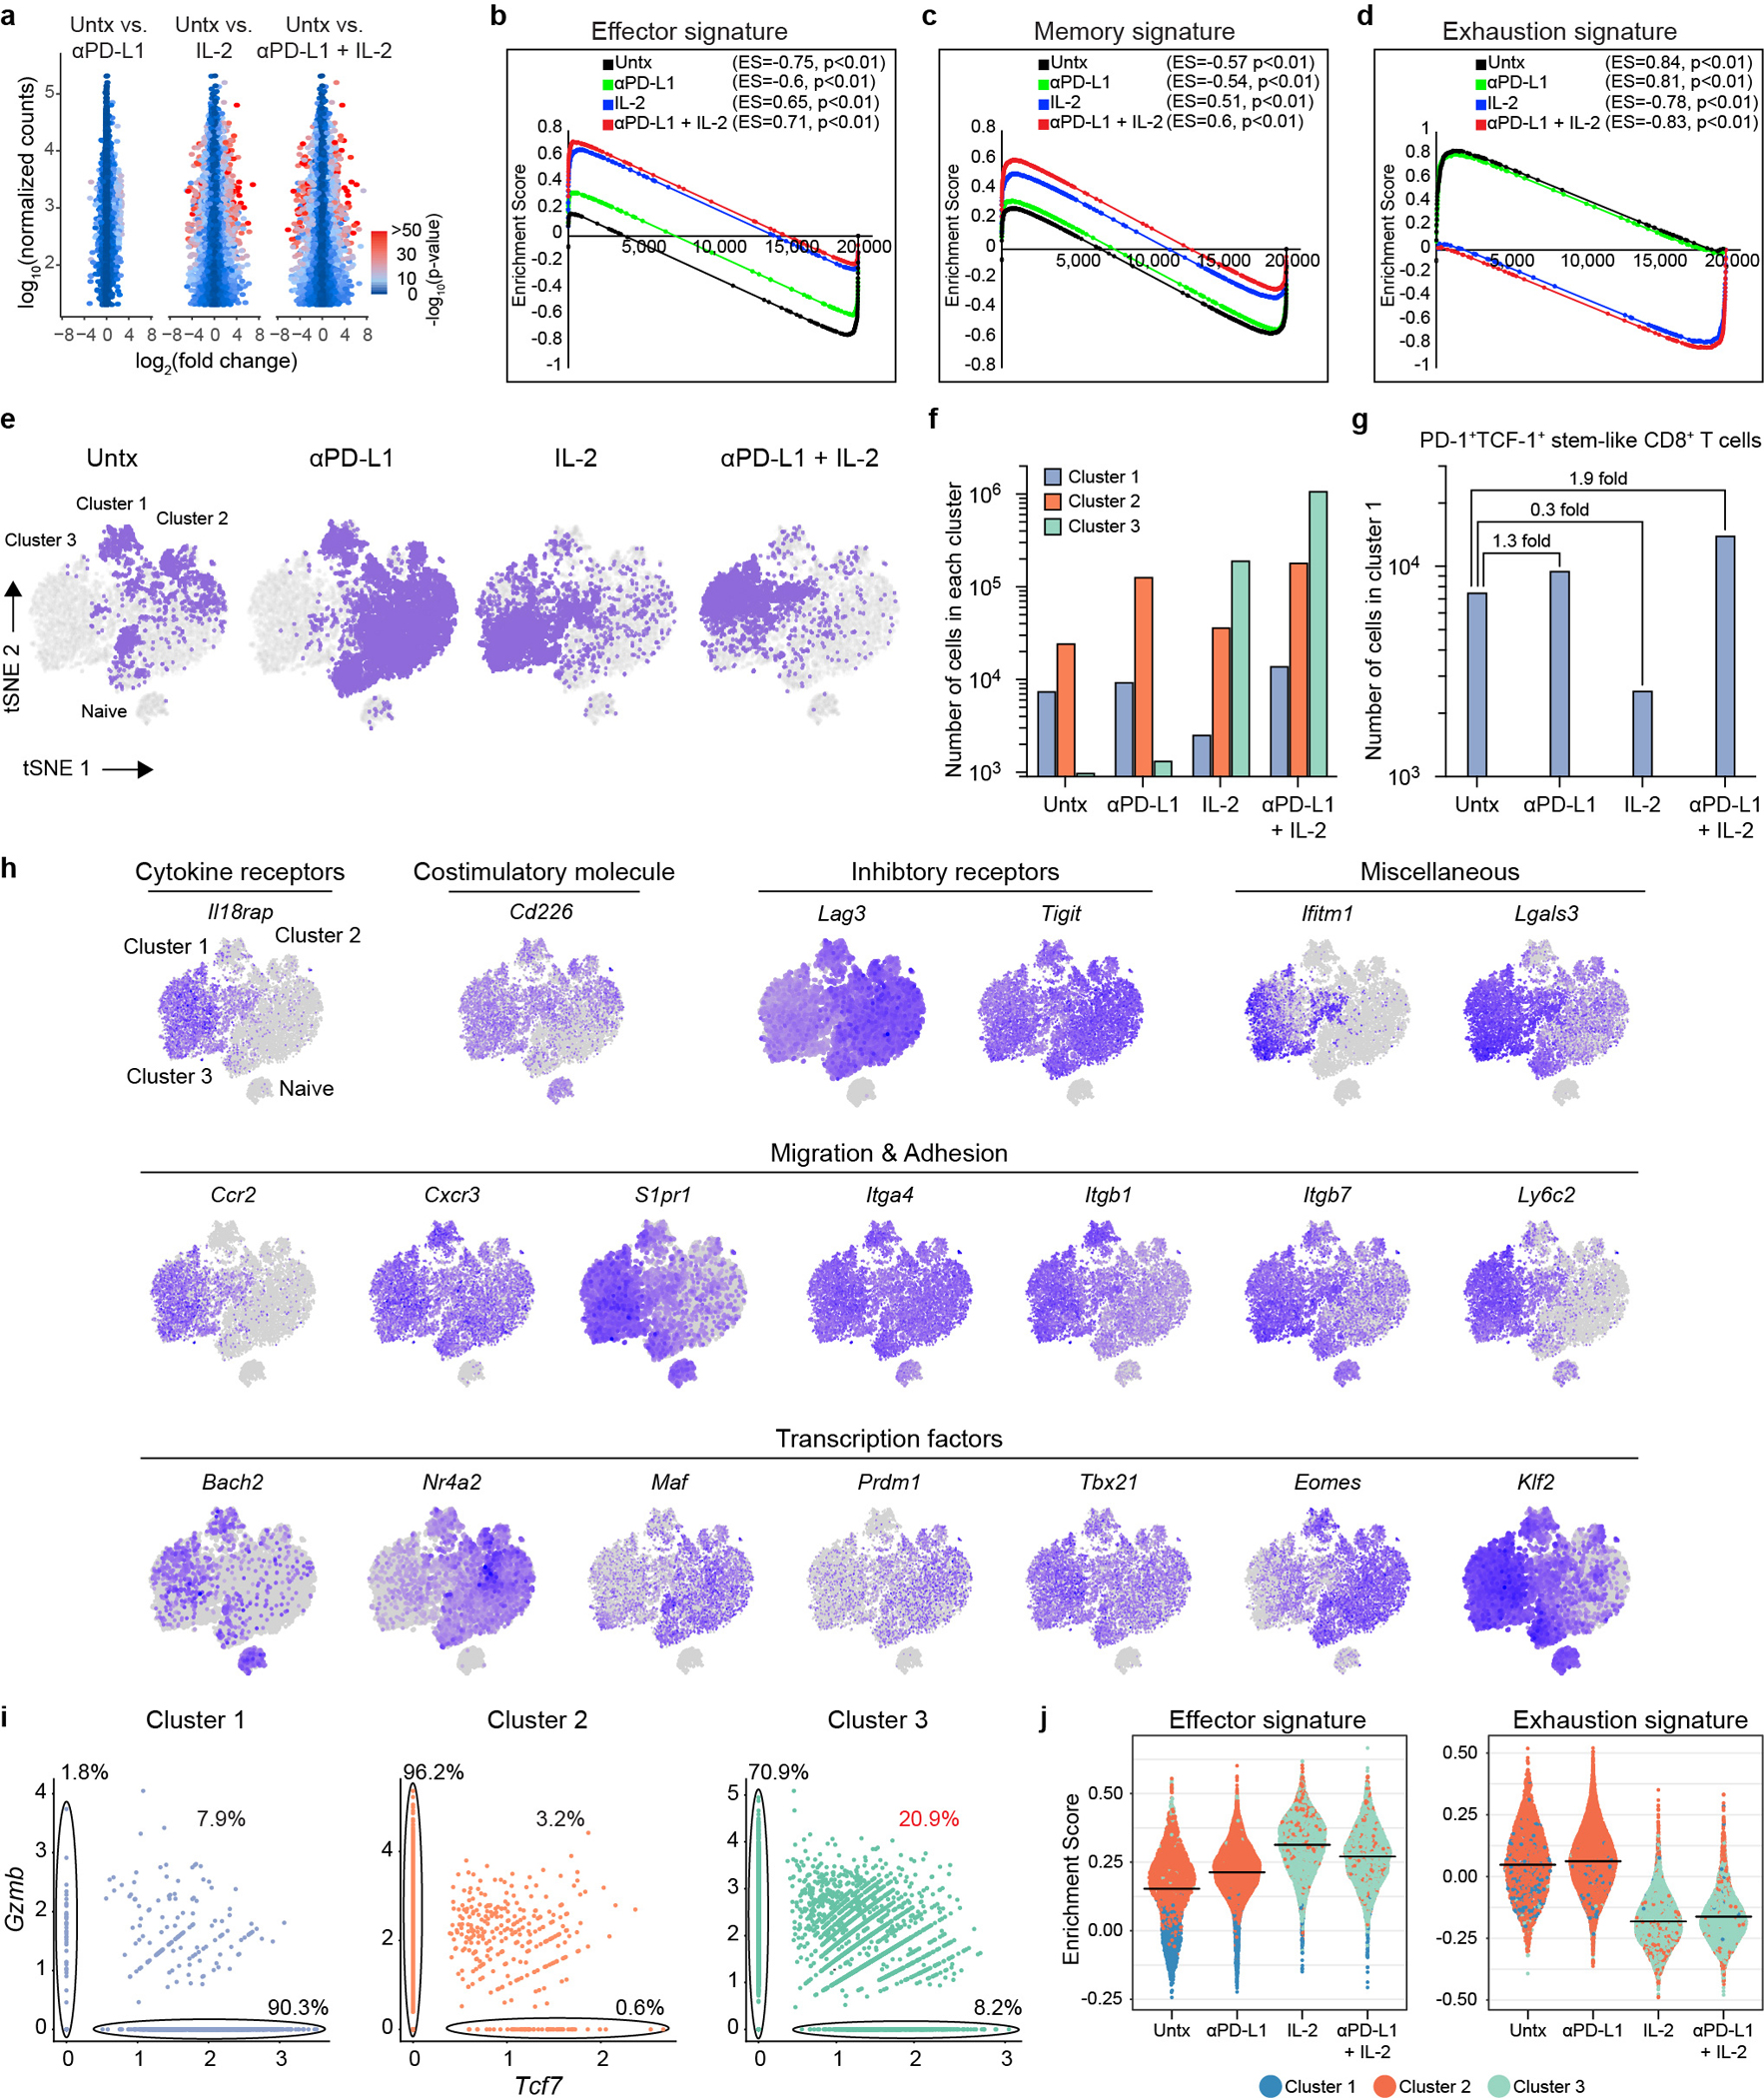
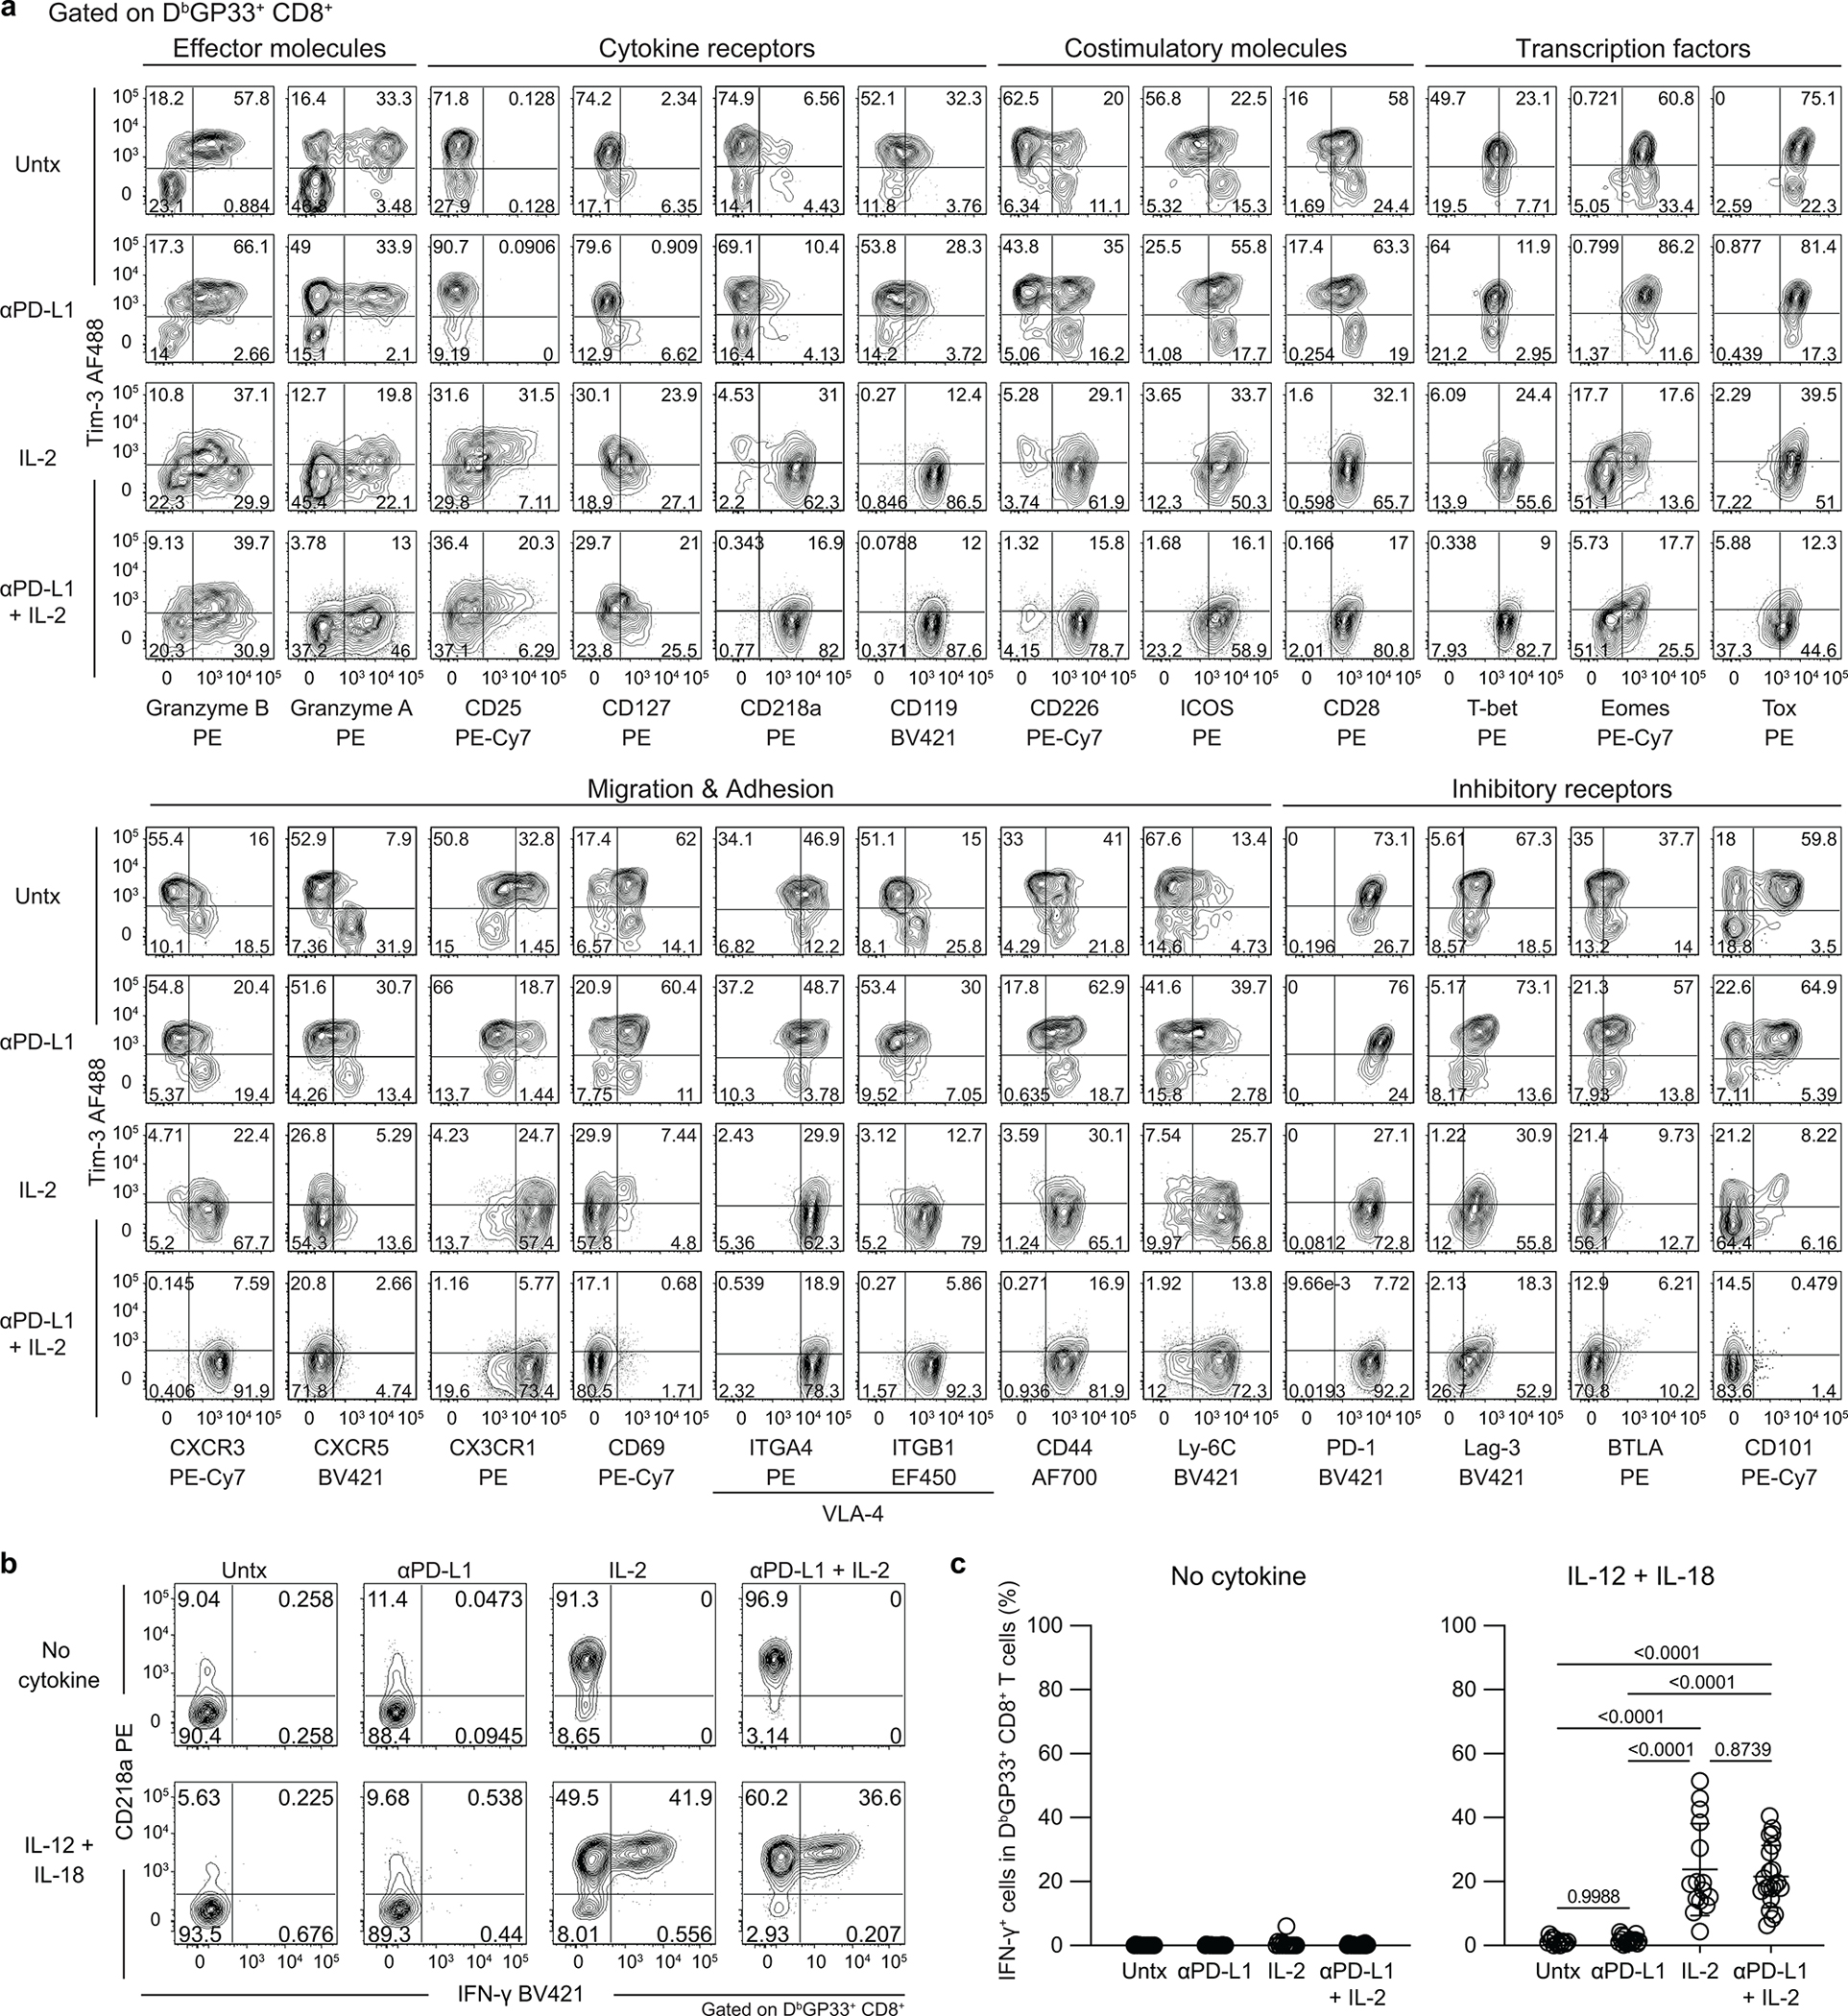
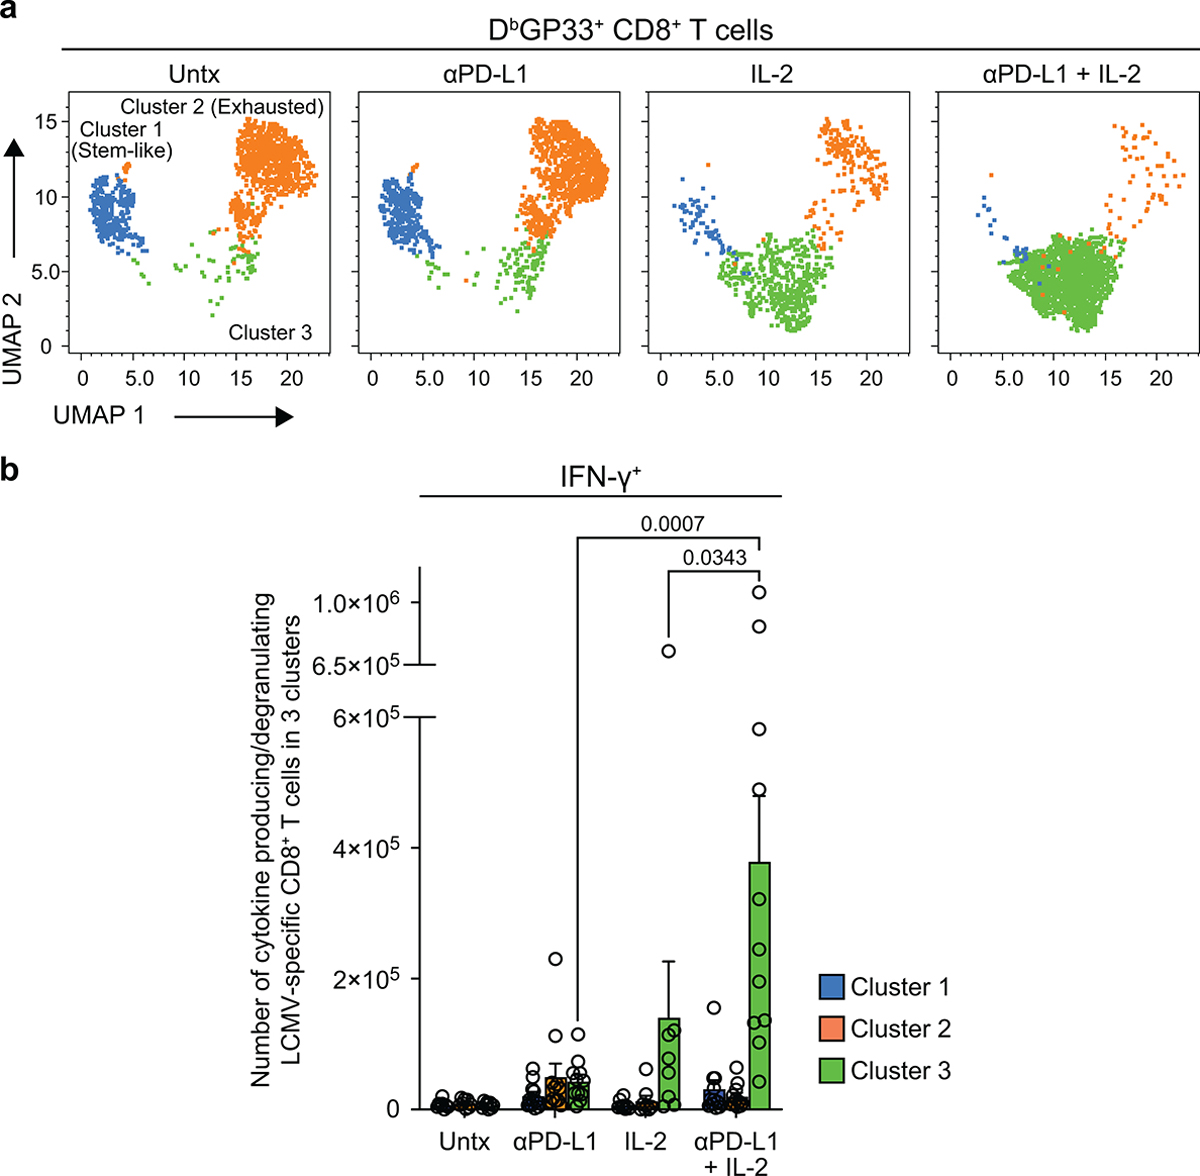
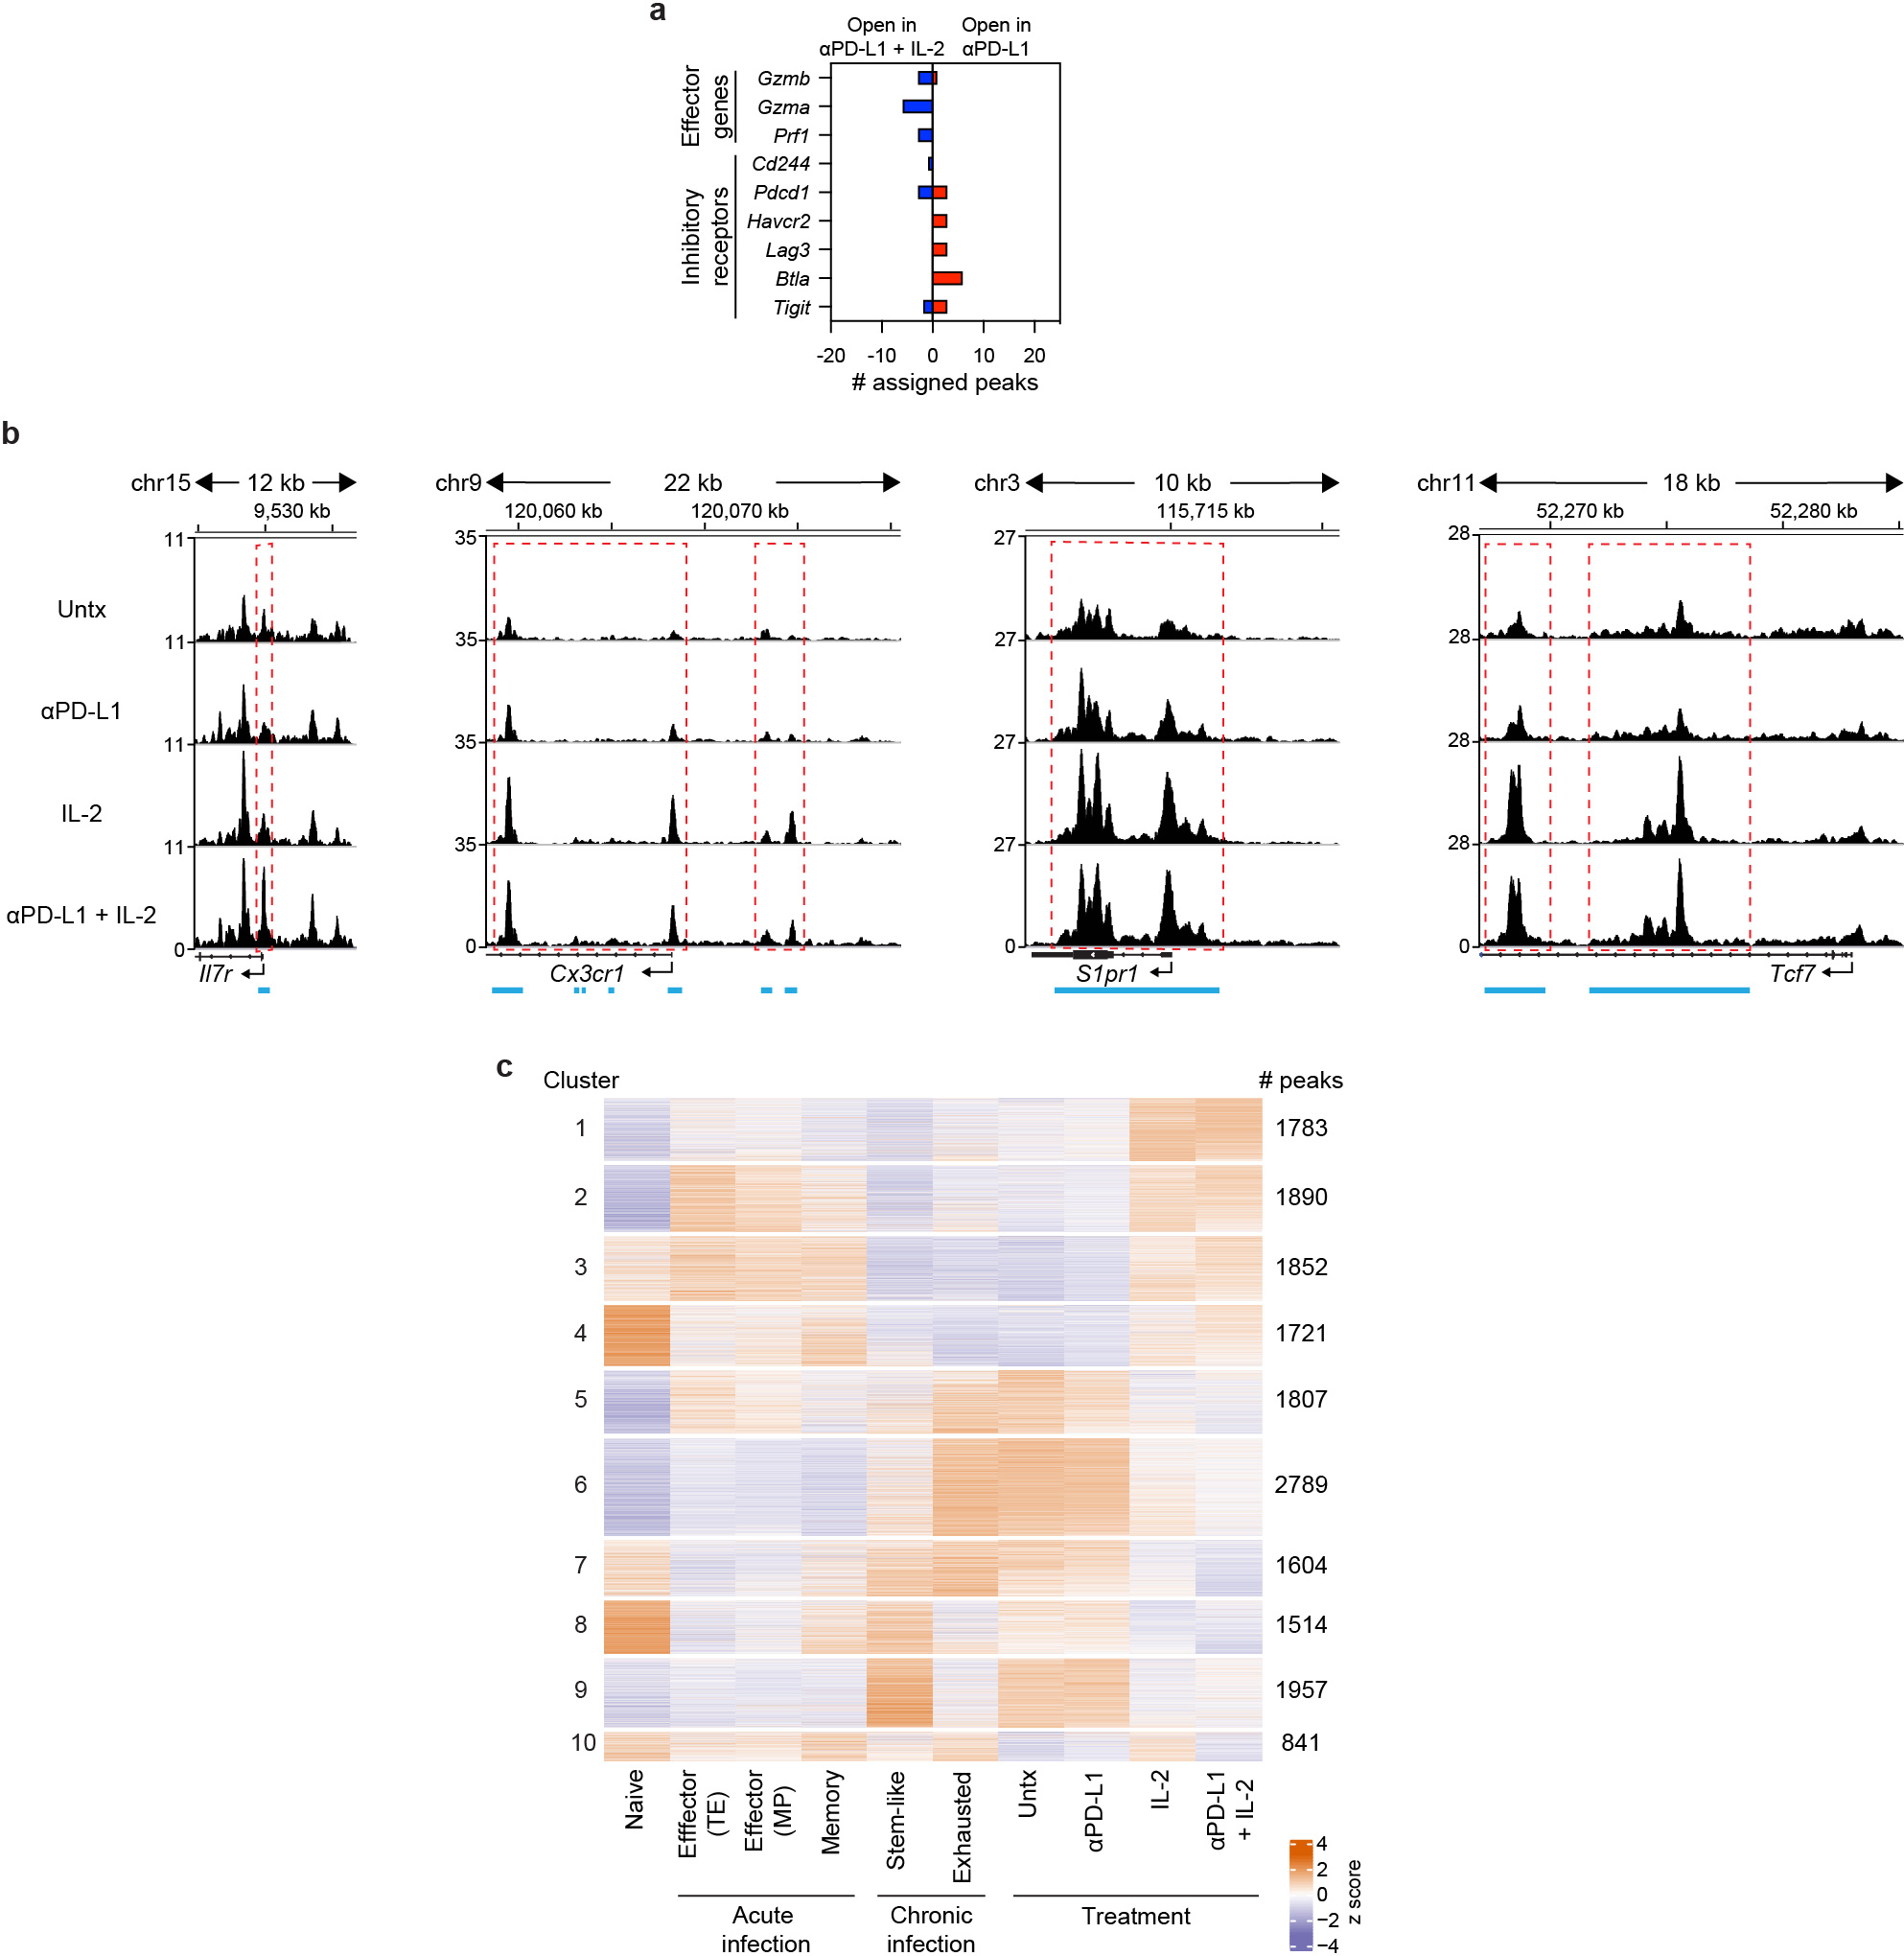
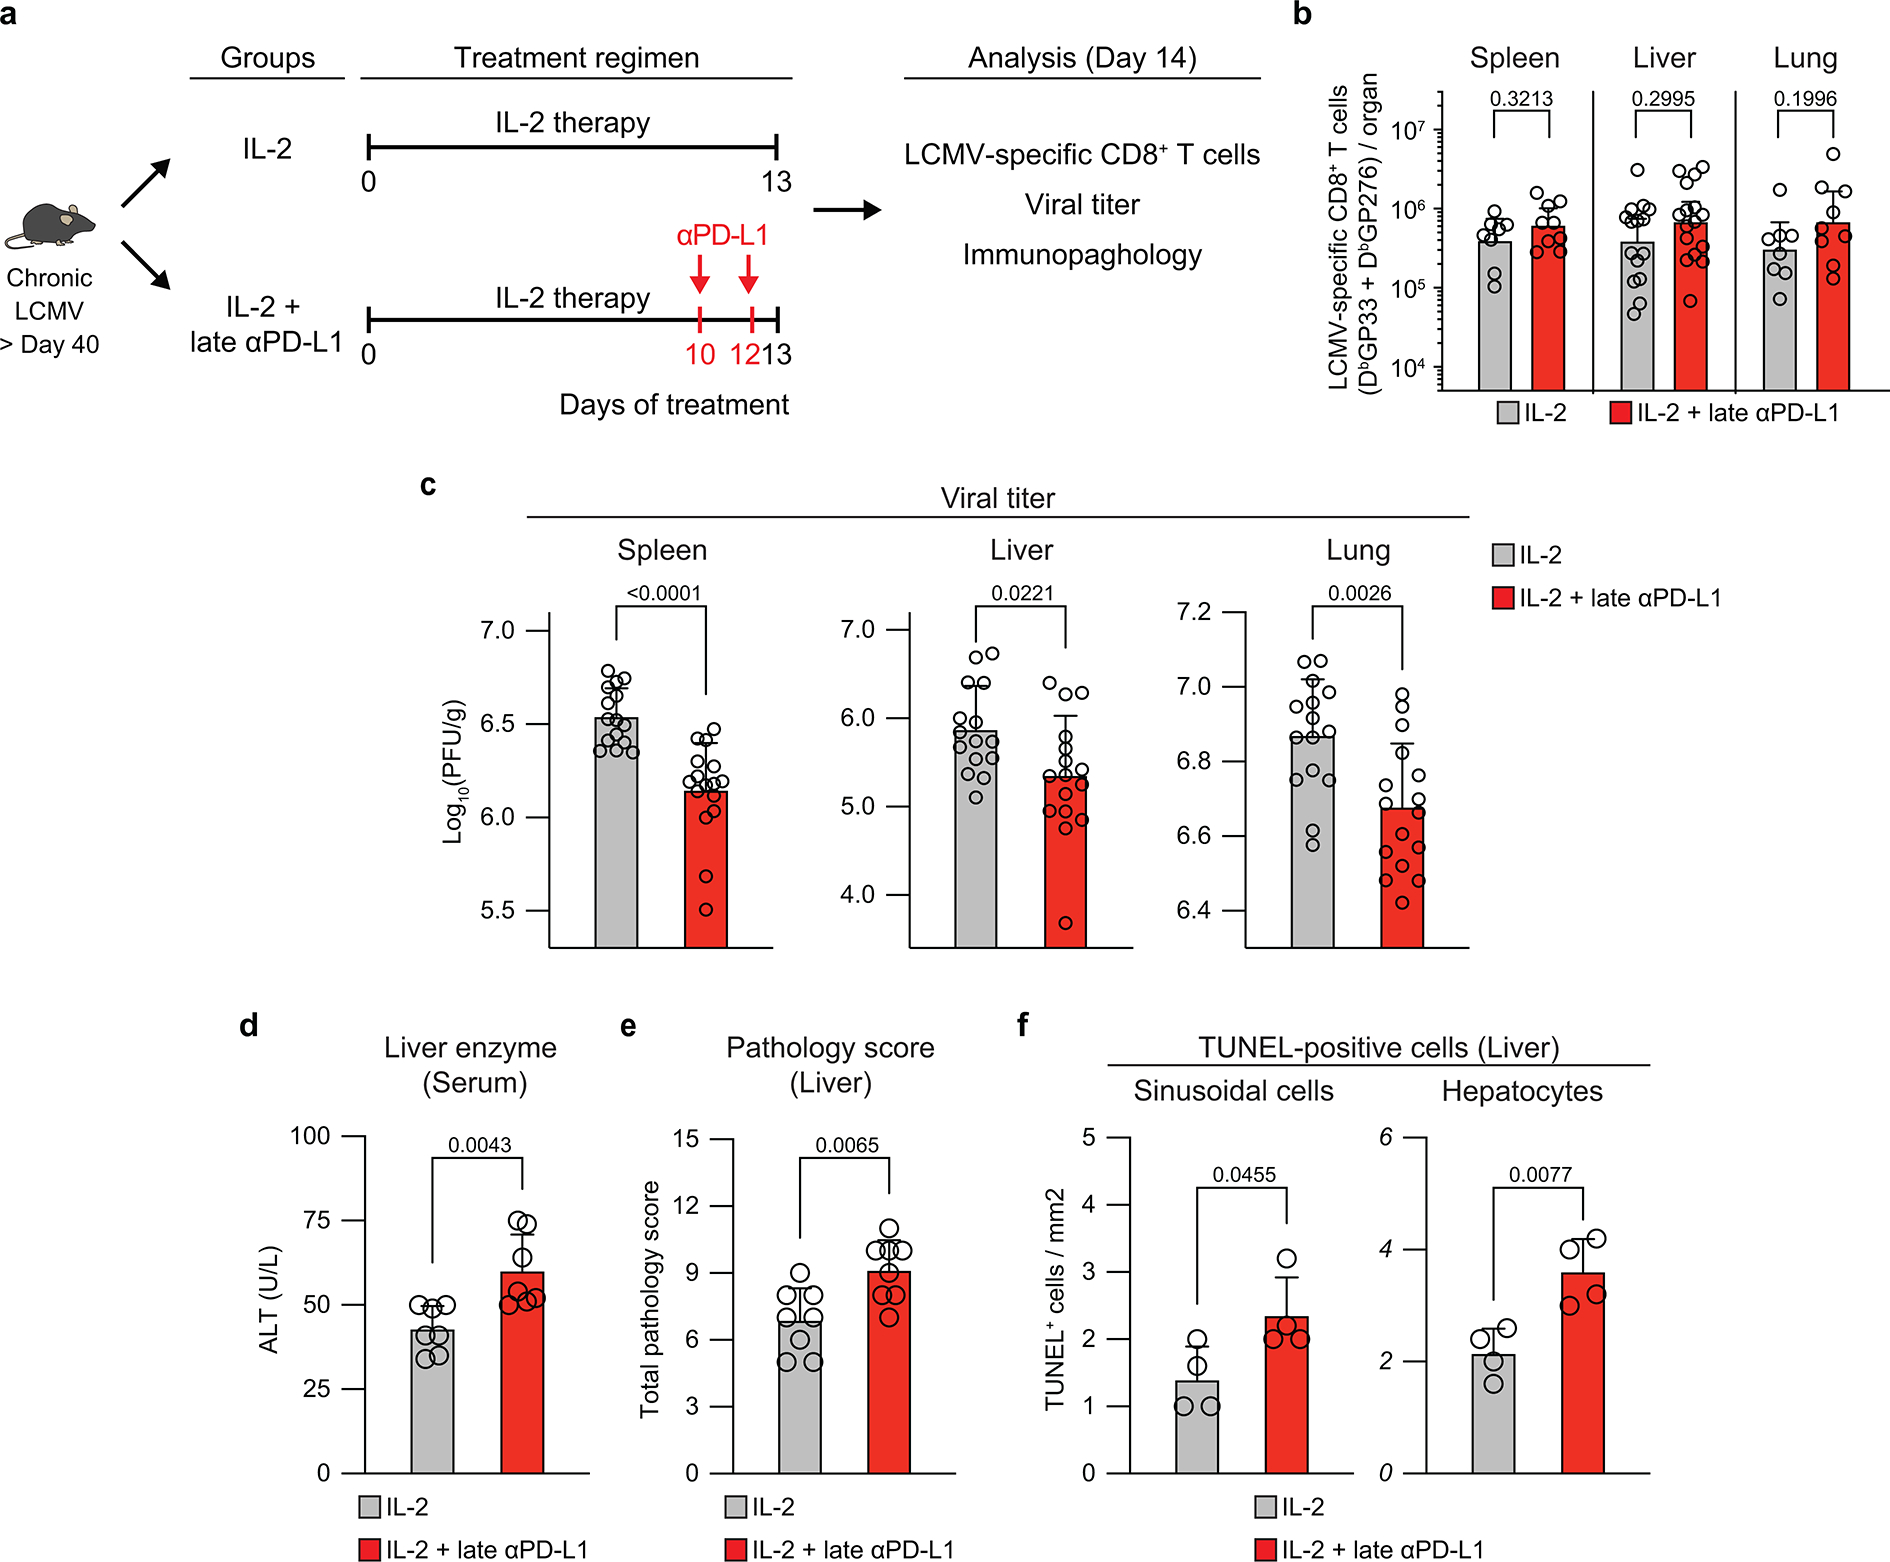
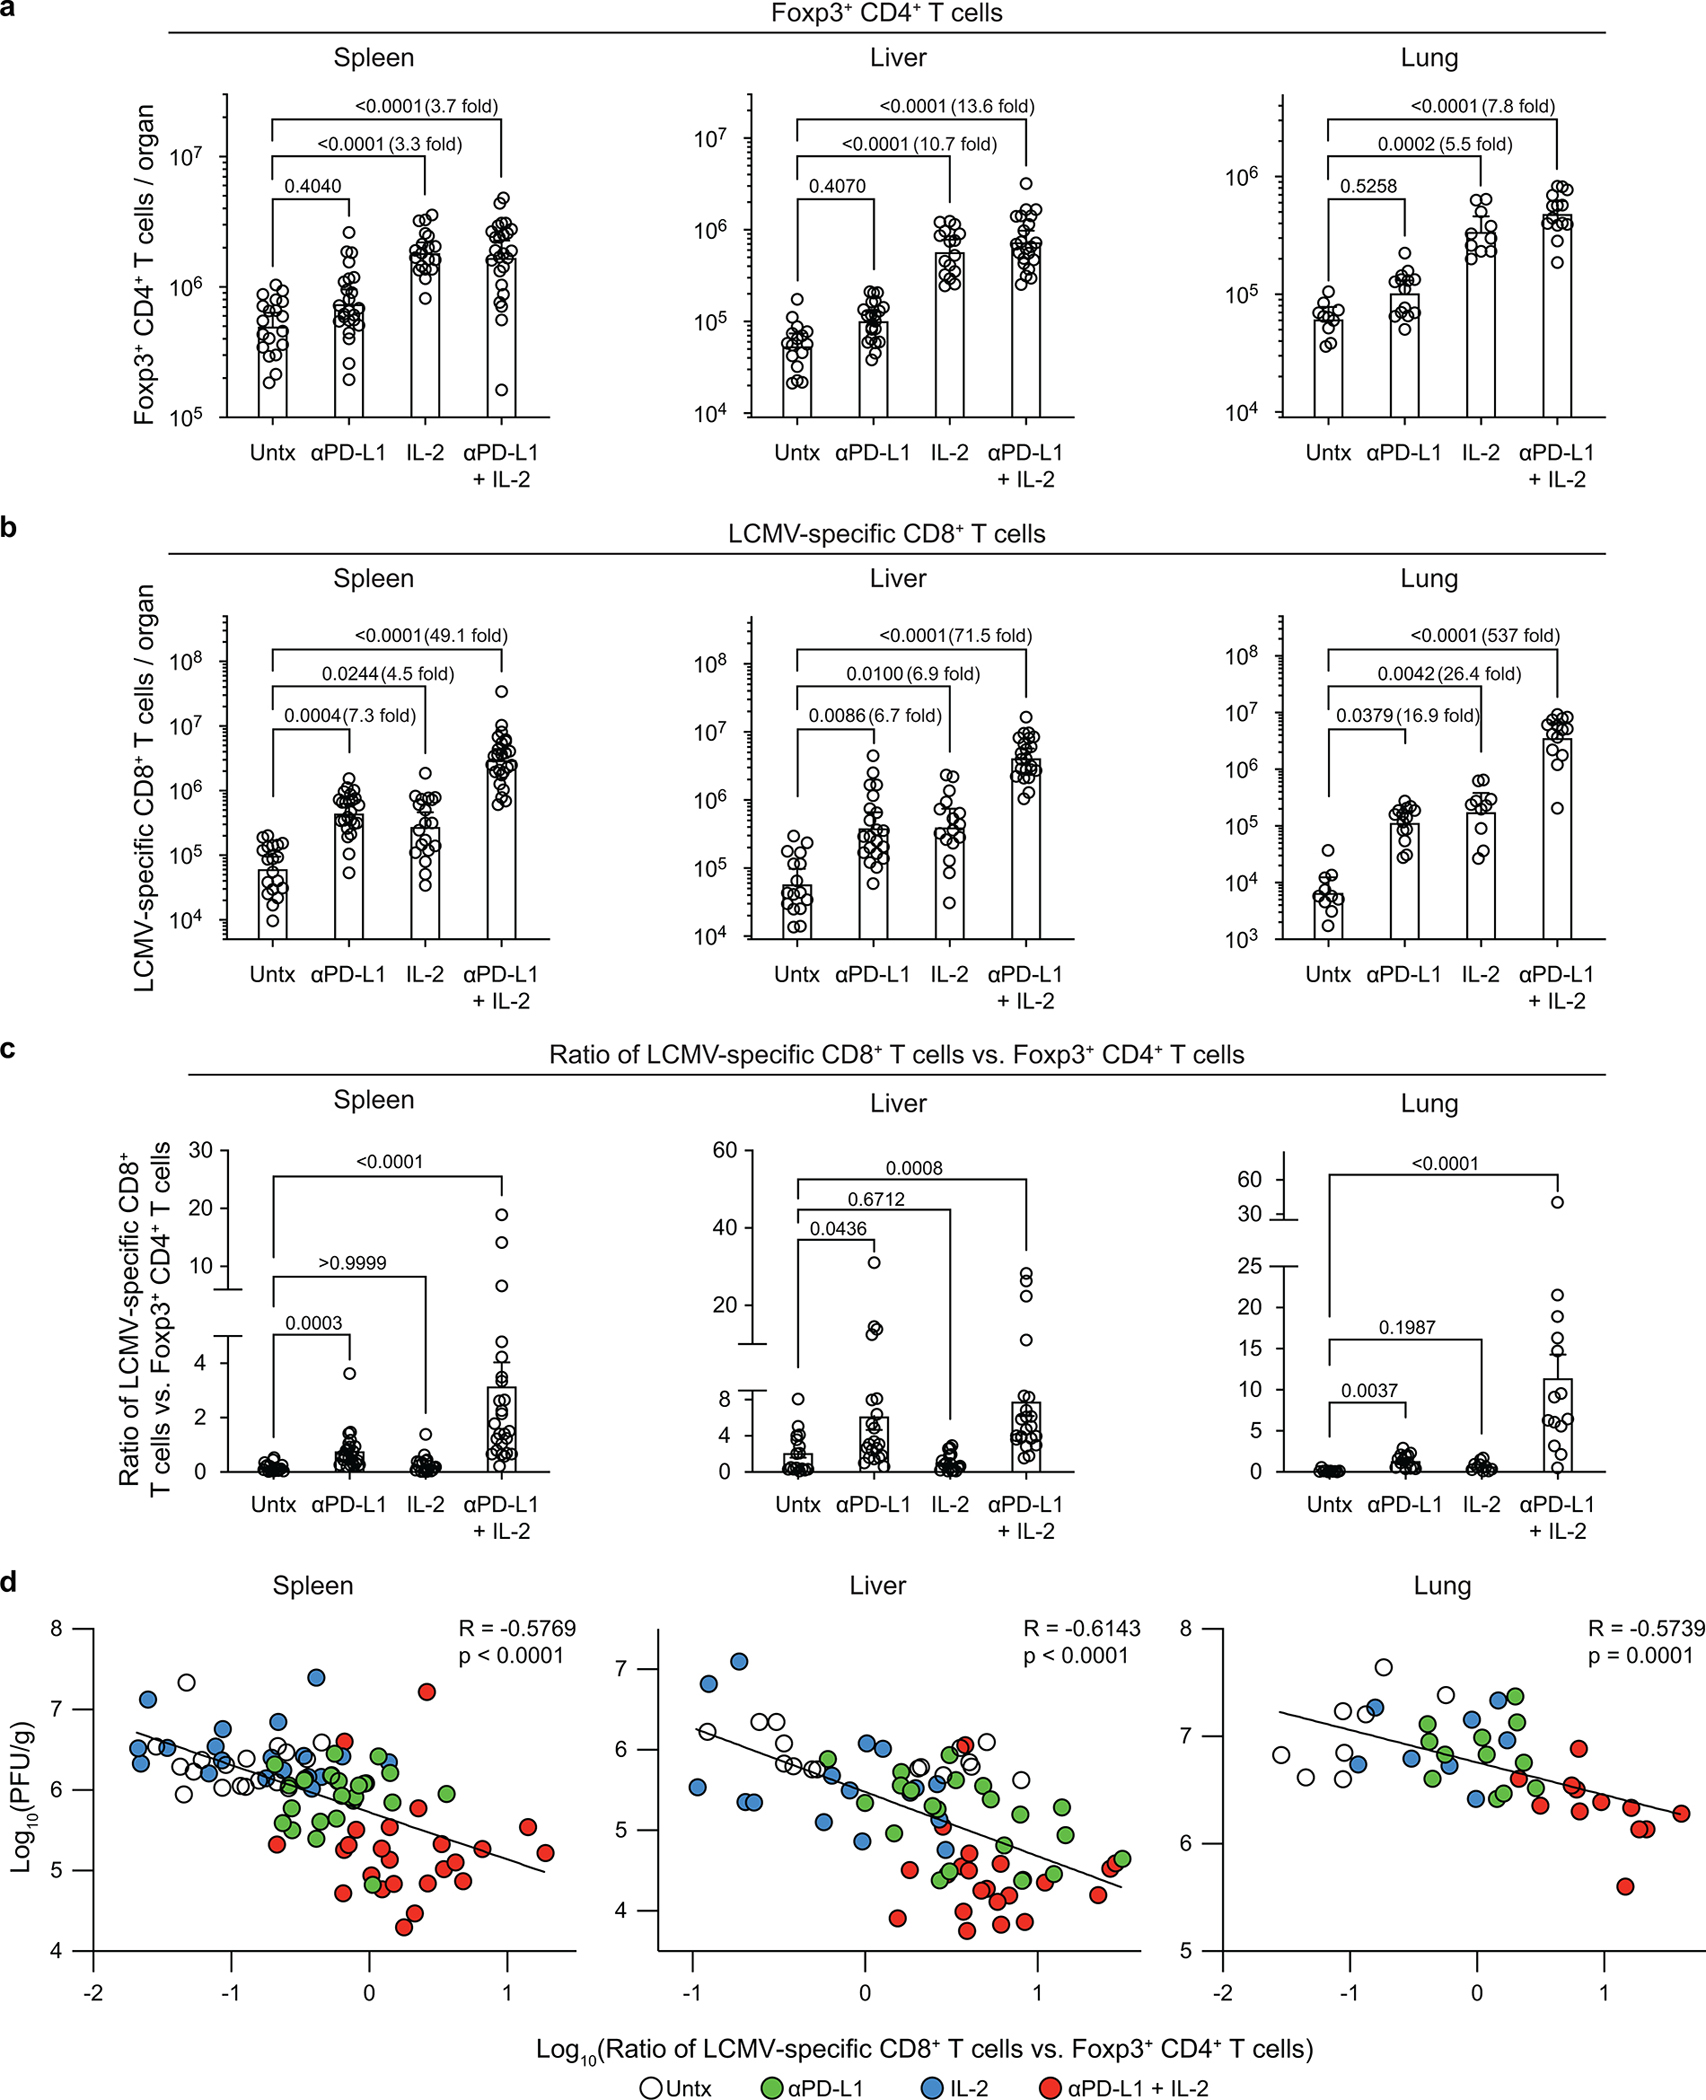
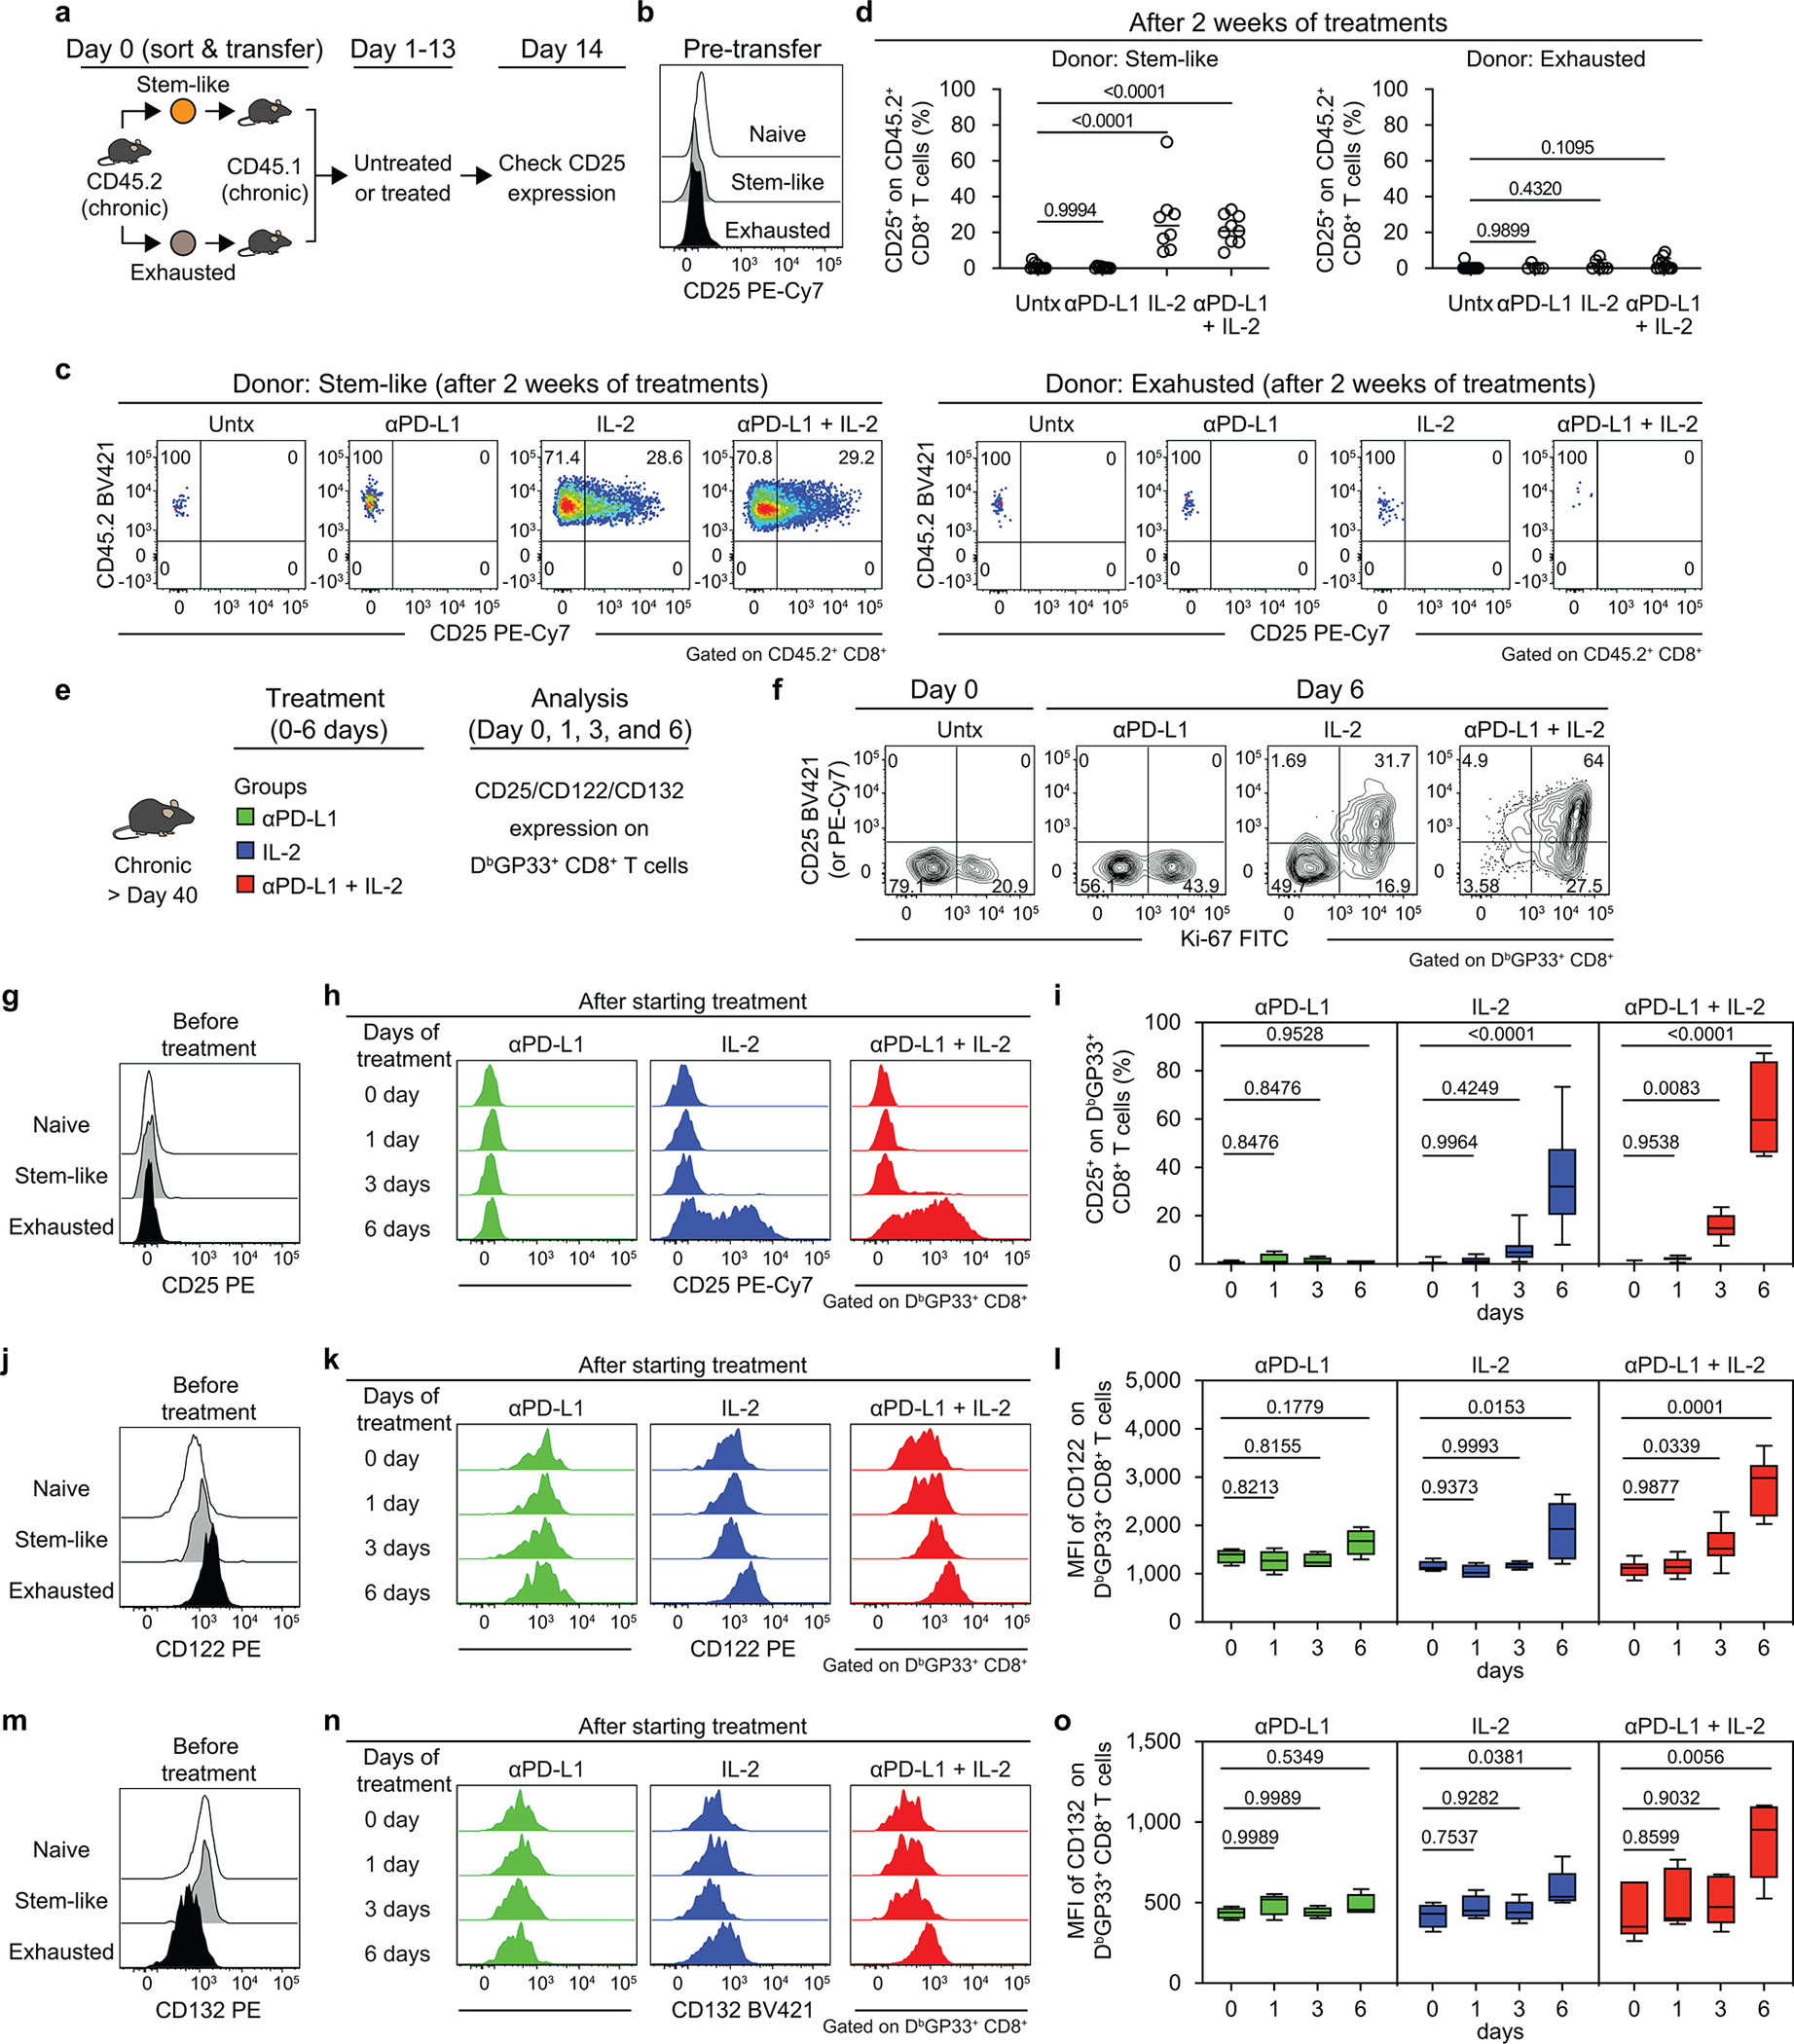
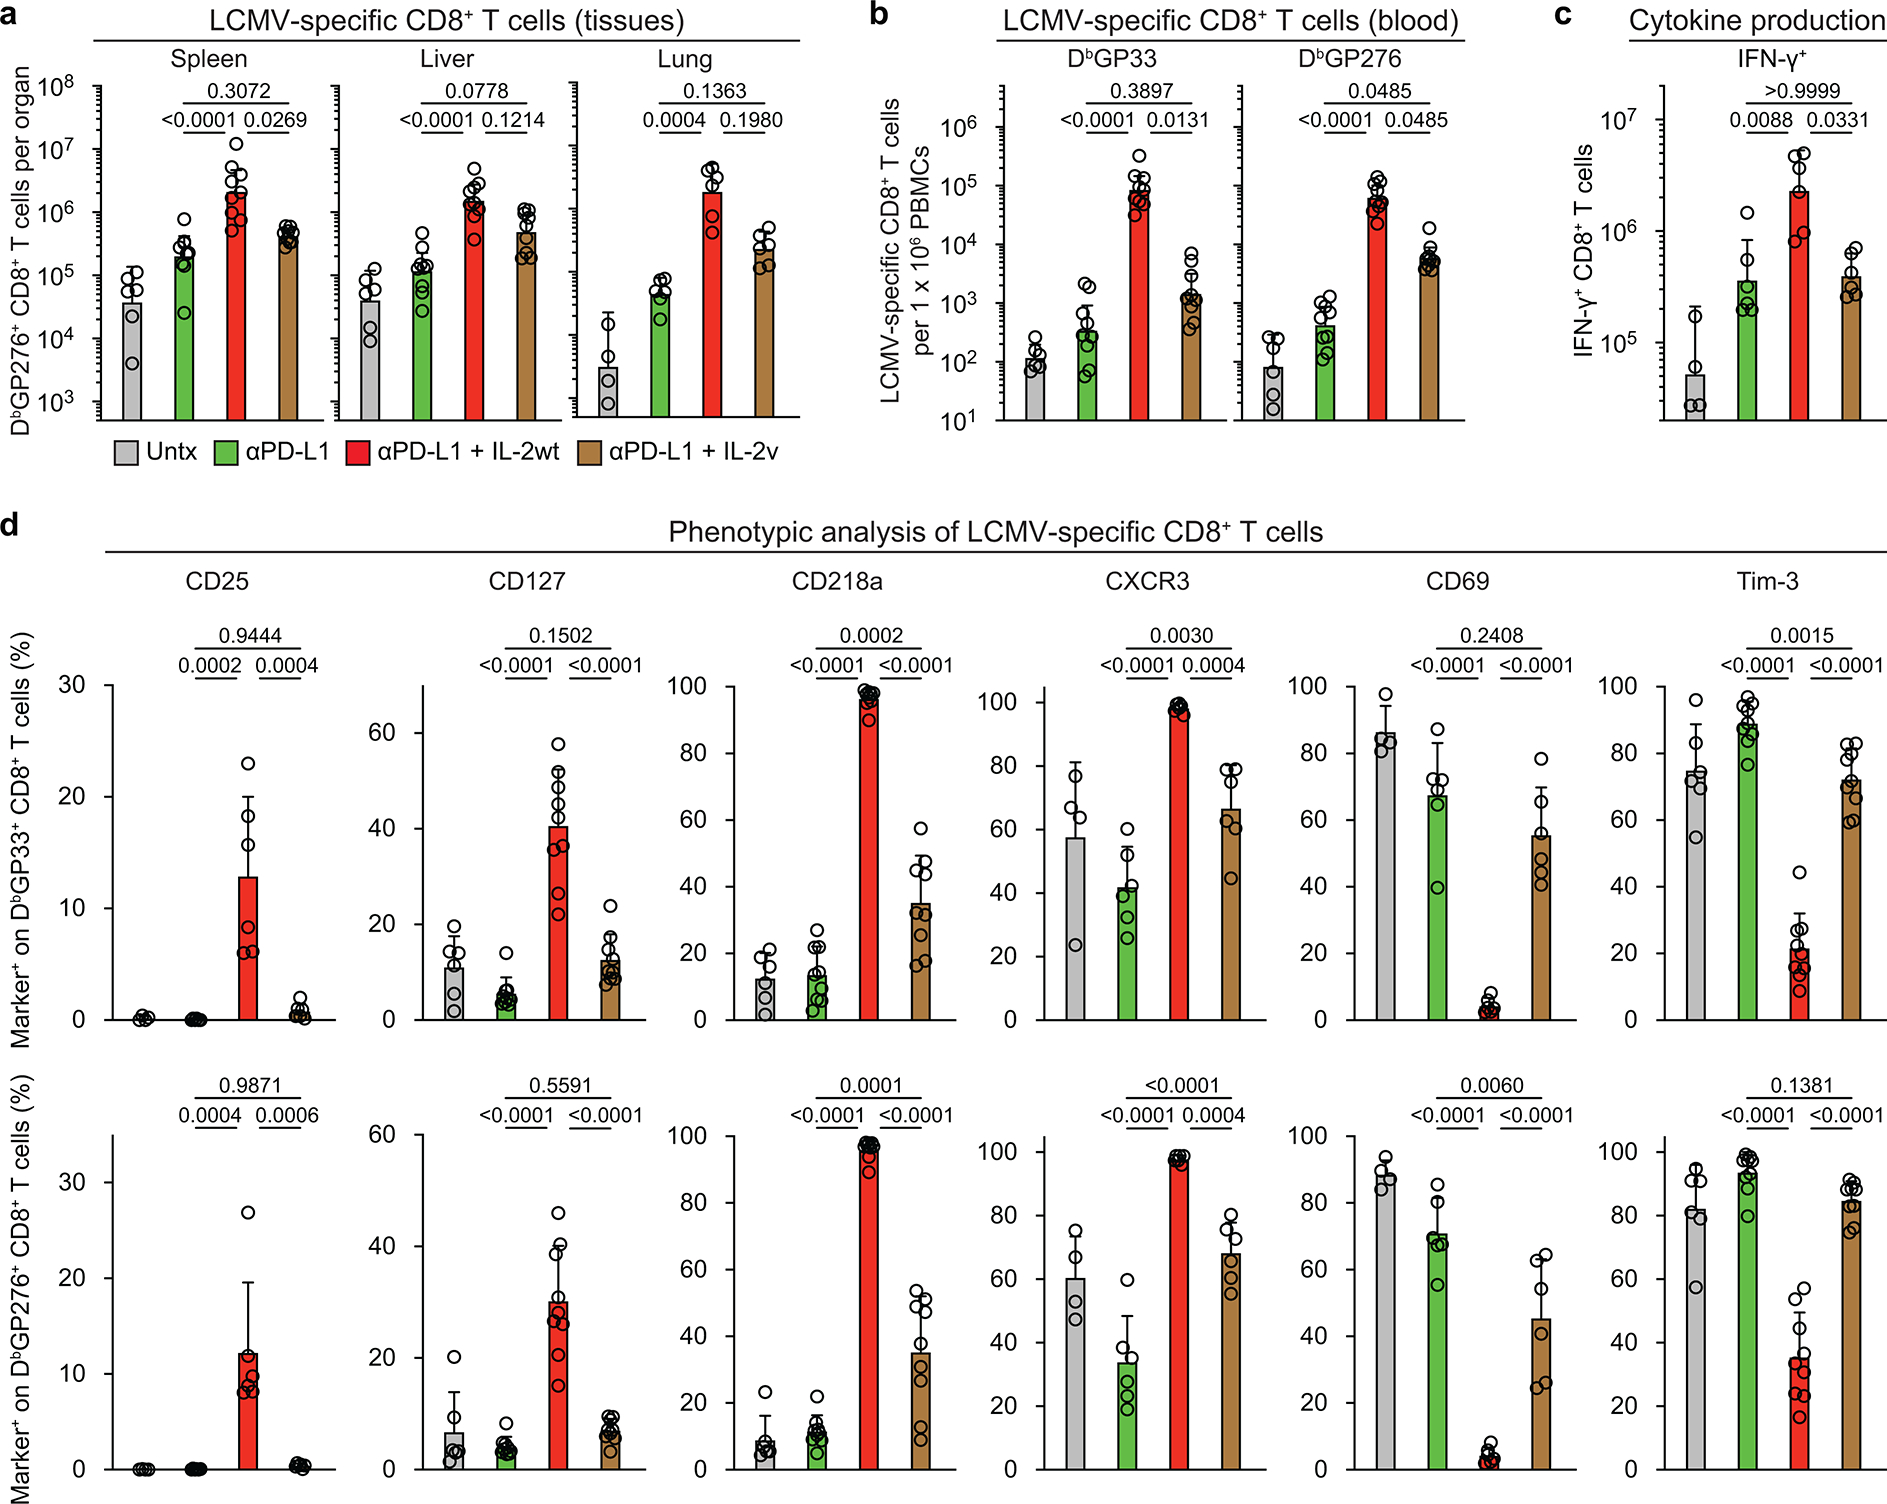
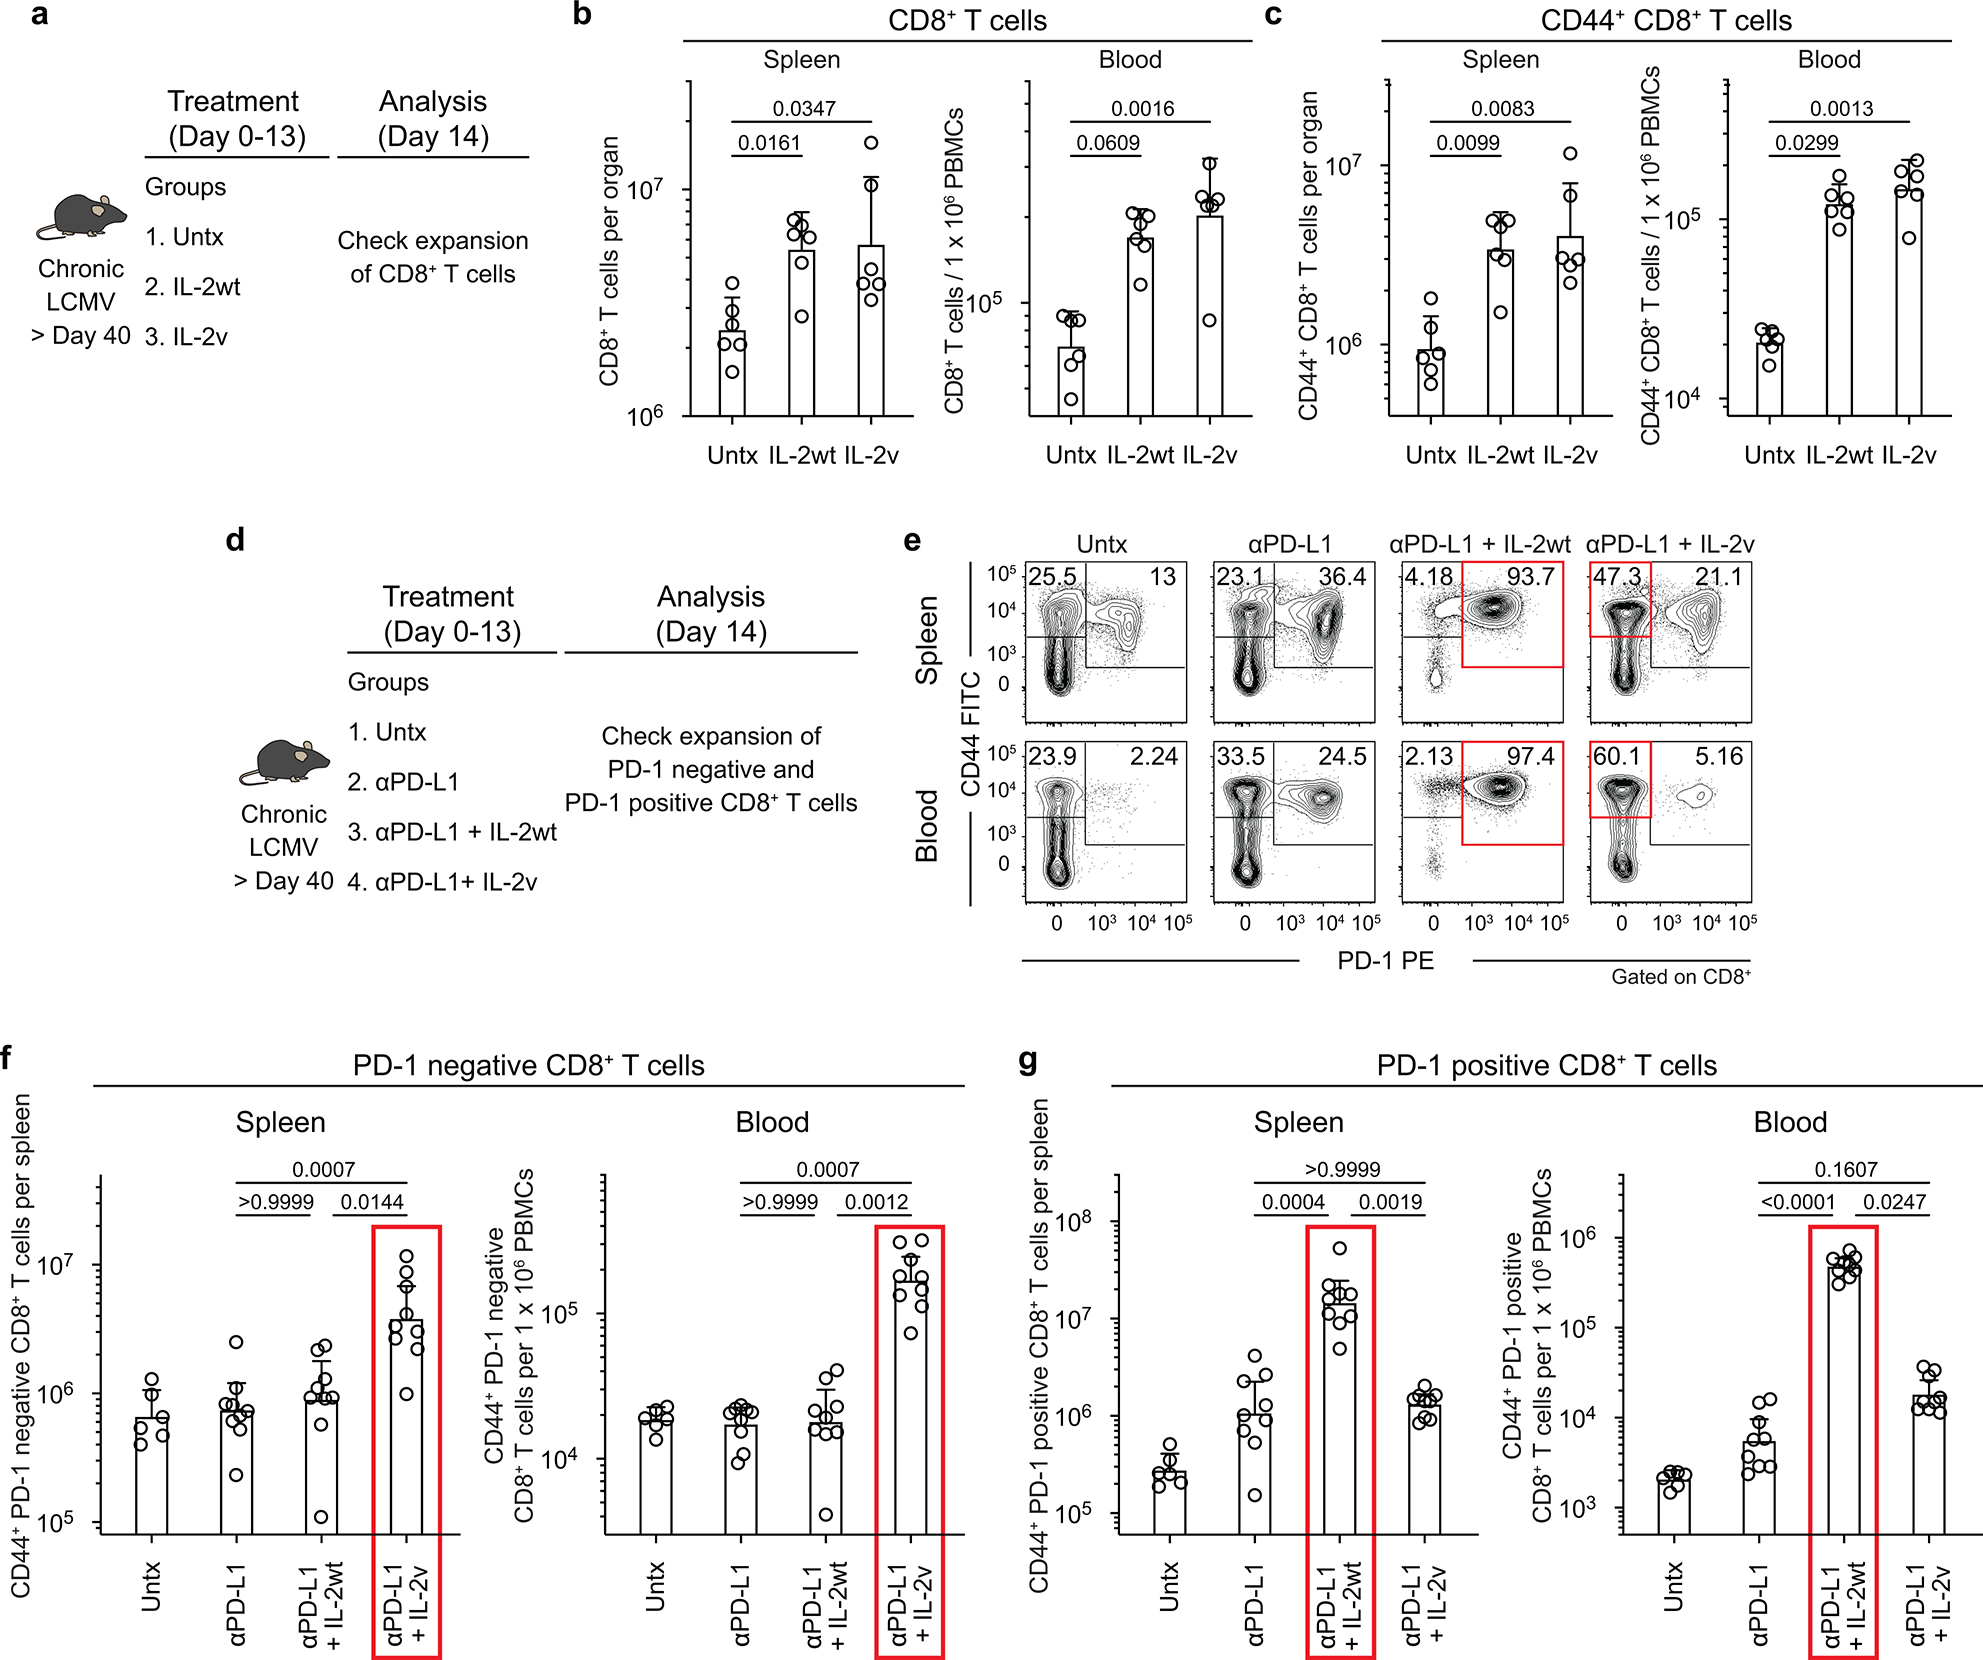
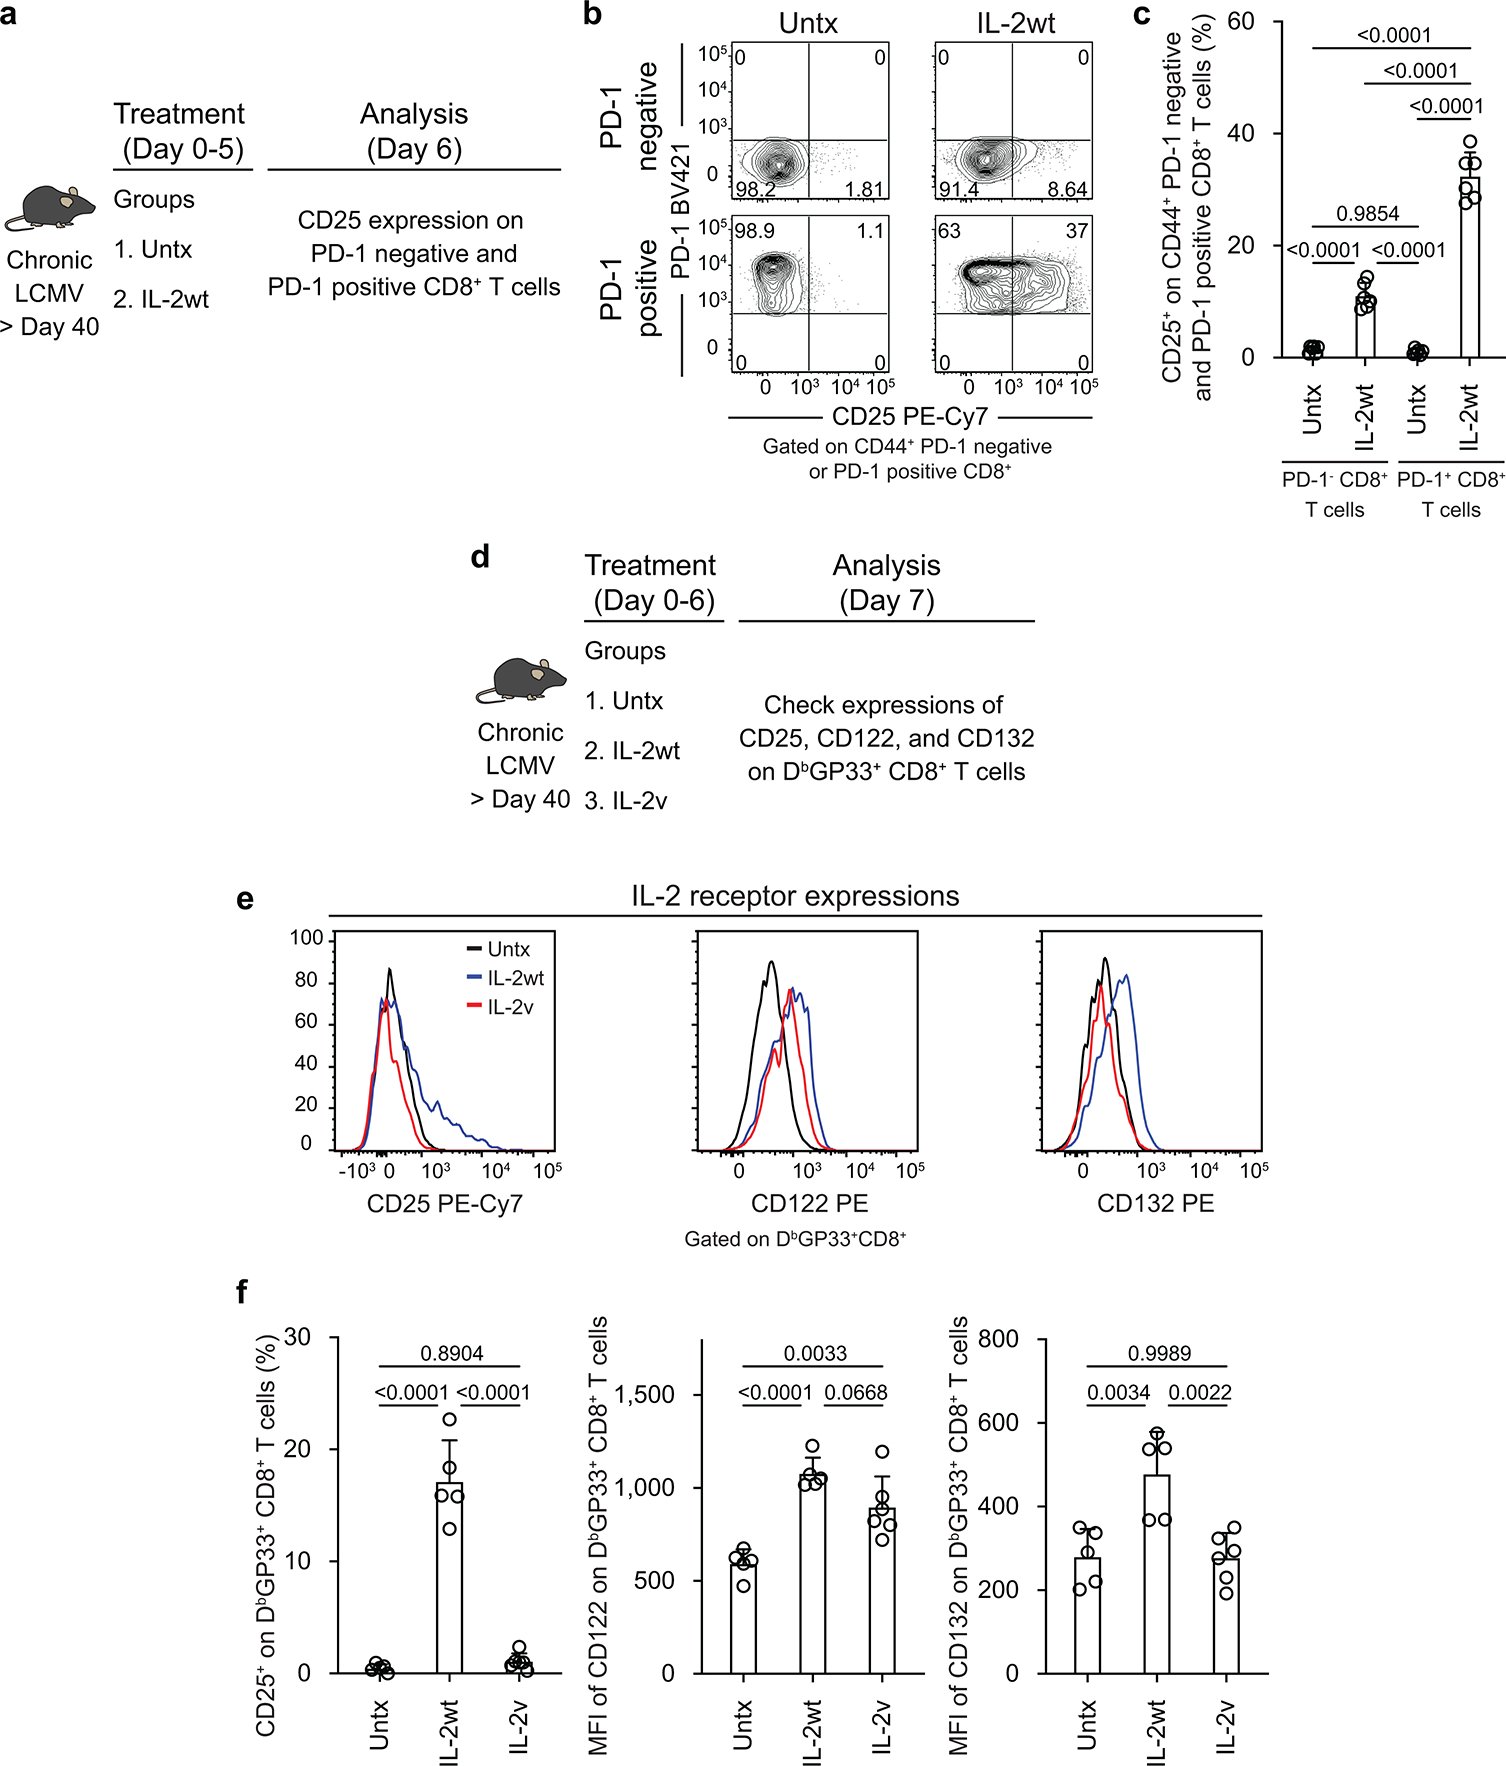
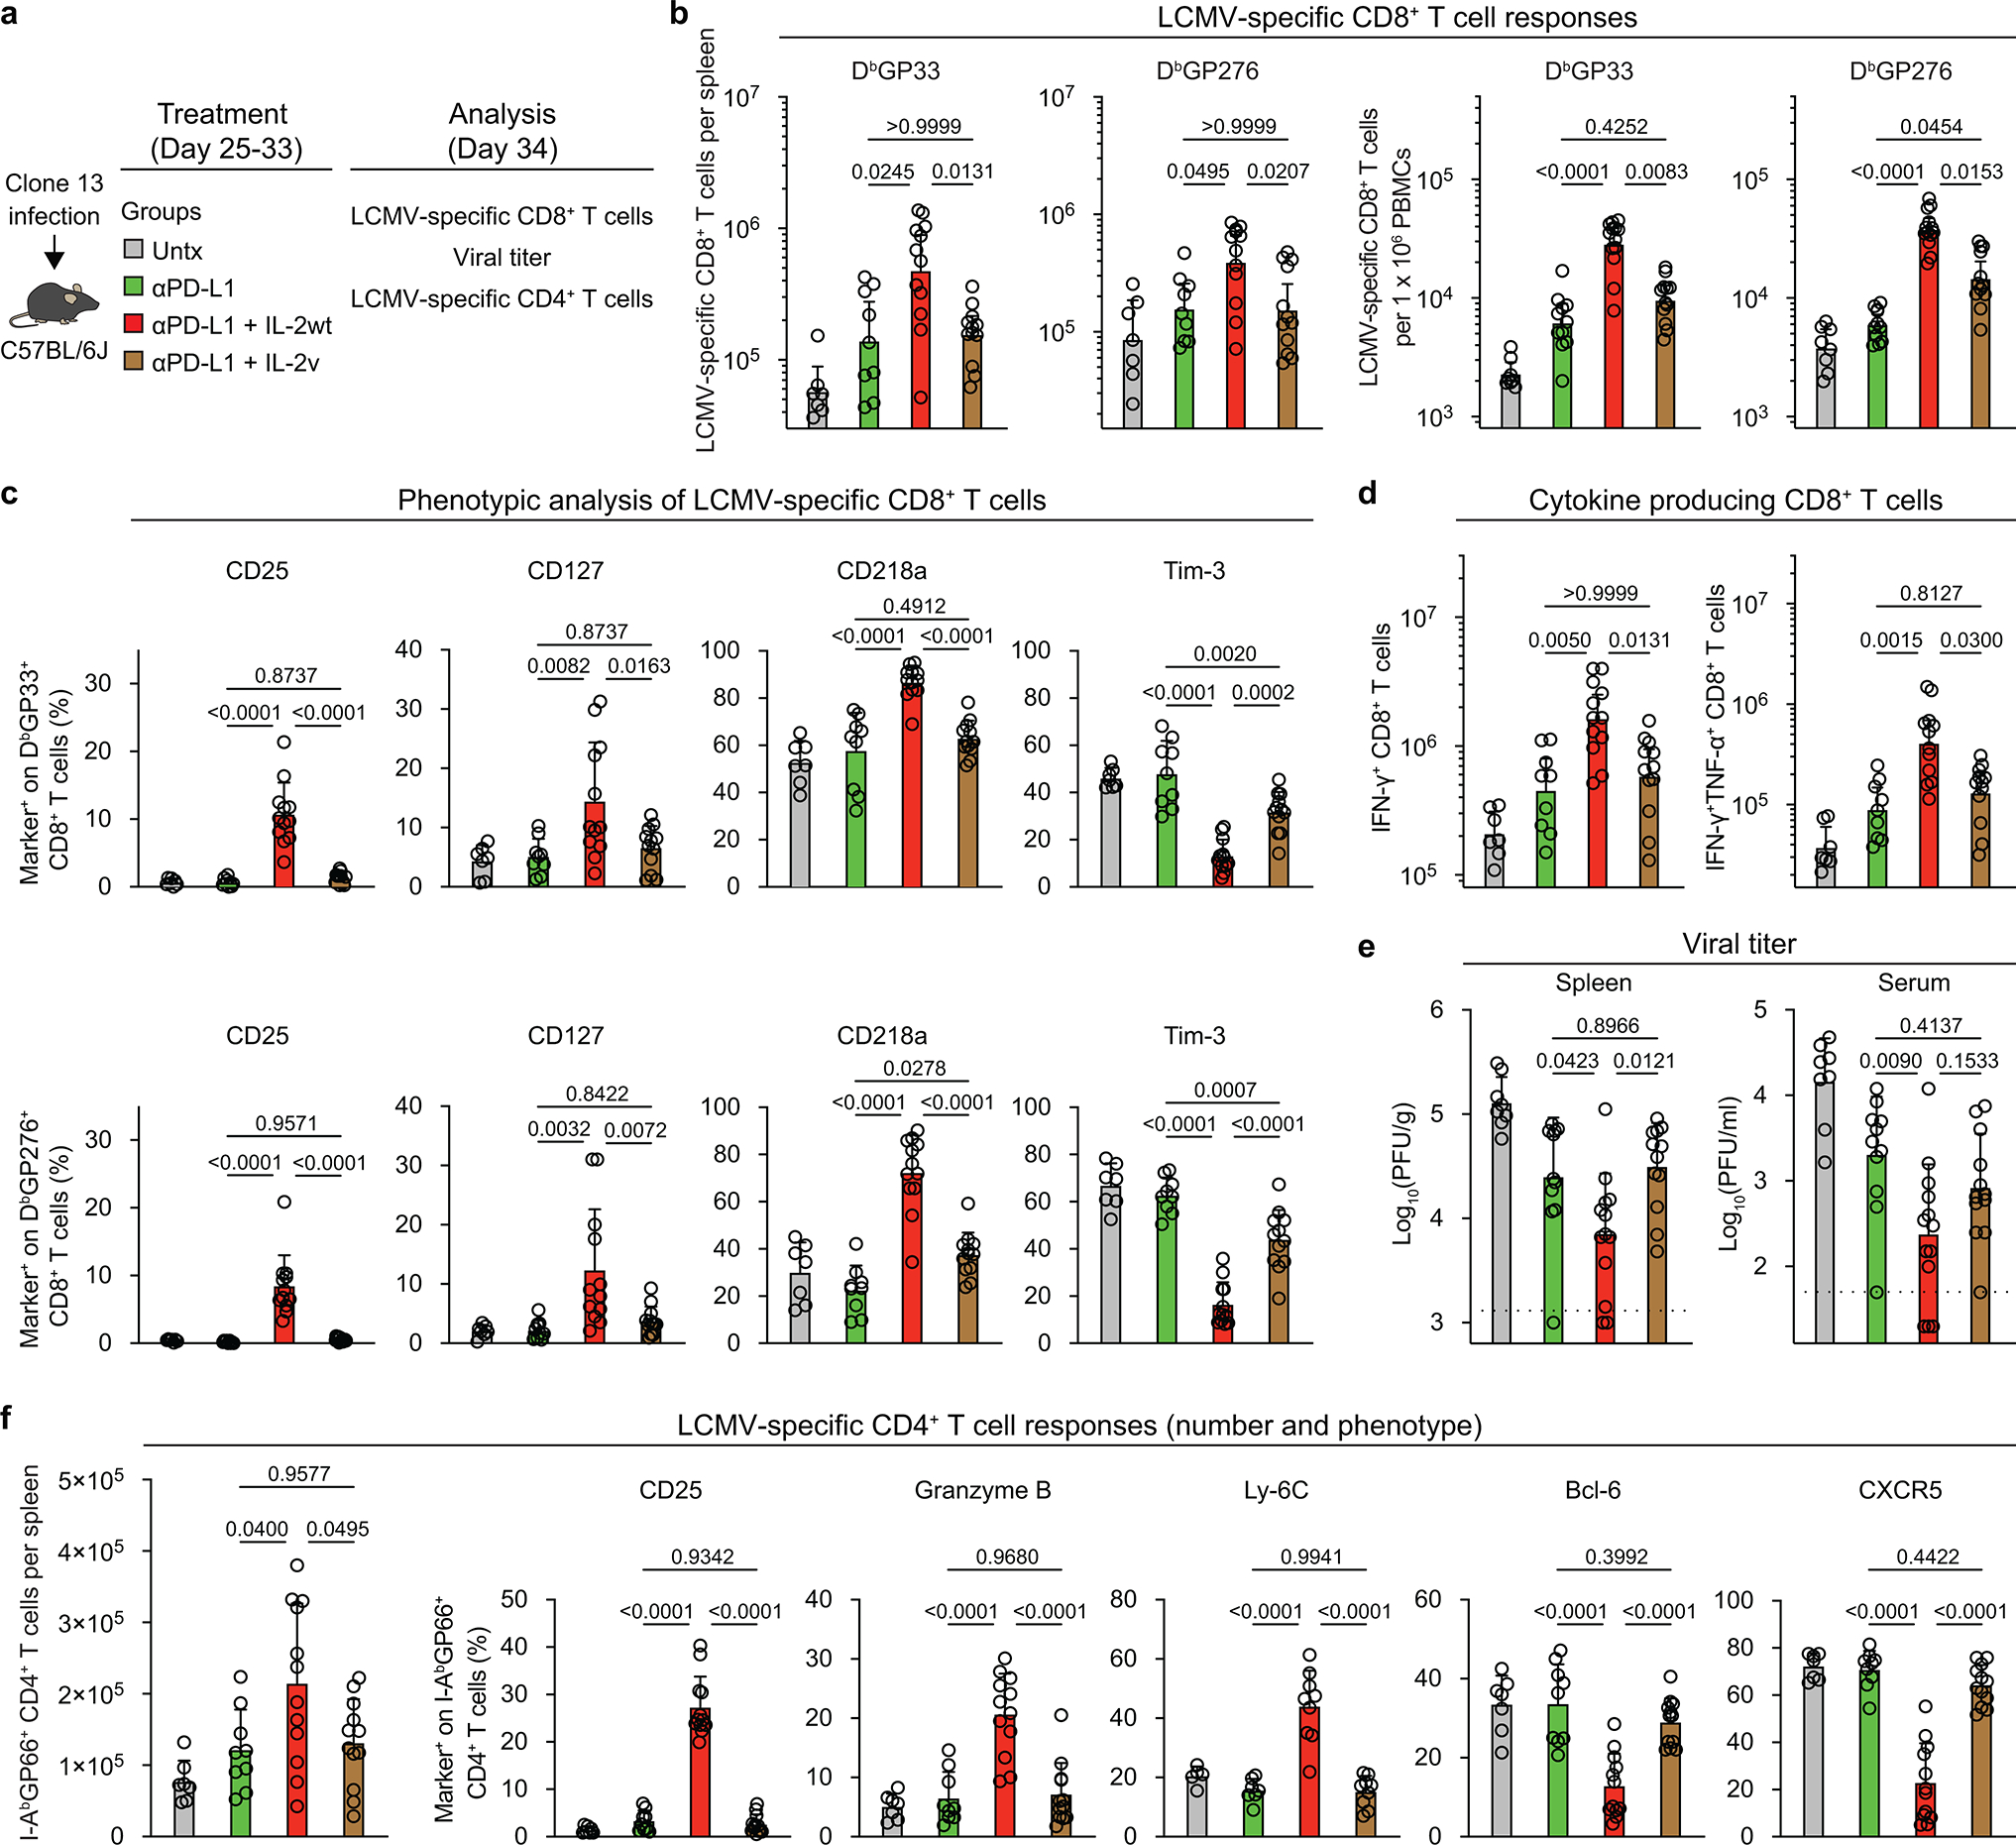
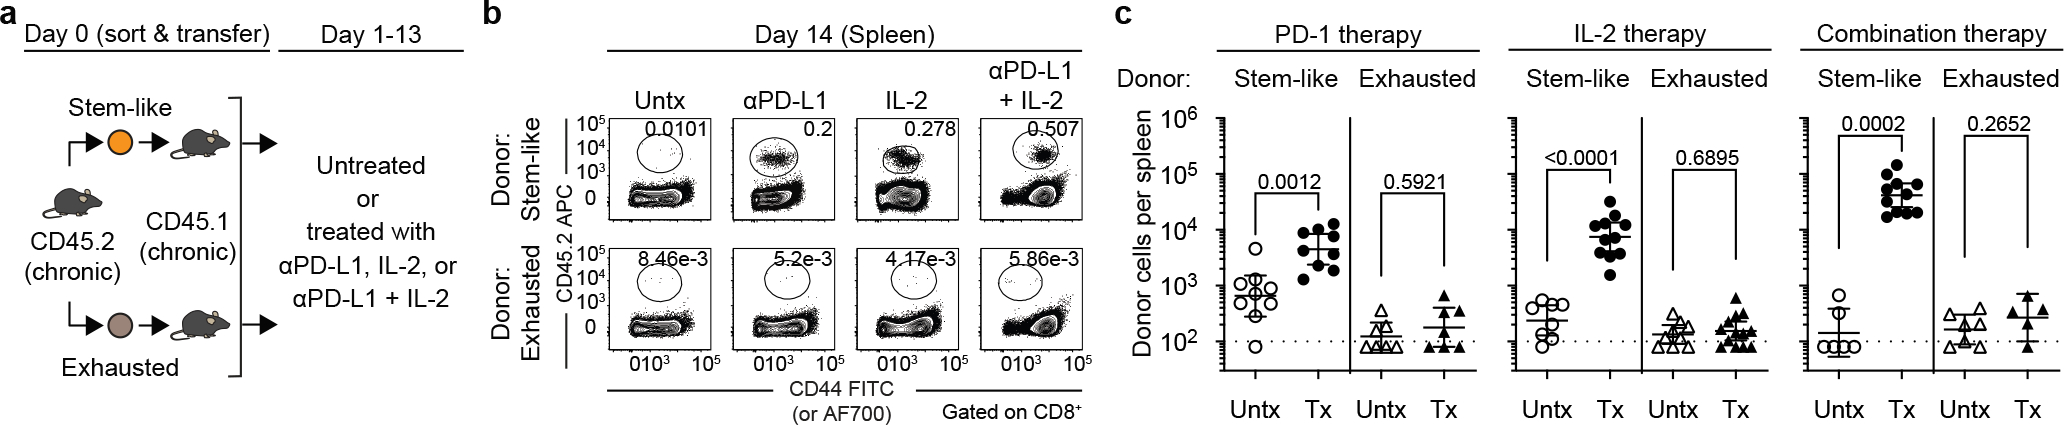
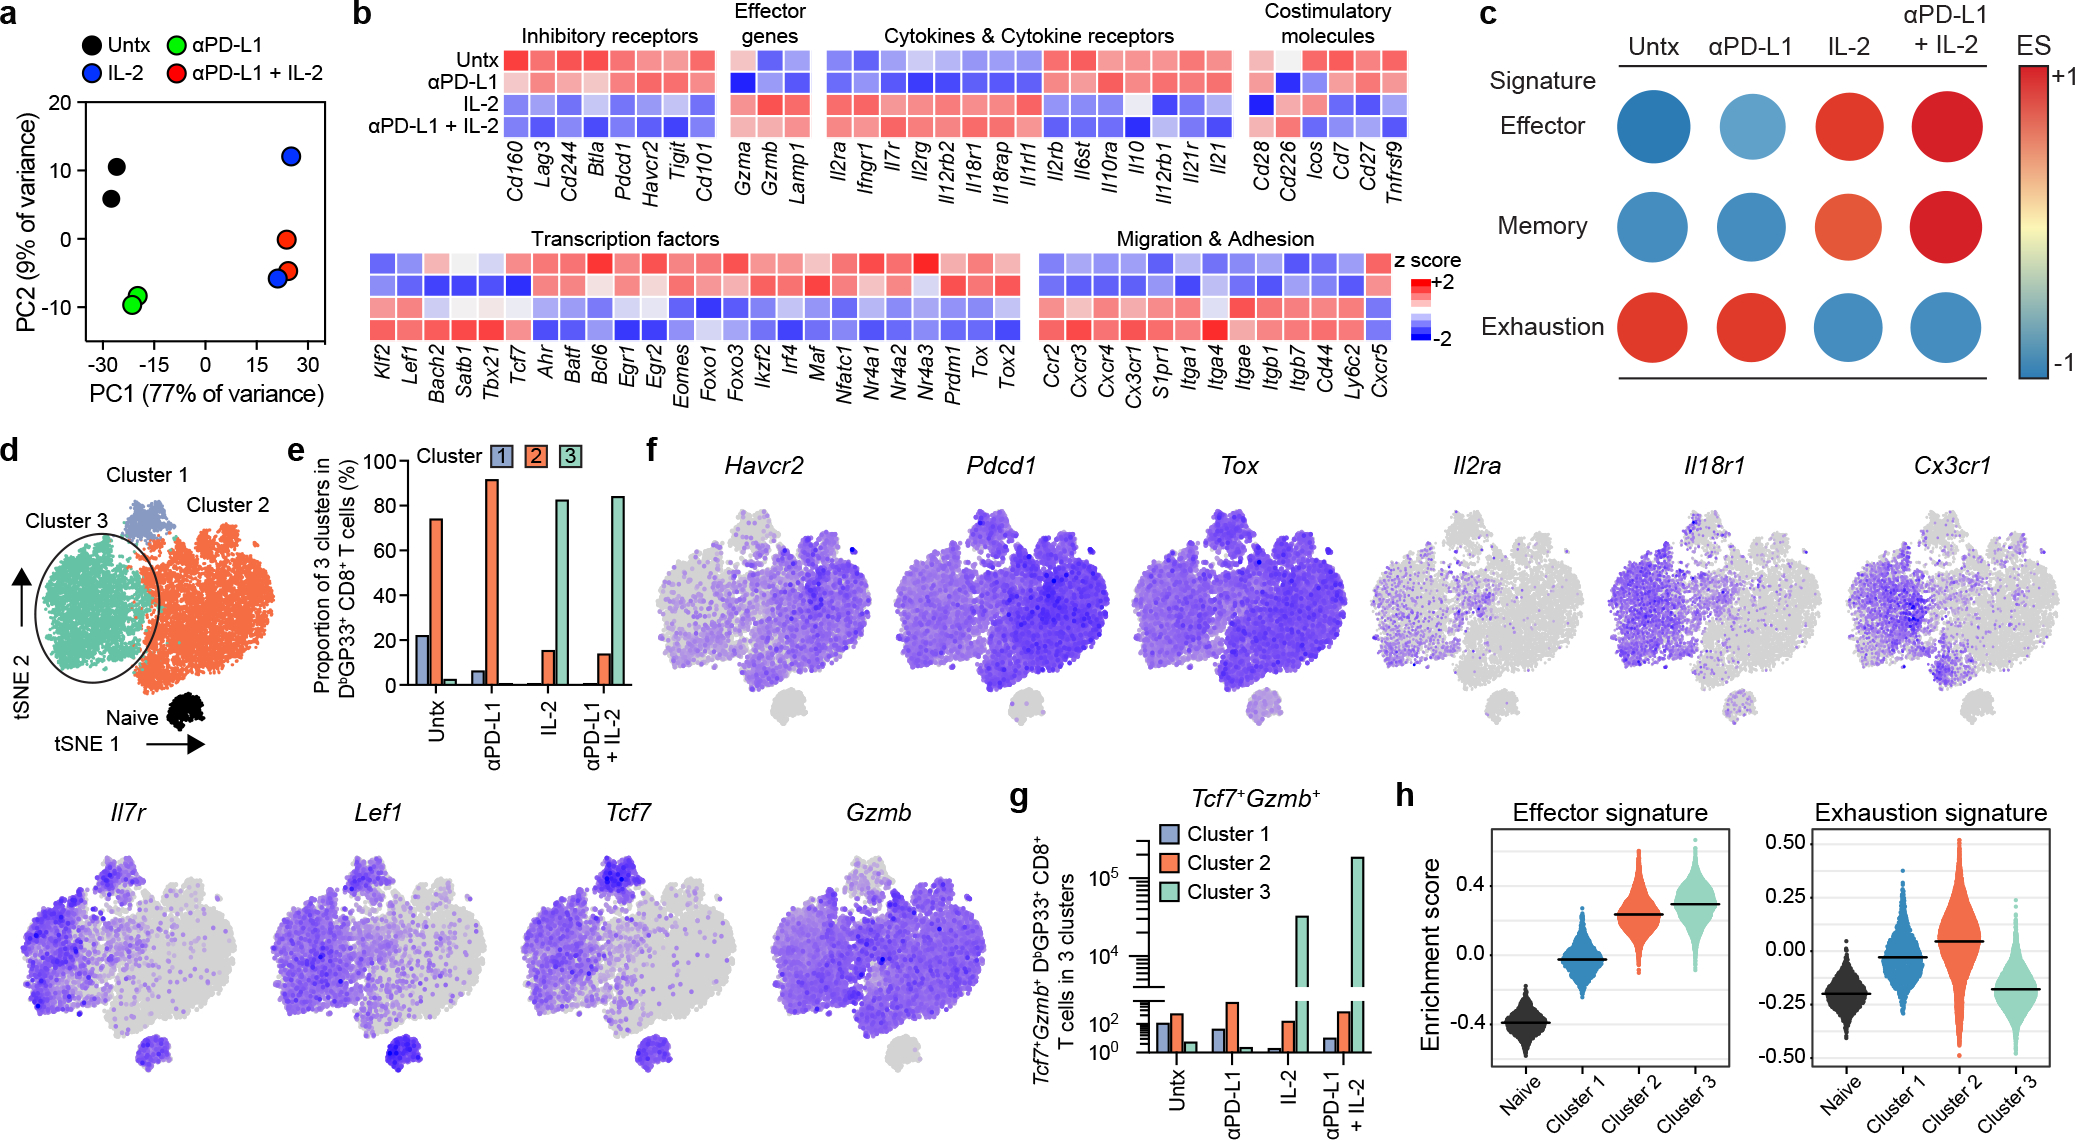
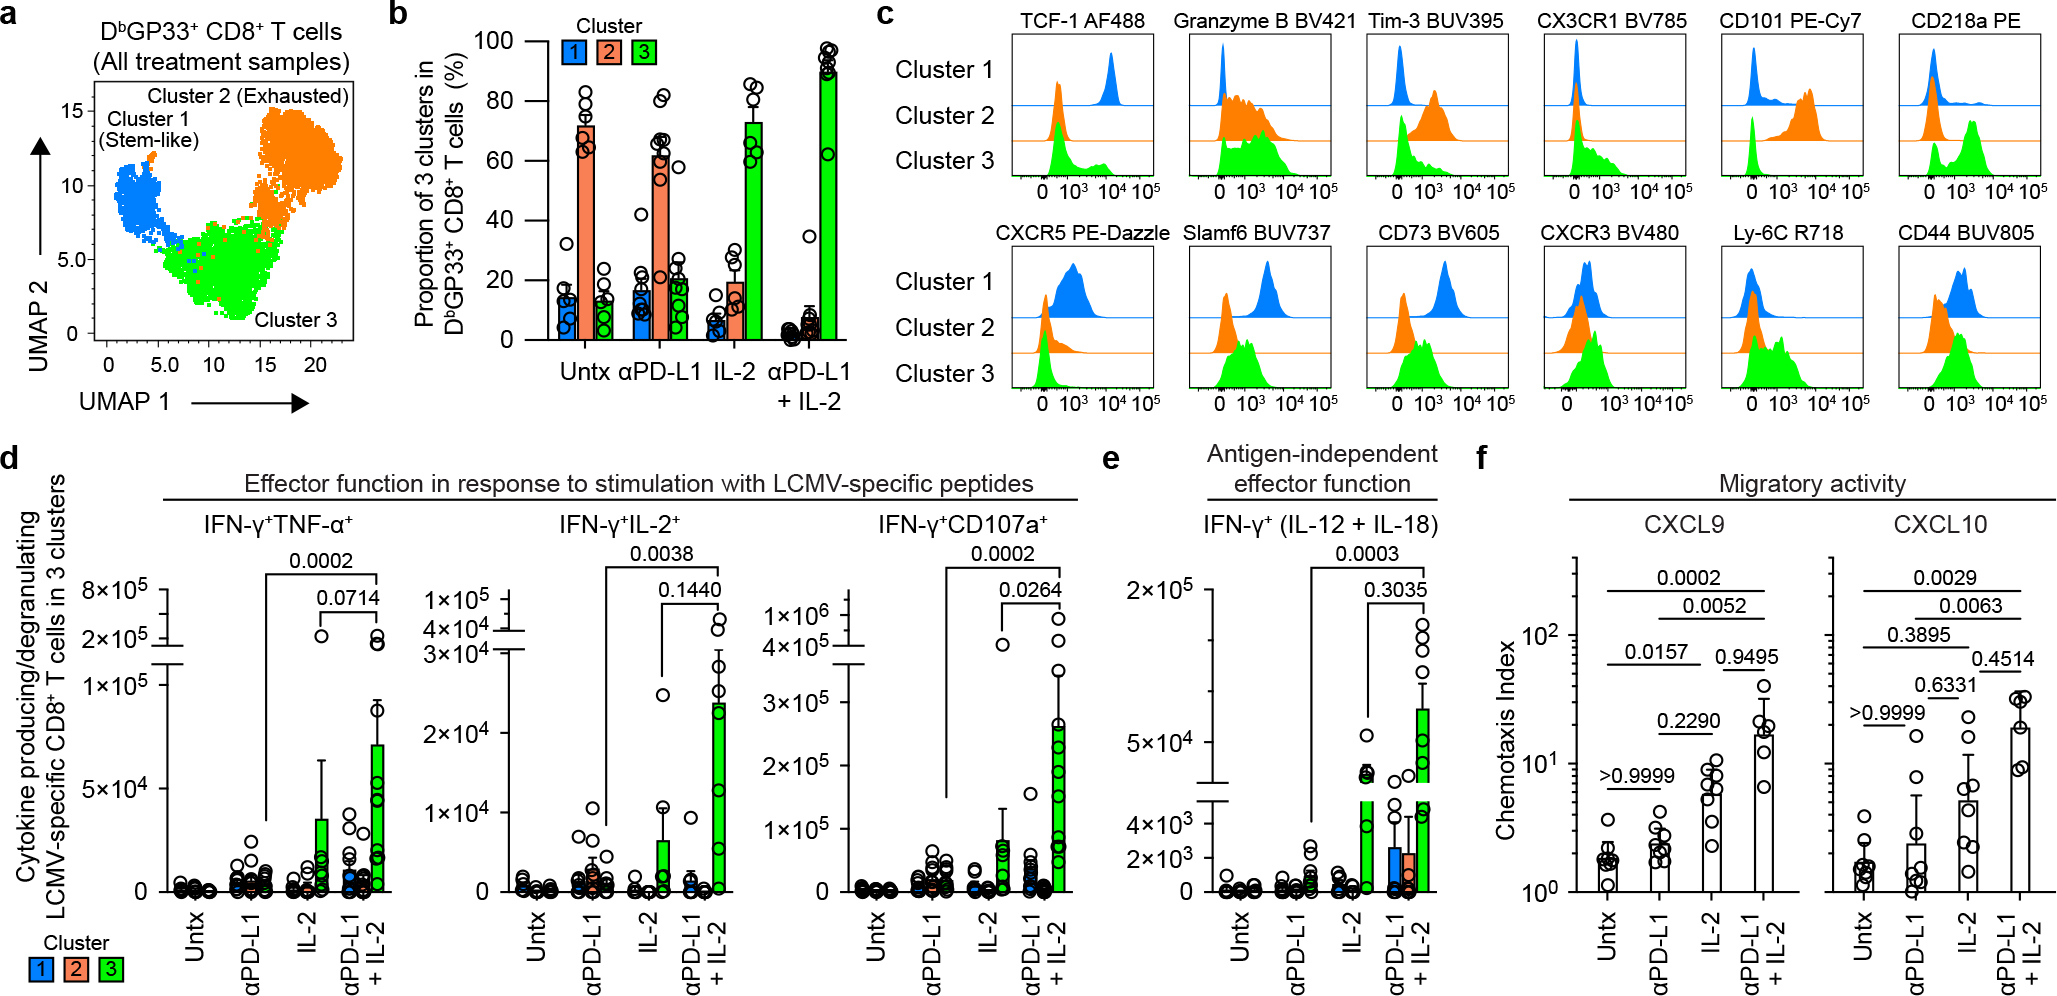
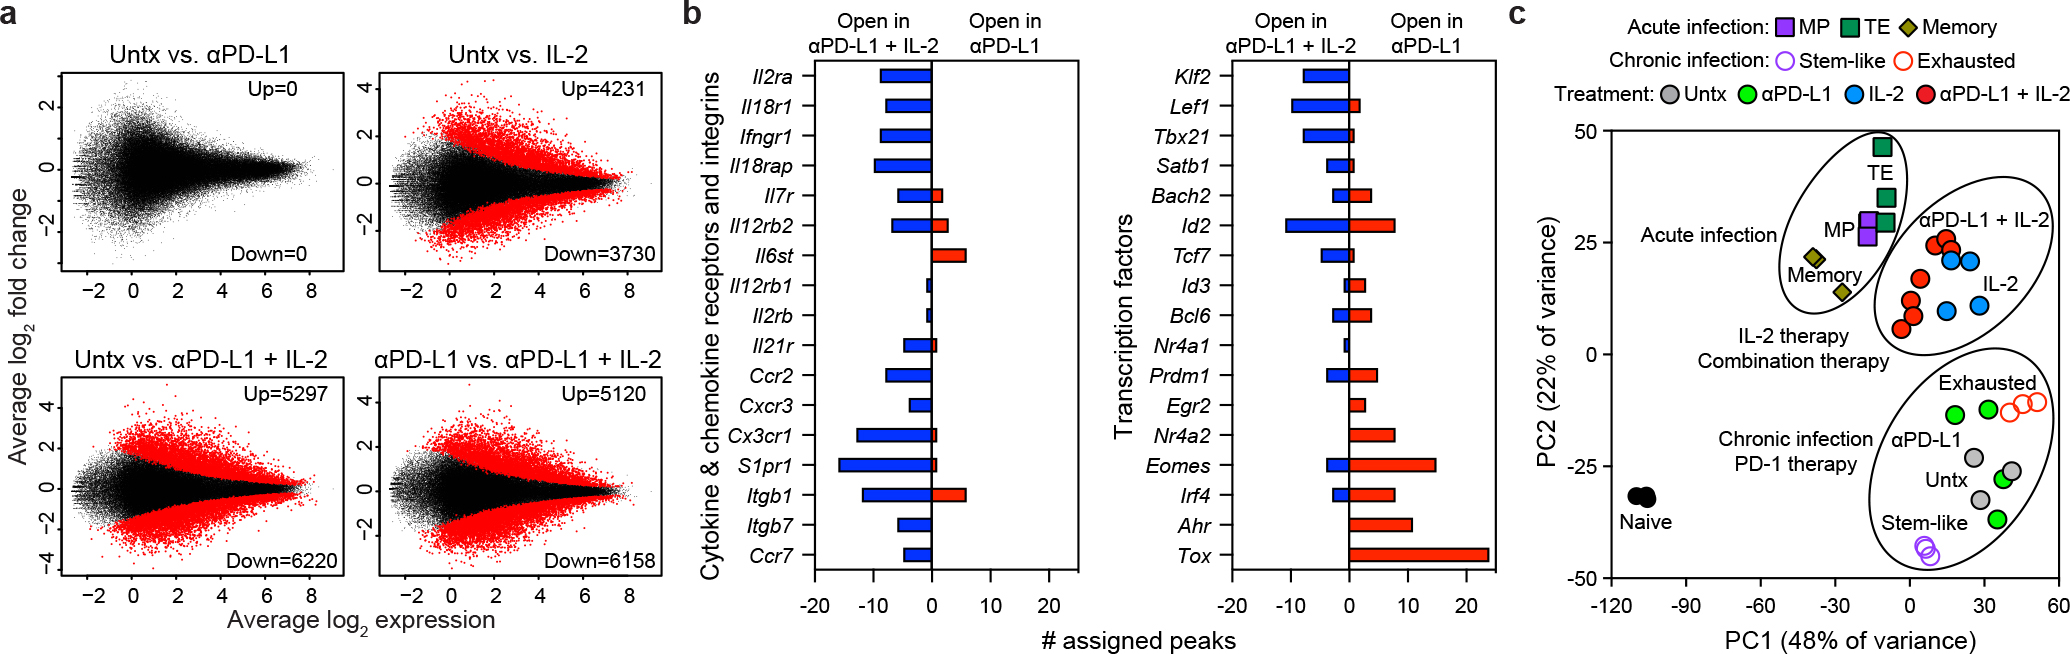
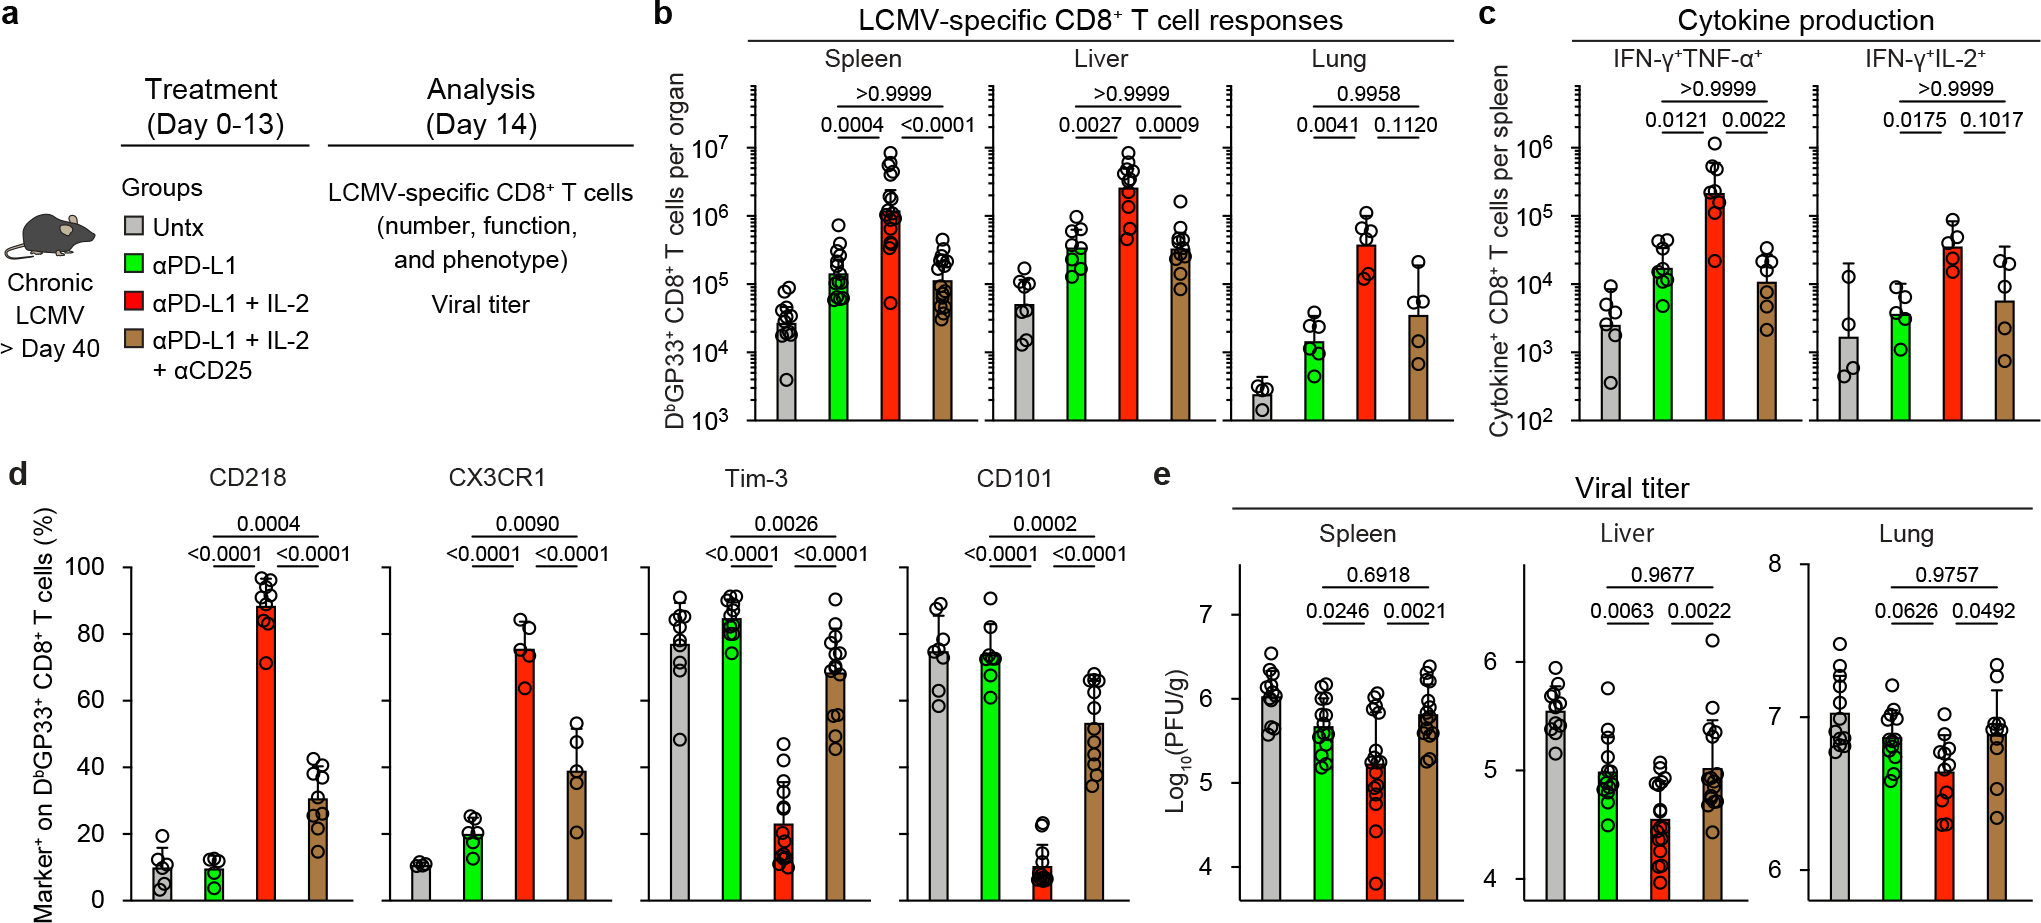
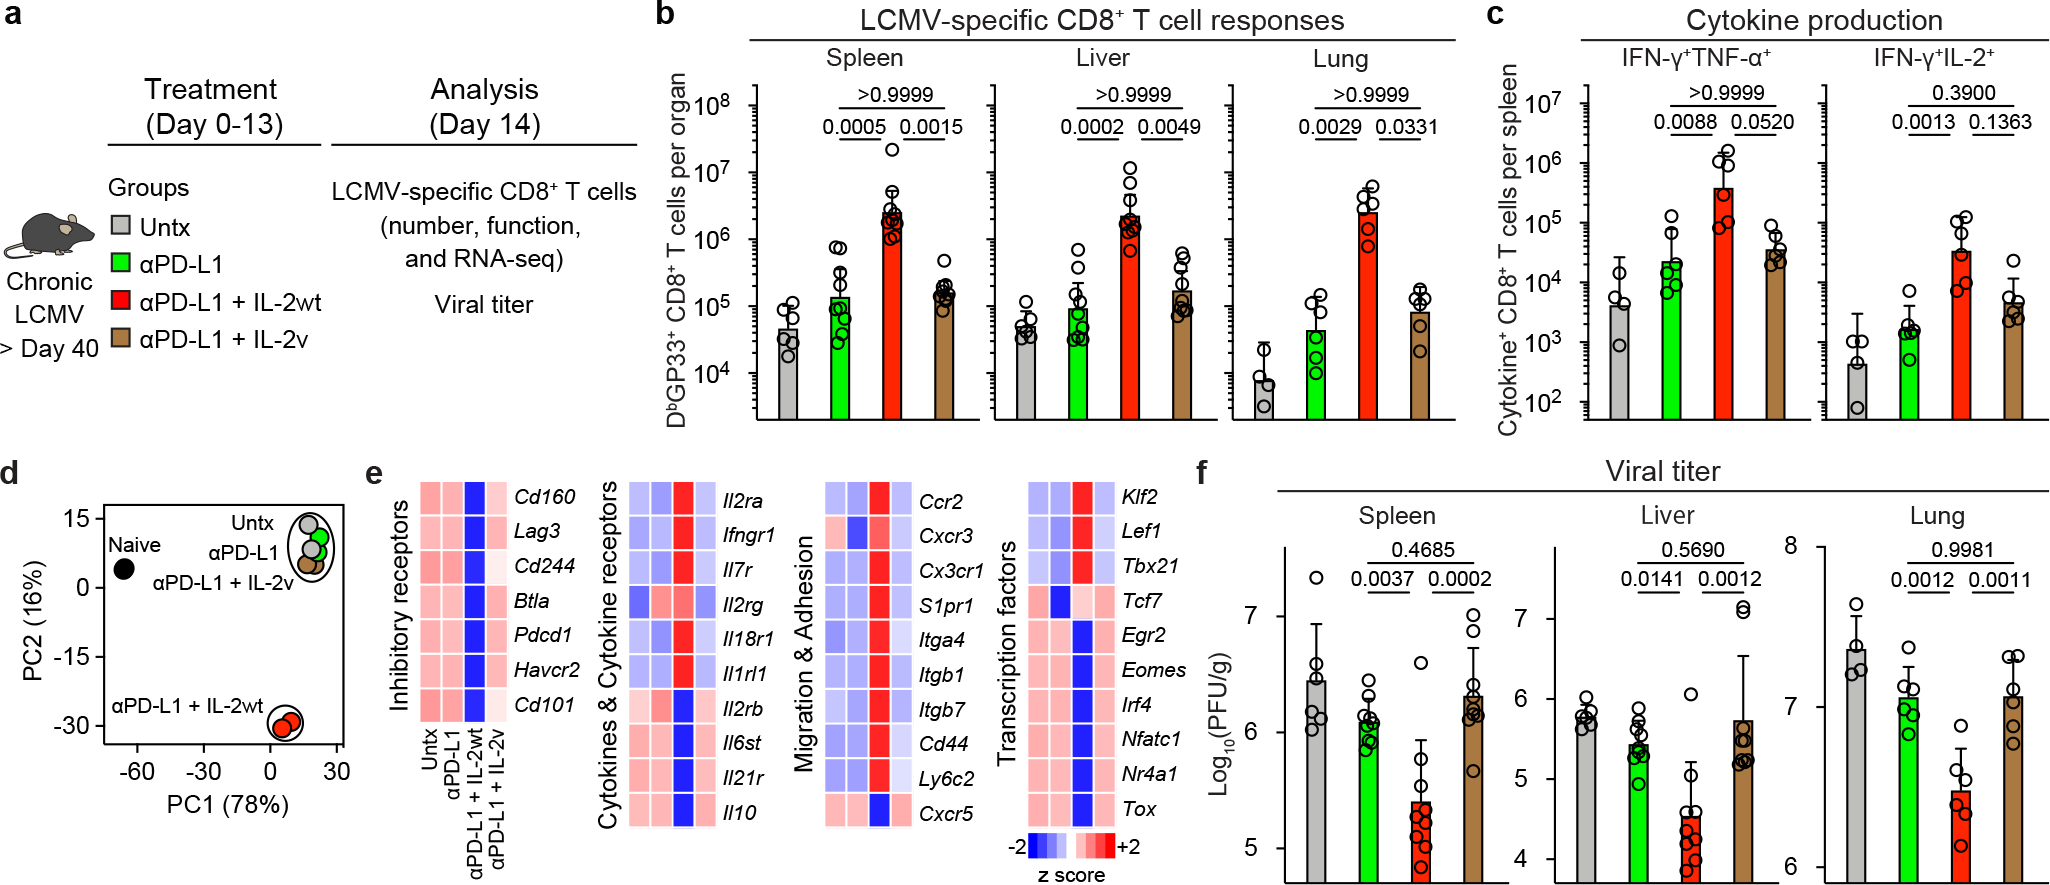
Combination therapy with PD-1 blockade and IL-2 is highly effective during chronic lymphocytic choriomeningitis virus infection1. Here we examine the underlying basis for this synergy. We show that PD-1 + IL-2 combination therapy, in contrast to PD-1 monotherapy, substantially changes the differentiation program of the PD-1+TCF1+ stem-like CD8+ T cells and results in the generation of transcriptionally and epigenetically distinct effector CD8+ T cells that resemble highly functional effector CD8+ T cells seen after an acute viral infection. The generation of these qualitatively superior CD8+ T cells that mediate viral control underlies the synergy between PD-1 and IL-2. Our results show that the PD-1+TCF1+ stem-like CD8+ T cells, also referred to as precursors of exhausted CD8+ T cells, are not fate-locked into the exhaustion program and their differentiation trajectory can be changed by IL-2 signals. These virus-specific effector CD8+ T cells emerging from the stem-like CD8+ T cells after combination therapy expressed increased levels of the high-affinity IL-2 trimeric (CD25-CD122-CD132) receptor. This was not seen after PD-1 blockade alone. Finally, we show that CD25 engagement with IL-2 has an important role in the observed synergy between IL-2 cytokine and PD-1 blockade. Either blocking CD25 with an antibody or using a mutated version of IL-2 that does not bind to CD25 but still binds to CD122 and CD132 almost completely abrogated the synergistic effects observed after PD-1 + IL-2 combination therapy. There is considerable interest in PD-1 + IL-2 combination therapy for patients with cancer2,3, and our fundamental studies defining the underlying mechanisms of how IL-2 synergizes with PD-1 blockade should inform these human translational studies.


Conflict of interest statement

Competing interests

R.A. has patents related to PD-1 pathway (8,652,465 and 9,457,080) licensed to Roche. A.H.S has patents and pending royalties from Roche and Novartis on intellectual property on the PD-1 pathway (patent 7,432,059 with royalties paid from Roche, Merck, Bristol Myers Squibb, EMD-Serono, Boehringer-Ingelheim, AstraZeneca, Leica, Mayo Clinic, Dako and Novartis; patent 7,722,868 with royalties paid from Roche, Merck, Bristol Myers Squibb, EMD-Serono, Boehringer-Ingelheim, AstraZeneca, Leica, Mayo Clinic, Dako and Novartis; patents 8,652,465 and 9,457,080 licensed to Roche; patents 9,683,048, 9,815,898, 9,845,356, 10,202,454 and 10,457,733 licensed to Novartis; and patents 9,580,684, 9,988,452 and 10,370,446 issued to none). G.J.F. has patents and pending royalties on the PD-1-PD-L1 pathway from Roche, Merck MSD, Bristol Myers Squibb, Merck KGaA, Boehringer-Ingelheim, AstraZeneca, Dako, Leica, Mayo Clinic and Novartis (see Supplementary Data 4). G.J.F. has served on advisory boards for Roche, Bristol Myers Squibb, Xios, Origimed, Triursus, iTeos, NextPoint, IgM, Jubilant, Trillium, GV20 and Geode. G.J.F. has equity in Nextpoint, Triursus, Xios, iTeos, IgM, GV20 and Geode. V.T., C.K. and P.U. are employed by Roche with stock options. C.K. and P.U have a patent application with Roche: WO2012107417. The other authors declare no competing interests.

Figures

Extended Data Fig. 1.
Extended Data Fig. 1.. PD-1 + IL-2 combination therapy synergistically expands functional LCMV-specific CD8+ T cells that mediate viral control during chronic infection.
a, Experimental setup for panels b-e. Mice chronically infected with LCMV were either left untreated, or treated with anti-PD-L1 antibody alone (200 μg i.p., every 3 days), IL-2 therapy alone (15,000 IU i.p., twice daily), or the combination therapy for 2 weeks. b, Numbers of DbGP33+ CD8+ T cells in the indicated tissues and blood (per 1 × 10⁶ PBMCs). c, d, Spleen cells were stimulated with pools of LCMV-specific peptides for 5 h and analyzed by intracellular staining of cytokines (c) and degranulation (d). e, Viral titre in the indicated tissues. f, Experimental setup for panels gi. LCMV chronically infected mice were either left untreated, or treated with combination therapy, or combination therapy plus anti-CD8 depleting antibody (200 μg i.p., every 3 days) for 2 weeks. g, Viral titre in the indicated tissues of the three groups of mice. h, i, Correlation between viral titre in the various tissues and the number of CD8+ T cells (h), or LCMV-specific (DbGP33+ and DbGP276+) CD8+ T cells (i). Results were pooled from 3–13 experiments (be) with n = 25–32 (spleen), n = 14–18 (liver), n = 7–8 (lung), and n = 20–33 (blood) (b), with n = 28–38 (IFNγ+), n = 28–38 (IFNγ+TNFα+), n = 16–23 (IFNγ+IL-2+), and n = 18–25 (CD107a+) (c), and with n = 16–19 (spleen), n = 12–15 (liver), and n = 13–14 (lung) (e) per group or pooled from 2–3 experiments with 2–4 mice per group in each experiment (g-i). Data are presented as geometric mean and 95% CI (bd), mean and SD (e, g), or linear regression line and Pearson correlation coefficient (two-tailed) (h, i) with p values. Statistical comparisons were performed using Kruskal-Wallis test with Dunn’s multiple comparison test (bd) or one-way ANOVA with Tukey’s multiple comparison test (e). Untx, untreated.
Extended Data Fig. 2.
Extended Data Fig. 2.. The proliferative response after PD-1 blockade, IL-2 therapy, and PD-1 + IL-2 combination therapy comes from the same population of PD-1+ TCF-1+ stem-like CD8+ T cells.
a, Gating strategy for sorting stem-like (PD-1+CXCR5+TIM3) and exhausted (PD-1+CXCR5TIM3+) CD8+ T-cell subsets isolated from spleens of CD45.2+ LCMV chronically infected mice. b-d, Summary data for the numbers of donor CD45.2+ CD8+ T cells after 2 weeks of PD-1 therapy, IL-2 therapy, and the combination therapy in liver (b), lungs (c), and blood (per 1 × 10⁶ PBMCs) (d) of the recipient mice. Results were pooled from 3–4 experiments with n = 7–9 (PD-1 therapy), n = 5–13 (IL-2 therapy), and n = 5–11 (PD-1 + IL-2 combination therapy) per group. Data are presented as geometric mean and 95% CI (bd) with p values. Dotted line indicates the limit of detection. Statistical comparisons were performed by using two-tailed unpaired Mann-Whitney test. AF, Alexa Fluor; EF, eFluor; Tx, treated; Untx, untreated.
Extended Data Fig. 3.
Extended Data Fig. 3.. Transcriptional profiling of LCMV-specific CD8+ T cells generated by PD-1 monotherapy, IL-2 treatment, and PD-1 + IL-2 combination therapy during chronic infection.
Mice chronically infected with LCMV were treated with PD-1 monotherapy, IL-2 alone, or combination therapy for 2 weeks. LCMV-specific DbGP33+ CD8+ T cells from spleens of each treatment group were sorted for RNA-seq (ad) and scRNA-seq (e-j). As a control, naive (CD44lo) CD8+ T cells were also sorted for scRNA-seq (e-j). a, MA plots for gene expression of DbGP33+ CD8+ T cells after the indicated treatments. bd, GSEA of DbGP33+ CD8+ T cells generated by the indicated treatments for effector signature (acute infection) (b), memory signature (acute infection) (c), and exhaustion signature (chronic infection) (d). e, The t-SNE projection of naive CD44lo CD8+ T cells and DbGP33+ CD8+ T cells in 4 treatment groups during chronic infection. Naive and four treatment samples were distributed and overlaid onto the four clusters. f, Numbers of cells in clusters 1, 2, and 3. g, Numbers of cells in cluster 1. Numbers of total DbGP33+ CD8+ T cells per spleen were estimated from geometric mean of Extended Data Fig. 1b (f, g). h, Normalized expression of several representative genes is shown within the 4 clusters i, Co-expression patterns of Tcf7 and Gzmb in cells of each cluster are shown. j, GSEA of DbGP33+ CD8+ T cells generated by the different treatments for effector signature (acute infection) and exhaustion signature (chronic infection). Enrichment score for the signature in four treatment samples are shown as violin plots with horizontal bars of mean. Results were pooled from 2 (ac) and 1–2 (ej) experiments with n = 2–18 mice per group in each experiment. ES, enrichment score; Untx, untreated.
Extended Data Fig. 4.
Extended Data Fig. 4.. Phenotypic and functional analysis of LCMV-specific CD8+ T cells generated by PD-1, IL-2, and combination therapy during chronic infection.
LCMV chronically infected mice were either left untreated, or treated with anti-PD-L1 antibody alone, IL-2 therapy alone, or the combination therapy for 2 weeks. a, Representative FACS plots for co-expression of TIM3 and various phenotypic markers on DbGP33+ CD8+ T cells in spleens. b, c, One million splenocytes were cultured with recombinant mouse IL-12 and IL-18 (20 ng ml−1 each) for 5 h, then GolgiPlug was added, followed by culturing for 1 hour. Note that no viral peptides were added to the culture. Cells were stained with surface markers including DbGP33-specific tetramer, fixed, and followed by intracellular staining of IFNγ. b, Representative FACS plots for co-staining of CD218a and IFNγ gated on DbGP33+ CD8+ T cells after the indicated treatments. c, Summary plots for the frequency of IFNγ+ cells in DbGP33+ CD8+ T cells. Results shown are representative flow plots from 2–7 experiments (a, b) or pooled from 7 experiments (c) with n = 2–5 per group in each experiment. Data are presented as mean and SD with p values (c). Statistical comparisons were performed using one-way ANOVA with Tukey’s multiple comparison test (c). AF, Alexa Fluor; EF, eFluor; Untx, untreated.
Extended Data Fig. 5.
Extended Data Fig. 5.. Identification of LCMV-specific CD8+ T cells generated after PD-1, IL-2, and combination therapy that produce cytokine after peptide stimulation.
LCMV chronically infected mice were either left untreated, or treated with anti-PD-L1 antibody alone, IL-2 therapy alone, or the combination therapy for 2 weeks. Spleen cells were stimulated with pools of LCMV-specific peptides for 5 h and analyzed by intracellular staining for cytokine production. a, Representative UMAP with FlowSOM overlay of DbGP33+ CD8+ T cells isolated from spleens after the indicated treatments shows the distribution of cells in three clusters. b, Summary data for numbers of IFNγ+ LCMV-specific CD8+ T cells in the defined 3 clusters in the different treatment groups is shown. Results were pooled from 4 experiments with 2–3 mice per group in each experiment. Data are presented as mean and SEM (b) with p values. Statistical comparisons were performed using Kruskal-Wallis test with Dunn’s multiple comparison test (d, e). Untx, untreated.
Extended Data Fig. 6.
Extended Data Fig. 6.. Chromatin accessibility profiling of LCMV-specific CD8+ T cells in acute and chronic infection and after PD-1 treatment, IL-2 or PD-1 + IL-2 combination therapy.
a, Gene annotations of differentially accessible distal regulatory regions in DbGP33+ CD8+ T cells of mice treated with anti-PD-L1 and PD-1 + IL-2 combination therapy. The number of differentially open gene regulatory regions for genes of functional importance in DbGP33+ CD8+ T cells after PD-1 monotherapy vs. PD-1 + IL-2 combination therapy is shown. b, Accessibility tracks for representative genes in LCMV-specific DbGP33+ CD8+ T cells generated by various treatments during chronic infection. Light blue lines beneath each panel indicate differentially accessible regions in DbGP33+ CD8+ T cells generated by PD-1 therapy versus PD-1 + IL-2 combination therapy. Red dotted lines highlight the regions indicated by the light blue lines. c, Heat map with 10 clusters generated by using k-means clustering of 16,758 DARs among DbGP33+ CD8+ T cells generated by the combination therapy. Then, naive CD8+ T cells and various LCMV-specific CD8+ T-cell subsets during acute and chronic infections were incorporated into the heat map. Results were pooled from 3 experiments of ATAC-seq with n = 12–18 for untreated mice or n = 1–3 for treatment samples per group in each experiment. ATAC-seq data for naive, acute (memory precursor (MP), terminal effector (TE), and memory), and chronic (stem-like and exhausted) was from our previous study. Untx, untreated.
Extended Data Fig. 7.
Extended Data Fig. 7.. Importance of PD-1/PD-L1 blockade at the target site in reducing viral load during chronic LCMV infection.
a, Experimental design. Mice chronically infected with LCMV were divided into two groups; one group was treated with IL-2 only for 13 days (IL-2 group), and the second group was given IL-2 for 10 days followed by 2 doses of anti-PD-L1 antibody on days 10 and 12 (IL-2 + late anti-PD-L1 group). Mice were then analyzed at day 14 for LCMV-specific CD8+ T-cell responses, viral titre, and liver immunopathlogy. b, Numbers of LCMV-specific (DbGP33+ and DbGP276+) CD8+ T cells. c, Viral titre in the indicated tissues. d-f, Immunopathological assessment. Serum levels of alanine aminotransferase (ALT) (d), liver pathology score (e), and number of TUNEL+ sinusoidal cells and hepatocytes (f). Results were pooled from 2–4 experiments with n = 2–5 per group in each experiment (bf). For serum ALT levels, serum samples were pooled from 2–3 mice. TUNEL staining was done on one of the representative experiments with n = 4 per group. Data are presented as geometric mean and 95% CI (b) or mean and SD (c-f) with p values. Statistical comparisons were performed using two-tailed unpaired Mann-Whitney test (b), or two-tailed unpaired t-test (cf). ALT, alanine aminotransferase. TUNEL, terminal deoxynucleotidyl transferase dUTP nick end labeling.
Extended Data Fig. 8.
Extended Data Fig. 8.. PD-1 + IL-2 combination therapy results in a more favorable CD8+ effector/CD4+ Treg ratio compared to IL-2 monotherapy.
Mice chronically infected with were either left untreated, or treated with anti-PD-L1 antibody alone, IL-2 therapy alone, or combination therapy. a, Numbers of Foxp3+ CD4+ regulatory T cells (Tregs) in the indicated tissues. b, Numbers of LCMV-specific (DbGP33+ and DbGP276+) CD8+ T cells. c, Ratio of LCMV-specific (DbGP33+ and DbGP276+) CD8+ T cells vs. Foxp3+ CD4+ T cells (CD8+ effector/CD4+ Treg ratio). d, Correlation between viral titre and CD8+ effector/CD4+ Treg ratio in the various tissues. Results were pooled from 5–8 experiments with n = 2–4 per group in each experiment. Data are presented as geometric mean and 95% CI (a, b), mean and SEM (c), or linear regression line and Pearson correlation coefficient (two-tailed) (d) with p values. Statistical comparisons were performed using Kruskal-Wallis test with Dunn’s multiple comparison test (ac). Untx, untreated.
Extended Data Fig. 9.
Extended Data Fig. 9.. PD-1+TCF-1+ stem-like CD8+ T cells proliferate and differentiate into effector CD8+ T cells expressing the high affinity trimeric (CD25, CD122, CD132) IL-2 receptor after PD-1 + IL-2 combination therapy.
a, Experimental setup for panels b-d. Stem-like (PD-1+CXCR5+TIM3) and exhausted (PD-1+CXCR5TIM3+) CD8+ T-cell subsets were sorted from the spleens of LCMV chronically infected CD45.2+ mice and each subset was transferred into infection-matched CD45.1+ recipient mice. Groups of these mice were then either left untreated, given anti-PD-L1 antibody, IL-2 therapy, or combination therapy for 2 weeks. CD25 expression on donor CD45.2+ CD8+ T cells was checked before and after the treatments. b, Representative histogram of CD25 expression on the chronic CD8+ T-cell subsets pre-transfer. Naive (CD44lo) CD8+ T cells are also shown as a negative control. c, d, Representative FACS plots of CD25 expression and summary data of frequency of CD25+ cells in donor CD45.2+ CD8+ T cells originating from stem-like or exhausted CD8+ T cells after the indicated treatments. e, Experimental setup for panels fo. LCMV chronically infected mice were treated with anti-PD-L1 antibody, IL-2 alone, or combination therapy. Mice were sacrificed on the indicated days and expression of CD25, CD122 and CD132 was examined on LCMV-specific CD8+ T cells in the spleen. f, Representative flow plots for the co-expression of CD25 and Ki-67 on DbGP33+ CD8+ T cells at day 0 or day 6 after treatment. g, j, m, Representative histograms showing the expression of CD25 (g), CD122 (j), and CD132 (m) on stem-like and exhausted LCMV-specific DbGP33+ subsets CD8+ T cells before starting the treatment of LCMV chronically infected mice. Naive cells are CD44lo CD8+ T cells present in the same host. h, k, n, Representative histograms showing the expression of CD25 (h), CD122 (k), and CD132 (n) on DbGP33+ CD8+ T cells at days 0–6 after starting the indicated treatment. i, l, o, Summary box plots for the frequency of CD25+ cells (i), MFI of CD122 (l) and MFI of CD132 (o) on DbGP33+ CD8+ T cells after the indicated treatments. Results were pooled from 2–5 experiments with at least 4 mice per group (ao). Data are presented as mean and SD (d) or the box (25th to 75th percentiles), the whiskers (min to max), and the line (the median) (i, l, o) with p values. Statistical comparisons were performed using one-way ANOVA with Tukey’s multiple comparison test. Untx, untreated.
Extended Data Fig. 10.
Extended Data Fig. 10.. IL-2(V) does not synergize with PD-1 blockade during chronic LCMV infection.
LCMV chronically infected mice were left untreated, or treated with anti-PD-L1 antibody, anti-PD-L1 plus IL-2 wild-type (IL-2(WT)), or anti-PD-L1 plus IL-2(V) (modified IL-2 with abolished CD25 binding) for 2 weeks. a, Numbers of DbGP276+ CD8+ T cells in the indicated tissues of the four groups of mice. b, Numbers of DbGP33+ and DbGP276+ CD8+ T cells in blood (per 1× 10⁶ PBMCs) in the four groups. c, Numbers of IFNγ+ CD8+ T cells in the different groups. Spleen cells were stimulated with pools of LCMV-specific peptides for 5 h and analyzed by intracellular cytokine staining. d, Summary data for the expression of various phenotypic markers on DbGP33+ and DbGP276+ CD8+ T cells after the different treatments. Results were pooled from 2–3 experiments with 2–3 mice per group in each experiment. Data are presented as geometric mean and 95% CI (ac) or mean and SD (d) with p values. Statistical comparisons were performed using Kruskal-Wallis test with Dunn’s multiple comparison test (a-c) or one-way ANOVA with Tukey’s multiple comparison test (d). Untx, untreated.
Extended Data Fig. 11.
Extended Data Fig. 11.. IL-2(V) is biologically active in vivo but PD-1 + IL-2(V) combination therapy preferentially expands non-LCMV-specific PD-1 negative CD8+ T cells.
a, Experimental setup for b-c. Mice chronically infected with LCMV were left untreated, or treated with IL-2 wild-type (IL-2(WT)) or IL-2 variant (IL-2(V), modified IL-2 with abolished CD25 binding) for 2 weeks. Expansion of CD8+ T cells was examined in the spleen and blood in the three groups of mice. b, Numbers of CD8+ T cells. c, Numbers of CD44+ CD8+ T cells. d, Experimental setup for panels eg. Chronically infected mice were untreated, or treated with anti-PD-L1 antibody, anti-PD-L1 plus IL-2(WT), or anti-PD-L1 plus IL-2(V) for 2 weeks. Expansion of PD-1 negative and PD-1 positive CD8+ T cells was examined in the spleen and blood in the four groups of mice. e, Representative FACS plots for CD44 and PD-1 expression on CD8+ T cells in the spleen and blood after the various treatments. f, Numbers of CD44+ PD-1 negative CD8+ T cells in the spleen and blood. g, Numbers of CD44+ PD-1 positive CD8+ T cells in the spleen and blood (per 1×10⁶ PBMCs) of the four groups. Results were pooled from 3 experiments with at least 6 mice per group. Data are presented as geometric mean and 95% CI (b, c, f, g) with p values. Red box highlights preferential expansion of PD-1 negative CD8+ T cells by combination therapy with anti-PD-L1 and IL-2(V) whereas combination therapy with anti-PD-L1 and IL-2(WT) expands PD-1 positive CD8+ T cells. Statistical comparisons were performed using Kruskal-Wallis test with Dunn’s multiple comparison test. Untx, untreated.
Extended Data Fig. 12.
Extended Data Fig. 12.. Effect of IL-2(WT) versus IL-2(V) on LCMV-specific CD8+ T cells during chronic infection.
a, Experimental design for data in panels b and c. Mice chronically infected with LCMV (> 40 days post infection) were untreated or treated with IL-2 wild-type (IL-2(WT)) for 5 days, and CD25 expression was checked on PD-1negative and PD-1+ CD8+ T cells in the spleen. b, Representative FACS plots of CD25 expression. c, Summary plots of CD25 expression after IL-2(WT) and IL-2(V) treatments. d, Experimental design for data in panels e and f. Mice chronically infected with LCMV were untreated, treated with IL-2(WT) or treated with IL-2 variant (IL-2(V)) for 6 days. Expression of IL-2 receptors (CD25, CD122, and CD132) on LCMV-specific CD8+ T cells in the spleen were examined. e, f, Representative histograms (e) and summary plots (f) of expression of IL-2 receptors on DbGP33+ CD8+ T cells after indicated treatments. Results were pooled from 2 experiments with 2–3 mice per group in each experiment. Data are presented as mean and SD (c, f) with p values. Statistical comparisons were performed using one-way ANOVA with Tukey’s multiple comparison test. Untx, untreated.
Extended Data Fig. 13.
Extended Data Fig. 13.. Comparing the effects of IL-2 wt cytokine versus IL-2 variant cytokine in PD-1 combination therapy in the LCMV chronic infection model with CD4+ T-cell help.
a, Experimental design. Mice infected with LCMV clone 13 (day 25 post-infection) were left untreated, or treated with anti-PD-L1 antibody, anti-PD-L1 plus IL-2 wild-type (IL-2(WT)), or anti-PD-L1 plus IL-2(V). b, Numbers of LCMV-specific DbGP33+ CD8+ T cells in the indicated tissues after the various treatments. c, Summary data for the expression of phenotypic markers on DbGP33+ or DbGP276+ CD8+ T cells in the spleen after the different treatments. d, Numbers of IFNγ+, and IFNγ+TNFα+ LCMV-specific CD8+ T cells in the four groups. Spleen cells were stimulated with pools of LCMV-specific peptides for 5 h and analyzed by intracellular staining of cytokines e, Viral titre in spleen and serum in the four groups of mice. Dotted line indicates the limit of detection. Results were pooled from 3–4 experiments with 2–5 mice per group in each experiment. Data are presented as geometric mean and 95% CI (b, d) or mean and SD (c, e, f) with p values. Statistical comparisons were performed using Kruskal-Wallis test with Dunn’s multiple comparison test (b, d, f (number of LCMV-specific CD4+ T cells)) or one-way ANOVA with Tukey’s multiple comparison test (c, e, f (phenotype of LCMV-specific CD4+ T cells)). Untx, untreated.
Fig. 1.
Fig. 1.. PD-1+ TCF-1+ stem-like CD8+ T cells provide the proliferative burst after PD-1 blockade, IL-2 therapy, and PD-1 + IL-2 combination therapy during chronic LCMV infection.
a, The stem-like (PD-1+CXCR5+TIM3) and terminally differentiated exhausted (PD-1+CXCR5TIM3+) CD8+ T-cell subsets were sorted from the spleens of LCMV chronically infected CD45.2+ mice and each subset was transferred into infection-matched CD45.1+ recipient mice. Groups of these mice were then either left untreated, or given anti-PD-L1 antibodies, IL-2 therapy or the combination therapy for 2 weeks. b, Representative FACS plots showing the frequency of donor CD45.2+ CD8+ T cells in the recipient mice two weeks after the various treatments. c, The numbers of donor CD45.2+ CD8+ T cells after 2 weeks of the indicated treatments. Results were pooled from 3–4 experiments with n = 7–9 (PD-1 therapy), n = 8–13 (IL-2 therapy), and n = 5–11 (combination therapy) per group. Data are geometric mean ± 95% confidence interval (CI). Dotted line indicates the limit of detection of donor CD45.2+ CD8+ T cells. P values are shown; statistical comparisons were performed using two-tailed unpaired Mann-Whitney test. AF, Alexa Fluor; Tx, treated; Untx, untreated.
Fig. 2.
Fig. 2.. Distinct transcriptional signature of virus-specific CD8+ T cells after PD-1 + IL-2 combination therapy compared to PD-1 monotherapy during chronic LCMV infection.
ah, Mice chronically infected with LCMV were treated with PD-1 monotherapy, IL-2 alone, or combination therapy for 2 weeks. LCMV-specific DbGP33+ CD8+ T cells from spleens of each treatment group were sorted for RNA-seq (a-c) and scRNA-seq (d-h) analysis. As a control, naive CD44low CD8+ T cells were also sorted for scRNA-seq (d-h). a, PCA plot of DbGP33+ CD8+ T cells after the indicated treatments. b, The mean relative expressions of specific genes. c, GSEA of DbGP33+ CD8+ T cells generated by the indicated treatments for effector and memory signatures (acute infection), and exhaustion signature (chronic infection). The colour and size of the circles represent the enrichment score (ES) for each signature. d, t-SNE projections of naive CD44low CD8+ T cells and DbGP33+ CD8+ T cells generated by the various treatments. Four clusters (one for naive and three for treatment samples) were defined and are indicated by different colours. The new cluster (cluster 3) generated after combination therapy or IL-2 treatment is highlighted by the black circle. e, The proportions of three clusters in DbGP33+ CD8+ T cells in each treatment group. f, Normalized expression of several representative genes is shown within the four clusters. g, Numbers of Tcf7+Gzmb+ DbGP33+ CD8+ T cells that are present in clusters 1, 2, and 3 after the various treatments. h, GSEA of DbGP33+ CD8+ T cells in each of three clusters for effector signature (acute infection) and exhaustion signature (chronic infection). Enrichment score for the signature in each cluster is shown as violin plots; the horizontal bars show the mean. Results were pooled from 2 (ac) and 1–2 (dh) experiments with n =2–18 mice per group in each experiment.
Fig. 3.
Fig. 3.. Phenotypic and functional characterization of LCMV-specific CD8+ T cells generated by PD-1 and IL-2 monotherapy and the combination therapy during chronic infection.
LCMV chronically infected mice were either untreated or treated with PD-1 therapy, IL-2 treatment or the combination therapy for 2 weeks. a, Representative UMAP with FlowSOM overlay showing three clusters of concatenated DbGP33+ CD8+ T cells isolated from spleens after the four treatments. b, The proportions of three clusters of DbGP33+ CD8+ T cells in the different groups of mice. c, Representative histograms of various phenotypic markers expressed by DbGP33+ CD8+ T cells in the three clusters. d, Effector function in response to stimulation with LCMV-specific peptides. Spleen cells were stimulated with pools of LCMV-specific peptides for 5 h and analyzed by intracellular staining for cytokine production and degranulation. Summary data for numbers of PD-1+ LCMV-specific CD8+ T cells producing IFNγ and TNFα, IFNγ and IL-2, and IFNγ plus degranulation (CD107a+) are shown as a function of the three clusters in the different treatment groups. e, Antigen-independent effector function. Spleen cells were stimulated with IL-12 and IL-18 (20 ng ml−1 each) for 6h without any viral peptides. Cells were then stained with surface markers including DbGP33-specific tetramer, fixed, and followed by intracellular staining of IFNγ. Summary data for numbers of LCMV-specific CD8+ T cells producing IFNγ+ in an antigen-independent manner as a function of the three clusters in the various treatment groups. f, Chemotaxis index for CXCL9 and CXCL10. Sorted PD-1+ CD8+ T cells obtained from pooled spleens of chronically infected mice treated for 2 weeks by each treatment were tested for chemotaxis to CXCL9 and CXCL10. For ae, the results were pooled from 2–4 experiments with 1–8 mice per group in each experiment. Data are mean ± s.d. (b), mean ± s.e.m (d and e), or geometric mean ± 95% CI (f). P values are shown; statistical comparisons were performed using Kruskal-Wallis test with Dunn’s multiple comparison test (df).
Fig. 4.
Fig. 4.. Epigenetic signatures of LCMV-specific CD8+ T cells generated by IL-2 or PD-1 + IL-2 combination therapy are distinct from that by PD-1 monotherapy during chronic infection.
a, MA plots for differentially accessible regions (DARs) in LCMV-specific DbGP33+ CD8+ T cells examined by ATAC-seq after PD-1, IL-2 and PD-1 + IL-2 combination therapy. Down, downregulated (closed); up, upregulated (open). b, Gene annotations of differentially accessible distal regulatory regions in DbGP33+ CD8+ T cells of mice treated with anti-PD-L1 and PD-1 + IL-2 combination therapy. The number of differentially open gene regulatory regions for genes of functional importance in DbGP33+ CD8+ T cells after PD-1 monotherapy vs. PD-1 + IL-2 combination therapy is shown. c, PCA plot of ATAC-seq analysis for naive CD8+ T cells and the various LCMV-specific CD8+ T-cell subsets generated during acute and chronic infection, and the DbGP33+ CD8+ T cells generated after PD-1 monotherapy, IL-2 treatment or the combination therapy. The results were pooled from three experiments of ATAC-seq experiments with n = 12–18 for untreated mice or n = 1–3 for treatment samples per group in each experiment. The ATAC-seq data for naive, acute (memory precursor (MP), terminal effector (TE), and memory), and chronic (stem-like and exhausted) was from our previous study.
Fig. 5.
Fig. 5.. CD25 blockade abrogates the synergy between IL-2 and PD-1 blockade.
a, Chronically infected mice were left untreated, or were treated with anti-PD-L1 antibodies, or combination therapy with anti-PD-L1 plus IL-2 for two weeks. One additional group was given the combination therapy plus a blocking anti-CD25 (PC61-N297Q) antibody for 2 weeks. The LCMV-specific CD8+ T-cell response and viral titre were analyzed on day 14. The colour key in a applies to be. b, LCMV-specific CD8+ T cell responses. The numbers of DbGP33+ CD8+ T cells in the indicated tissues for all four groups of mice are shown. c, The numbers of IFNγ+, IFNγ+TNFα+, and IFNγ+IL-2+ CD8+ T cells in the different groups of mice. Spleen cells were stimulated with pools of LCMV-specific peptides for 5 h and analyzed by intracellular cytokine staining. d, The phenotype of DbGP33+ CD8+ T cells from the indicated treatment group. e, Viral titre in the indicated tissues in the four groups of mice. The results were pooled from 2–6 experiments with at least 4 mice per group. Data are geometric mean ± 95% CI (b and c) or mean ± s.d. (d and e). P values are shown; statistical comparisons were performed using Kruskal-Wallis test with Dunn’s multiple comparison test (b and c) or one-way ANOVA with Tukey’s multiple comparison test (d and e).
Fig. 6.
Fig. 6.. CD25 engagement by therapeutic IL-2 is crucial for the efficacy of PD-1 + IL-2 combination therapy.
a, LCMV chronically infected mice (> 40 days after infection) were left untreated, or were treated with anti-PD-L1 antibodies, anti-PD-L1 plus IL-2 (WT), or anti-PD-L1 plus IL-2(V) (modified IL-2 with abolished CD25 binding) for 2 weeks. The colour key in a applies to bd and f. b, LCMV-specific CD8+ T cell responses. The numbers of LCMV-specific DbGP33+ CD8+ T cells in the indicated tissues after the various treatments are shown. c, The numbers of IFNγ+TNFα+ and IFNγ+IL-2+ LCMV-specific CD8+ T cells in the four groups. Spleen cells were stimulated with pools of LCMV-specific peptides for 5 h and analyzed by intracellular cytokine staining. d, e, LCMV-specific DbGP33+ CD8+ T cells were sorted from spleens of LCMV chronically infected mice after various treatments and analyzed using RNA-seq. Naive CD44low CD8+ T cells from uninfected mice are also included in the analysis. d, PCA plot for naive (CD44low) and DbGP33+ CD8+ T cells generated by the different treatments. e, The mean relative expression of key specific genes in DbGP33+ CD8+ T cells generated after the various treatments. f, The viral titre in the indicated tissues in the four groups of mice. The results were pooled from 2–3 experiments with 2–3 mice per group in each experiment. Data are geometric mean ± 95% CI (b and c) or mean ± s.d. (f). P values are shown; statistical comparisons were performed using Kruskal-Wallis test with Dunn’s multiple comparison test (b and c) or one-way ANOVA with Tukey’s multiple comparison test (f).

Comment in

References

    1. West EE et al. PD-L1 blockade synergizes with IL-2 therapy in reinvigorating exhausted T cells. J Clin Invest 123, 2604–2615, doi:10.1172/JCI67008 (2013). - DOI - PMC - PubMed
    1. Pol JG, Caudana P, Paillet J, Piaggio E & Kroemer G Effects of interleukin-2 in immunostimulation and immunosuppression. J Exp Med 217, e20191247, doi:10.1084/jem.20191247 (2019). - DOI - PMC - PubMed
    1. Overwijk WW, Tagliaferri MA & Zalevsky J Engineering IL-2 to Give New Life to T Cell Immunotherapy. Annu Rev Med 72, 281–311, doi:10.1146/annurev-med-073118-011031 (2021). - DOI - PubMed
    1. Hashimoto M et al. CD8 T Cell Exhaustion in Chronic Infection and Cancer: Opportunities for Interventions. Annu Rev Med 69, 301–318, doi:10.1146/annurev-med-012017-043208 (2018). - DOI - PubMed
    1. McLane LM, Abdel-Hakeem MS & Wherry EJ CD8 T Cell Exhaustion During Chronic Viral Infection and Cancer. Annu Rev Immunol 37, 457–495, doi:10.1146/annurev-immunol-041015-055318 (2019). - DOI - PubMed

Publication types

MeSH terms

Substances