. 2022 Oct;610(7930):128-134.
doi: 10.1038/s41586-022-05270-3. Epub 2022 Sep 28.

State-dependent pupil dilation rapidly shifts visual feature selectivity

Affiliations

State-dependent pupil dilation rapidly shifts visual feature selectivity

Katrin Franke et al. Nature. 2022 Oct.

Abstract

To increase computational flexibility, the processing of sensory inputs changes with behavioural context. In the visual system, active behavioural states characterized by motor activity and pupil dilation1,2 enhance sensory responses, but typically leave the preferred stimuli of neurons unchanged2-9. Here we find that behavioural state also modulates stimulus selectivity in the mouse visual cortex in the context of coloured natural scenes. Using population imaging in behaving mice, pharmacology and deep neural network modelling, we identified a rapid shift in colour selectivity towards ultraviolet stimuli during an active behavioural state. This was exclusively caused by state-dependent pupil dilation, which resulted in a dynamic switch from rod to cone photoreceptors, thereby extending their role beyond night and day vision. The change in tuning facilitated the decoding of ethological stimuli, such as aerial predators against the twilight sky10. For decades, studies in neuroscience and cognitive science have used pupil dilation as an indirect measure of brain state. Our data suggest that, in addition, state-dependent pupil dilation itself tunes visual representations to behavioural demands by differentially recruiting rods and cones on fast timescales.


Conflict of interest statement

Competing interests: The authors declare no competing interests.

Figures

Extended Data Figure 1.
Extended Data Figure 1.. Selection of colored naturalistic scenes and pupil changes with monitor intensity.
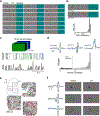
a, Mean intensity in 8-bit pixel space of green and blue channel of randomly sampled ImageNet images (light gray; n=6.000) and selected images (dark gray; n=6.000). Images were selected such that the distribution of mean intensities of blue and green image channels were not significantly different. Selected images can be downloaded from the online repository (see Data Availability in Methods section). b, Distribution of correlation and mean squared error (MSE) across green and blue image channels. To increase chromatic content, only images with MSE > 85 were selected for visual stimulation. c, Mean screen intensity (top) and pupil size changes (bottom) for n=50 trials. Dotted lines in the bottom indicate 5th and 95th percentile, respectively. d, Screen-intensity triggered pupil traces (top) for n=3 scans performed in different animals. Vertical dotted line indicates time point of screen intensity increase. Bottom shows mean change in pupil size (black; s.d. shading in gray) upon increase in screen intensity. Compared to pupil dilation induced by the behavioral state, the changes in monitor intensity over time only elicited minor changes in pupil size.
Extended Data Figure 2.
Extended Data Figure 2.. Model performance and descriptive analysis of behavior.
a, Response reliability plotted versus test correlation (left) and correlation to average (right) for data shown in Fig. 2 (n=1.759 cells, n=3 scans, n=1 mouse). b, Mean Poisson loss (lower is better) for different models trained on the dataset from (a). The default model is used for all analysis, while models 1–3 are shown for comparison. Dotted line marks mean Poisson loss of default model. The default model had significantly lower Poisson loss values compared to all three alternative models (Wilcoxon signed rank test (two-sided), n=1,759: p<10−288 (model 1), 10−200 (model 2), 10−18 (model 3)). Error bars show 95% confidence interval. c, Mean response reliability, test correlation and correlation to average across neurons (error bars: s.d. across neurons; n=478 to n=1,160 neurons per recording) for n=10 models, with control and drug condition indicated below. d, Pupil size and locomotion speed trace of example animal, with active trials indicated by red dots. Trials were considered active if pupil size > 60th percentile and/or locomotion speed >90th percentile. Plots on the right show mean pupil size across trials versus mean locomotion speed across trials. Dotted lines indicate 60th and 90th percentile of pupil size and locomotion speed, respectively. e, Example frames of eye camera for a quiet and active behavioral period for control and dilated condition. For the dilated condition, the eye was often squinted during quiet periods. f, Same as (e), but for control and constricted condition. Right plots show pupil size versus locomotion speed of trials used for model training for control and constricted condition.
Extended Data Figure 3.
Extended Data Figure 3.. Spatial and temporal color opponency of mouse V1 neurons.
a, MEIs of 21 exemplary neurons illustrate structural similarity across color channels. b, Distribution of correlation across color channels for dataset shown in Fig. 2. MEIs on top show example cells with relatively low correlation across color channels. c, Schematic illustrating paradigm of 10 Hz full-field binary white noise stimulus and corresponding response of exemplary neuron. d, Temporal kernels estimated from responses to full-field noise stimulus from (c) of three exemplary neurons and distribution of kernel correlations (n=924 neurons, n=1 scan, n=1 mouse; scan 1 from (e)). Dotted line indicates correlation threshold of −0.25 – cells with a kernel correlation lower than this threshold were considered color-opponent. A fraction of neurons (<5%) exhibited color-opponent temporal receptive fields (see also [70]) in response to this full-field binary noise stimulus – in line with recent retinal work [60]. e, Neurons recorded in 3 consecutive scans at different positions within V1, color-coded based on color-opponency (red: opponent). f, Temporal kernels in response to full-field colored noise stimulus of three exemplary neurons (left) and MEIs of the same neurons. Neurons were anatomically matched across recordings by alignment to the same 3D stack. This indicates that color-opponency of mouse V1 neurons depends on stimulus condition, similar to neurons in mouse dLGN [71], which might be due to e.g. differences in activation of the neuron’s surround or static versus dynamic stimuli.
Extended Data Figure 4.
Extended Data Figure 4.. Model recovers color opponency and color preference of simulated neurons.
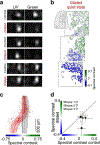
a, We simulated neurons with Gabor receptive fields (RFs) of varying size, orientation, spectral contrast and color-opponency (correlation across color channels). Then, responses of simulated neurons with Gabor RFs were generated by multiplication of the RFs with the natural images also used during experiments. Corresponding responses were passed through a non-linearity and a poisson process before model training. Model predictions and optimized MEIs closely matched the simulated responses and Gabor RFs, respectively. b, Gabor RFs and corresponding MEIs of four example neurons, some of them with color-opponent RFs and MEIs. c, Spectral contrast of Gabor RFs plotted versus spectral contrast of computed MEIs. The model faithfully recovered the simulated neurons’ color preference. Only extreme color preferences were slightly underestimated by our model, which is likely due to correlations across color channels of natural scenes. This also suggests that it is unlikely that the low number of color-opponent MEIs (Extended Data Fig. 3) is due to an artifact of modelling. d, Correlation of the MEI with the ground truth gabor RF.
Extended Data Figure 5.
Extended Data Figure 5.. MEI structure is consistent across quiet and active states.
a, MEIs optimized for a quiet (top row of each sub-panel) and active (bottom row) behavioral state of 18 example neurons illustrate structural similarity of MEIs across states. b, MEIs of two exemplary neurons with low correlation across behavioral states. c, Distribution of MEI correlation across states (n=1,759 neurons, n=3 scans, n=1 mouse). d, MEI activation for incongruent behavioral state (n=1,759 neurons, n=3 scans, n=1 mouse). Gray: Model activation of MEI optimized for a quiet state presented to the model for active state relative to model activation of MEI optimized and presented for active state (activation=1). Red: Model activation of MEI optimized for active state presented to the model for quiet state relative to model activation of MEI optimized and presented for quiet state (activation=1). This suggests that MEIs optimized for different behavioral states lead to similar activations in the model and thus share similar tuning properties for the majority of neurons.
Extended Data Figure 6.
Extended Data Figure 6.. Behavioral modulation of color tuning of mouse V1 neurons - additional data.
a, MEIs optimized for quiet and active state of exemplary neuron and corresponding color tuning curves. b, Neurons recorded in posterior V1 color coded based on spectral contrast of their quiet state MEI (top) and distribution of spectral contrast along posterior-anterior axis of V1 in an additional example animal. Black line corresponds to binned average (n=10 bins), with s.d. shading in gray. c, Like (b), but for active state. d, Mean of color tuning curves of neurons from (b, c), aligned with respect to peak position of quiet state tuning curves. Shading: s.d. across neurons from this scan. Top shows higher model activation for active state tuning curves, in line with gain modulation of visual responses. Bottom shows peak-normalized tuning curves, illustrating (i) a shift towards lower spectral contrast values for the peak response, (ii) lower activation relative to peak for green-biased stimuli for an active state and (iii) stronger activation relative to peak for UV-biased stimuli for an active state. This suggests that during an active state, the increase in UV-sensitivity is accompanied by a decrease in green-sensitivity. e, Density plot of model activation in response to MEIs optimized for a quiet versus an active behavioral state, for n=6,770 neurons from n=7 mice. f, Mean of peak-normalized color tuning curves of quiet (black) and active state (red), aligned with respect to peak position of quiet state tuning curves for n=3 scans from n=3 mice. Shading: s.d. across neurons.
Extended Data Figure 7.
Extended Data Figure 7.. Behavioral shift of color preference of mouse V1 neurons in the context of a colored sparse noise paradigm.
a, Activity of n=50 exemplary V1 neurons in response to UV and green On and Off dots (10° visual angle) flashed for 0.2 seconds and simultaneously recorded locomotion speed and pupil size. Horizontal dashed lines indicate thresholds for quiet (black; <50th percentile of pupil size) and active trials (red, >75th percentile of pupil size). We adjusted the definition of quiet and active state compared to our in-silico analysis to ensure a sufficient number of trials in each state despite the shorter recording time (25 minutes for sparse noise versus 120 minutes for naturalistic images). Shading below in red and gray highlights trials above or below these thresholds. Bottom images show single stimulus frames. b, Spike-triggered average (STA) of 4 example neurons estimated from quiet and active trials, separated by posterior and anterior recording position. STAs estimated based on On and Off stimuli were combined to yield one STA per cell and pupil size. c, Neurons recorded in three consecutive experiments along the posterior-anterior axis of V1 (n=981 neurons, n=3 scans, n=1 mouse), color coded based on spectral contrast of their STA estimated for quiet (left) and active trials (right). Bottom shows spectral contrast along the posterior-anterior axis of V1 of cells from (c, top), with binned average (black, n=10 bins) and s.d. shading (gray). Spectral contrast varied only slightly, but significantly along anterior-posterior axis of V1 for quiet (n=981, p=10−7 for smooth term on cortical position of Generalized Additive Model (GAM); see Suppl. Statistical Analysis). The small change in spectral contrast across the anterior-posterior axis of V1 is likely due to the fact that we pooled data from a wider range of pupil sizes. For an active state, optimal spectral contrast also changed with behavioral state (n=981, p=10−16 for behavioral state coefficient of GAM), with a significant interaction between cortical position and behavioral state modulation (p=10−7; see Suppl. Statistical Analysis). d, Mean STA spectral contrast of quiet versus active state for n=6 scans from n=3 mice. Error bars: s.d. across neurons recorded in one scan that passed quality threshold. Marker shape and filling indicate mouse ID and cortical position along the posterior-anterior axis, respectively. STA spectral contrast was significantly shifted (p=10−101/3.68*10−51/10−59/10−303, Wilcoxon signed rank test (two-sided)) towards UV for posterior and medial scan fields. The shift was not evident in anterior V1. This was likely due to the different definitions of quiet and active state in the model compared to the sparse noise recordings: For pupil size thresholds more similar to the ones used in the model (20th and 85th percentile), we observed a stronger UV-shift in STA color preference with behavior, also for anterior V1. e, Top: pupil size trace with state changes from quiet to active indicated by vertical dashed lines. Red dots show selected trials using a 3 second read-out window. Bottom: difference in STA spectral contrast of quiet versus active state for different read-out times after state change. All: all trials with quiet and active trials defined as <20th and >85th percentile of pupil size. Shuffle: all trials with shuffled behavior parameters relative to neural responses. Dashed horizontal line indicates delta spectral contrast=0. Data shows mean and s.d. across neurons (n=996/702/964 cells, n=3 scans, n=2 animals).
Extended Data Figure 8.
Extended Data Figure 8.. Pharmacological pupil dilation replicates shift in color selectivity with sparse noise stimulus.
a, STAs of three example neurons, estimated for quiet trials in control condition (black) and dilated condition (red). b, Neurons recorded in three consecutive experiments across the posterior-anterior axis of V1 (n=1,079 neurons, n=3 scans, n=1 mouse), color coded based on STA estimated for quiet trials in the dilated condition. See Extended Data Fig. 7 for STAs estimated for the control condition of the same animal. c, Spectral contrast of STAs of neurons from (b) along the posterior-anterior axis of V1 (red dots), with binned average (n=10 bins; red line) and s.d. shading. Black line and gray shading corresponds to binned average and s.d. of neurons recorded at the same cortical positions in control condition (cf. Extended Data Fig. 7). Spectral contrast significantly varied across anterior-posterior axis of V1 for the dilated condition (n=1,079, p=10−16 for smooth term on cortical position of GAM). Optimal spectral contrast changed with pupil dilation (n=1,079 (dilated) and n=943 (control), p=10−16 for condition coefficient of GAM), with a significant interaction between cortical position and behavioral state modulation (see Suppl. Statistical Analysis). d, Mean spectral contrast of quiet state STAs in control condition versus spectral contrast of quiet state STAs in dilated condition (n=10 scans, n=3 mice). Error bars: s.d. across neurons. Two-sample t-test (two-sided): p=10−135/10−20/10−29/10−194/0.0006.
Extended Data Figure 9.
Extended Data Figure 9.. Reconstructions of colored naturalistic scenes predict color tuning shift for a neuronal population.
a, Schematic illustrating reconstruction paradigm. As the receptive fields of neurons recorded within one of our scans only covered a fraction of the screen, we used an augmented version of our CNN model for image reconstruction where the receptive field of each model neuron was copied to each pixel position of the image except the image margins. For a given target input image (image 1), this results in a predicted response vector (R1) of length number of neurons times number of pixels. During image reconstruction, a novel image (image 2) is optimized such that its corresponding response vector (R2) matches the response vector of the target image as closely as possible. b, Green and UV image channels of exemplary test image (top) and reconstructions of this image for a quiet (middle) and active state (bottom). For reconstructions, neurons from scan 1 in Fig. 2 were used. c, Spectral contrasts of reconstructed test images (n=100) in quiet state versus active state for n=3 models trained on scans from n=3 animals. Wilcoxon signed rank test (two-sided): p=10−18/10−18/10−18.
Extended Data Figure 10.
Extended Data Figure 10.. Additional data and stimulus conditions for decoding paradigm.
a, Exemplary frames of stimulus condition with lower object contrast than in Fig. 5c due to gray background in the object color channel. Right: Scatter plot of decoding discriminability of green versus UV objects for quiet (gray) and active (red) trials for n=3 animals. Each marker represents the decoding performance of the SVM decoder trained on all neurons of the respective scan. The decoding performance for the two behavioral states are connected with gray lines, with slopes larger than one for all animals, corresponding to a larger increase in decoding performance for UV versus green objects. P-values obtained from a one-sided permutation test: <0.012 (Mouse 1), <0.032 (Mouse 2), <0.112 (Mouse 3). b, Like (a), but for stimulus condition with objects as dark silhouettes and noise in the other color channel. P-values obtained from a one-sided permutation test: <0.02 (Mouse 1), <0.1 (Mouse 2), <0.038 (Mouse 3). c, Like (a), but for stimulus condition with high contrast objects and no noise in the other color channel. P-values obtained from a one-sided permutation test (see Methods for detail): 0.44 (Mouse 1), 0.404 (Mouse 2), 0.024 (Mouse 3). The observed variability in (a) and (b) across animals might be related to different recording positions along the anterior-posterior axis of V1 and differences in the animal’s behavior, i.e. the time spent in a quiet versus active behavioral state. For the stimulus condition in (c), we might also observe a ceiling effect caused by the fact that these stimuli are relatively easy to discriminate, as indicated by high object discriminability even during quiet behavioral periods.
Figure 1.
Figure 1.. Deep neural network captures mouse V1 tuning properties in the context of colored naturalistic scenes.
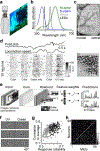
a, Schematic illustrating experimental setup: Awake, head-fixed mice on a treadmill were presented with UV/green colored naturalistic scenes (Extended Data Fig. 1). b, Normalized sensitivity spectra of mouse short (S; blue) and medium (M; green) wavelength sensitive opsin expressed by cones and rhodopsin (gray) expressed by rods, with LED spectra for visual stimulation. c, Cortical surface of a transgenic mouse expressing GCaMP6s, with positions of three scan fields (650 × 650 μm each). Bottom image shows cells (n=478) selected for further analysis. d, Neural activity (n=150 cells) in response to colored naturalistic scenes and simultaneously recorded behavioral data (pupil size and locomotion speed). e, Schematic illustrating model architecture: Model input consists of two image channels, three behavior channels and two position channels encoding the x and y pixel position of the input images [22]. A 4-layer convolutional core is followed by a Gaussian read-out and a non-linearity. Read-out positions are adjusted using a shifter network [18]. Traces on the right show average responses (gray) to test images of two example neurons and corresponding model predictions (black). f, Maximally exciting images (MEIs) of three example neurons (of n=658). See also Extended Data Fig. 3. g, Response reliability to natural images plotted versus model prediction performance of all cells of one scan. Neurons selected for experimental verification (inception loop) are indicated in black. h, Confusion matrix of inception loop experiment [18], depicting each selected neuron’s activity to presented MEIs. Neurons are ordered based on response to their own MEI. Responses to the neurons’ own MEI (along the diagonal) were significantly larger than to other MEIs (p=0 for a one-sided permutation test, n=10,000 permutations).
Figure 2.
Figure 2.. V1 color tuning changes with behavioral state.
a, MEIs optimized for a quiet state (3rd percentile of pupil and locomotion) and model activations for varying MEI spectral contrasts (n=50) of two example neurons (of n=1,759). Example stimuli below. Arrows: Cortical position of neurons. b, Neurons (n=1,759 neurons, n=3 scans, n=1 mouse) along posterior-anterior V1, color coded based on spectral contrast of quiet and active state (97th percentile) MEI. Inset: Scan positions within V1. Bottom shows MEI spectral contrast of neurons from (b, top) with binned average and s.d. shading. Spectral contrast significantly varied across V1 anterior-posterior axis (p=10−16 for smooth term on cortical position of Generalized Additive Model (GAM); see Suppl. Statistical Analysis). c, MEIs of an example neuron optimized for quiet and active state, with color tuning curves below. d, Population mean of peak-normalized color tuning curves from (b,c), aligned with respect to peak of quiet state tuning curves. Optimal spectral contrast shifted significantly towards higher UV-sensitivity during active periods (p=10−6 for behavioral state coefficient of GAM). e, Mean MEI spectral contrast of quiet and active state across animals (n=478/623/658/843/711/822/769/706 cells, n=8 scans, n=6 animals). Error bars: s.d. across neurons. Marker shape and filling indicate mouse ID and cortical position. Wilcoxon signed-rank test (two-sided): p=10−78/10−103/10−109/10−139/10−50/ 10−136/10−127/10−111. f, Pupil size and treadmill velocity over time. Dashed line: State change from quiet to active. Red dots: Active trials used for analyses for a 3 second read-out period. Bottom: Change in mean MEI spectral contrast (n=6 animals) between quiet and active state for different read-out lengths after state change, with mean across animals (black). All: all trials, Shuffle: Shuffled behavior relative to responses. One-sample t-test across animals (two-sided): p=0.038 (1 s), p=0.029 (2 s), p=0.053 (3 s), p=0.03 (5 s), p=0.021 (10 s), p=0.001 (All), p=0.92 (Shuffled).
Figure 3.
Figure 3.. Pupil dilation causes state-dependent shift of V1 color selectivity.
a, Example images of eye camera for quiet and active state, and control and dilated condition (atropine). b, MEI of example neuron (of n=478) optimized for a quiet state for control and dilated condition and peak-normalized color tuning curves. Neurons were matched anatomically across recordings. c, Neurons (n=1,101) recorded in two experiments for control (from Fig. 2) and dilated condition, color coded based on spectral contrast of quiet state MEI. Spectral contrast significantly varied across V1 anterior-posterior axis for the dilated condition (n=1,859, p=10−16 for smooth term on cortical position of Generalized Additive Model (GAM); see Suppl. Statistical Analysis). d, Mean spectral contrast of quiet state MEIs in control versus dilated condition (n=478/623/658/711/1,109/464/689/706/723/1,090 cells, n=10 scans, n=3 animals). Marker shape and filling indicate mouse ID and cortical position. Error bars: s.d. across neurons. Two-sample t-test (two-sided): p=0 for all scans. e, Mean activity of neurons from (c) during quiet and active behavioral periods in control and dilated condition. f,g Like (a,b), but for pupil constriction with carbachol. h, Neurons recorded in posterior V1 (n=751 (control)and 518 (constricted)), color coded based on spectral contrast of quiet state MEI. Bottom shows mean spectral contrast of quiet state MEIs in control versus constricted condition (n=822/769/1,109/751/1,037/1,028 cells, n=6 scans, n=3 mice). Error bars: s.d. across neurons. Two-sample t-test (two-sided): p=0/0/10−38. i, Spectral contrast of quiet state MEIs versus spectral contrast of active state MEIs (n=778 neurons, n=6 scans, n=3 mice), for control (gray) and constricted condition (black). Only neurons with a test correlation >0.3 are shown. Wilcoxon signed rank test (two-sided): p=10−134/10−127/10−170 (control), p=0.98/0.0003/10−6 (constricted). j, Like (e), but for neurons from (h) in control and constricted condition.
Figure 4.
Figure 4.. Pupil dilation during an active behavioral state differentially recruits rod and cone photoreceptors.
a, Schematic of mouse eye for a quiet behavioral state with small pupil (top) and an active state with large pupil (middle). Right panels: Simplified circuit diagram of the vertebrate retina. Activation of rod and cone photoreceptors indicated by degree of transparency. Arrows indicate amount of light entering the eye through the pupil. Photoreceptors are colored based on their peak wavelength sensitivity. Bottom: Pupil area recorded during functional imaging, with estimated photoisomerization rates (P*/cone*second) for small and large pupil. b, Neurons recorded in posterior V1 color coded based on spectral contrast of their quiet state MEI under dilated condition, for a high monitor intensity (n=1,125 cells) and a 1.5 order of magnitude lower monitor intensity (n=1,059 cells). Bottom shows mean spectral contrast of quiet state MEIs in low versus high monitor intensity condition (n=1,125/651/1,090/1,059/627/1,068 cells, n=6 scans, n=3 mice). Error bars: s.d. across neurons. Two-sample t-test (two-sided): p=0 for all scans.
Figure 5.
Figure 5.. Shift of color preference during an active state facilitates decoding of behaviorally relevant stimuli.
a, Schematic illustrating decoding paradigm. Neural responses for either quiet or active trials to green or UV objects were used to train a non-linear support vector machine (SVM) decoder to predict stimulus classes. b, Example stimulus frames of green and UV objects on top of noise. Stimulus conditions were presented as 5-second movie clips in random order. c, Scatter plot of decoding discriminability of green versus UV objects for quiet and active trials for n=4 animals, for SVM decoder trained on all neurons of each scan (n=1,090/971/841/918 cells). Gray lines connect quiet and active state performance of the same animal, with slopes larger than one indicating a larger increase in decoding performance for UV versus green objects. P-values obtained from a one-sided permutation test: <0.002 (mouse 1), <0.044 (mouse 2), <0.024 (mouse 3), <0.01 (mouse 4). d, Natural scene recorded at sunrise with a custom camera adjusted to the spectral sensitivity of mice [10], with a drone mimicking an aerial predator. Right images show single color channels of image crop from the left, with the mock predator highlighted by white circle. e, Parametric stimuli inspired by natural scene in (d), showing a dark object in either UV or green image channel (top) or noise only (bottom), with object present or absent as decoding objective. Stimuli were shown for 0.5 seconds with 0.3–0.5 second periods of gray screen in between. f, Similar to (c), but for decoding detection of green versus UV dark objects from (e; n=773/1,049/1,094 cells, n=3 scans/animals). P-values obtained from a one-sided permutation test (see Methods for detail): <0.008 (Mouse 1), <0.009 (Mouse 2), <0.008 (Mouse 3).

References

    1. Reimer J. et al. Pupil fluctuations track fast switching of cortical states during quiet wakefulness. Neuron 84 (2), 355–362 (2014) . - PMC - PubMed
    1. Niell CM & Stryker MP Modulation of visual responses by behavioral state in mouse visual cortex. Neuron 65 (4), 472–479 (2010) . - PMC - PubMed
    1. Vinck M, Batista-Brito R, Knoblich U. & Cardin JA Arousal and locomotion make distinct contributions to cortical activity patterns and visual encoding. Neuron 86 (3), 740–754 (2015) . - PMC - PubMed
    1. Treue S. & Maunsell JH Attentional modulation of visual motion processing in cortical areas MT and MST. Nature 382 (6591), 539–541 (1996) . - PubMed
    1. Erisken S. et al. Effects of locomotion extend throughout the mouse early visual system. Curr. Biol 24 (24), 2899–2907 (2014) . - PubMed

Publication types