. 2022 Oct;610(7932):555-561.
doi: 10.1038/s41586-022-05264-1. Epub 2022 Sep 28.

An LKB1-mitochondria axis controls TH17 effector function

Affiliations

An LKB1-mitochondria axis controls TH17 effector function

Francesc Baixauli et al. Nature. 2022 Oct.

Abstract

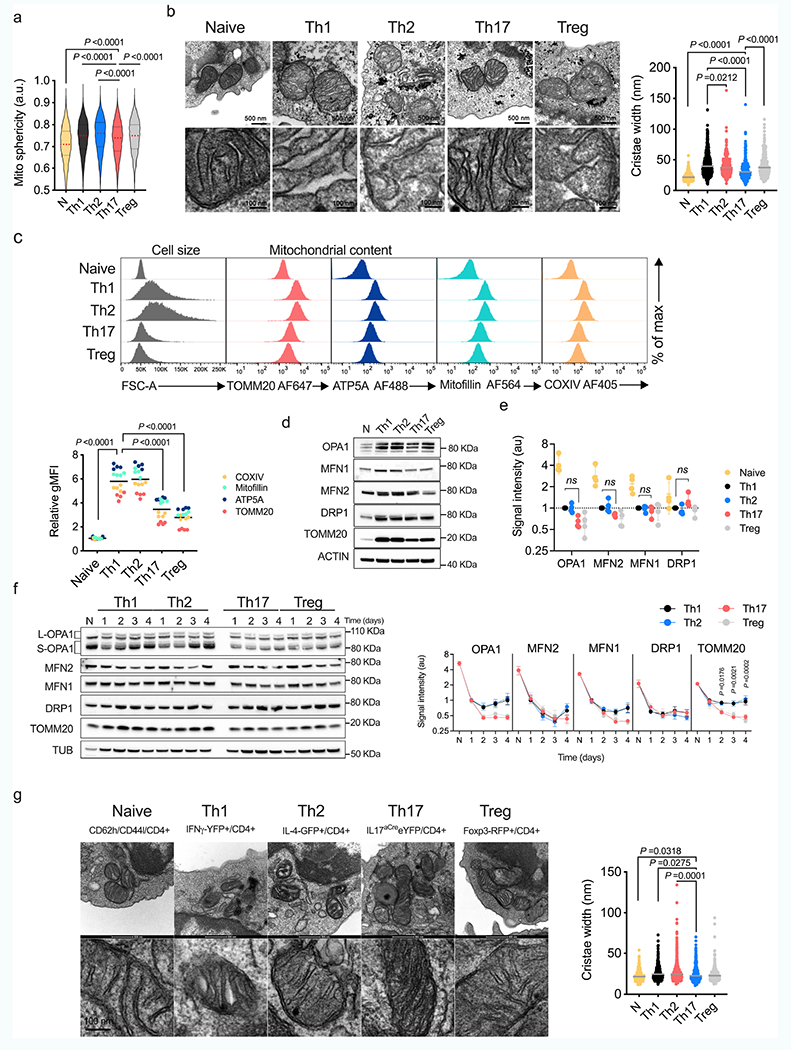
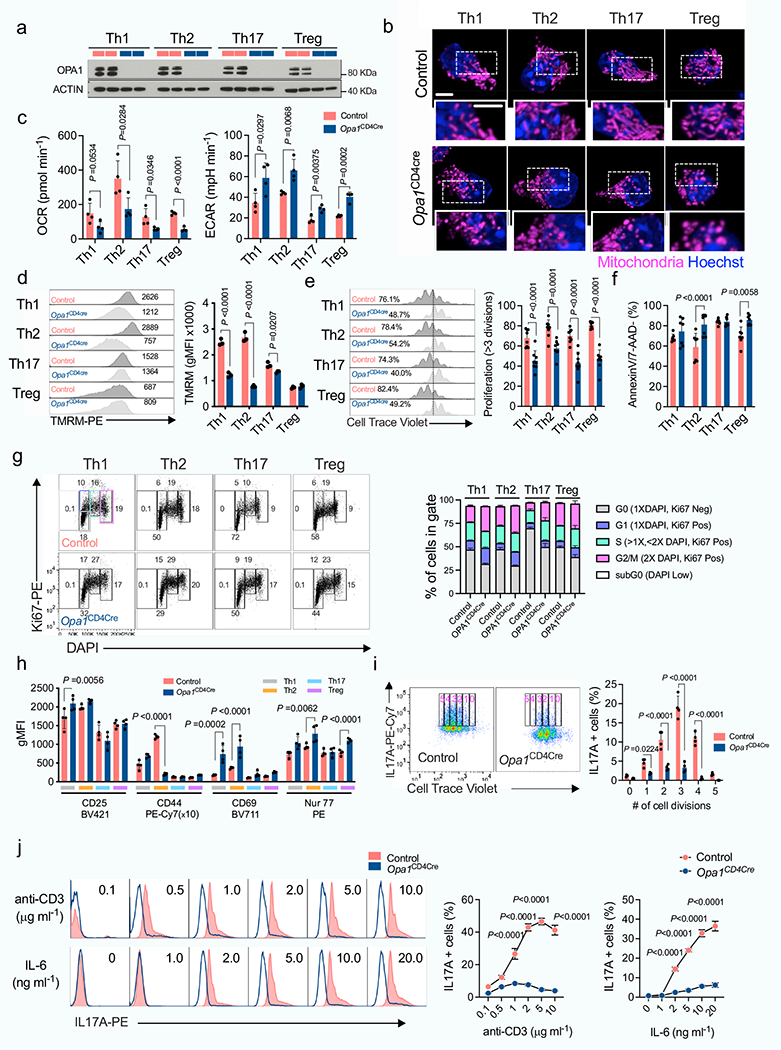
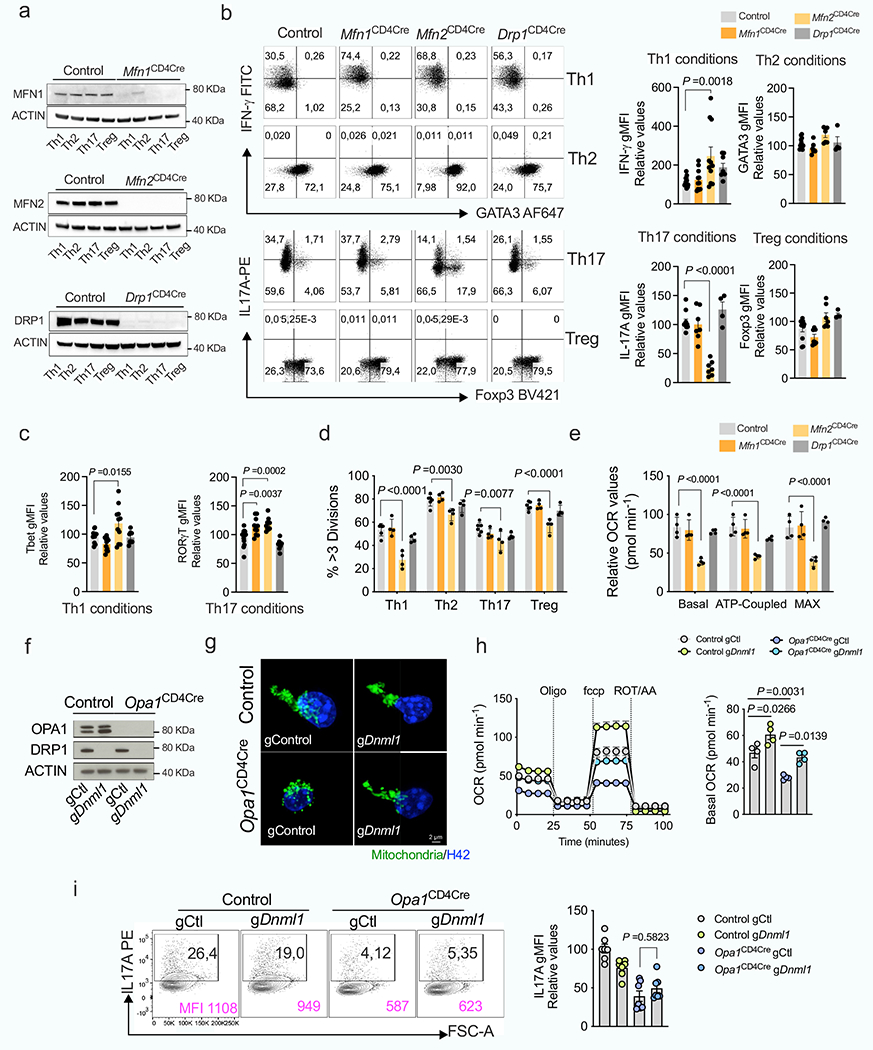
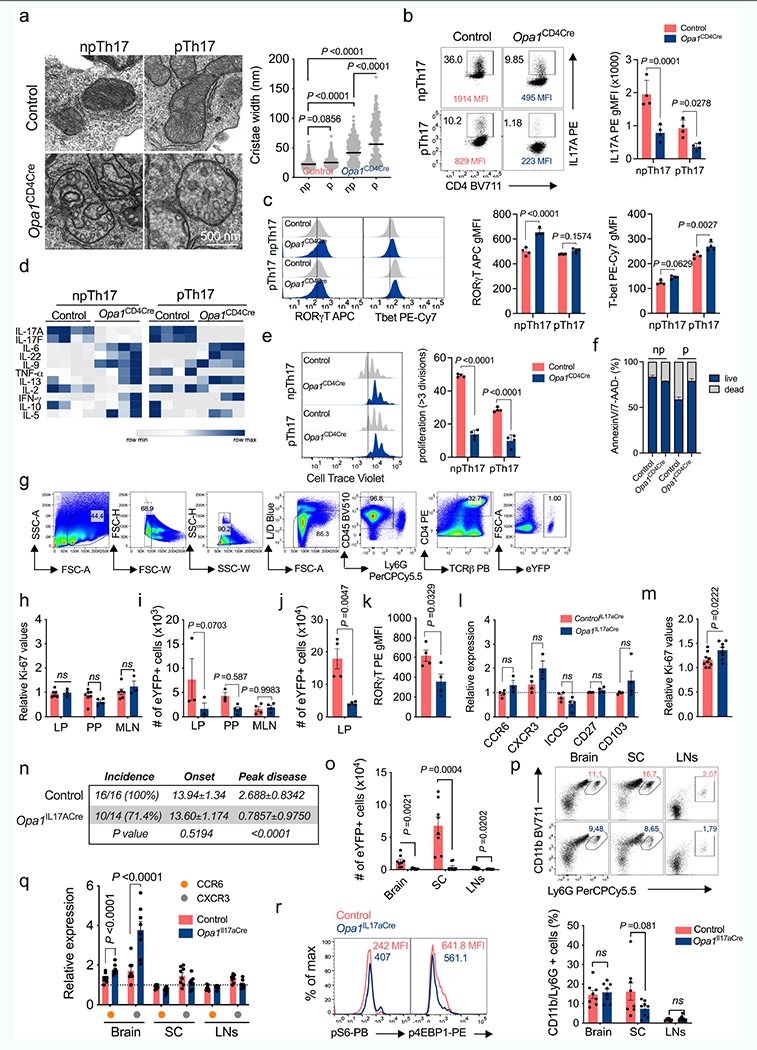
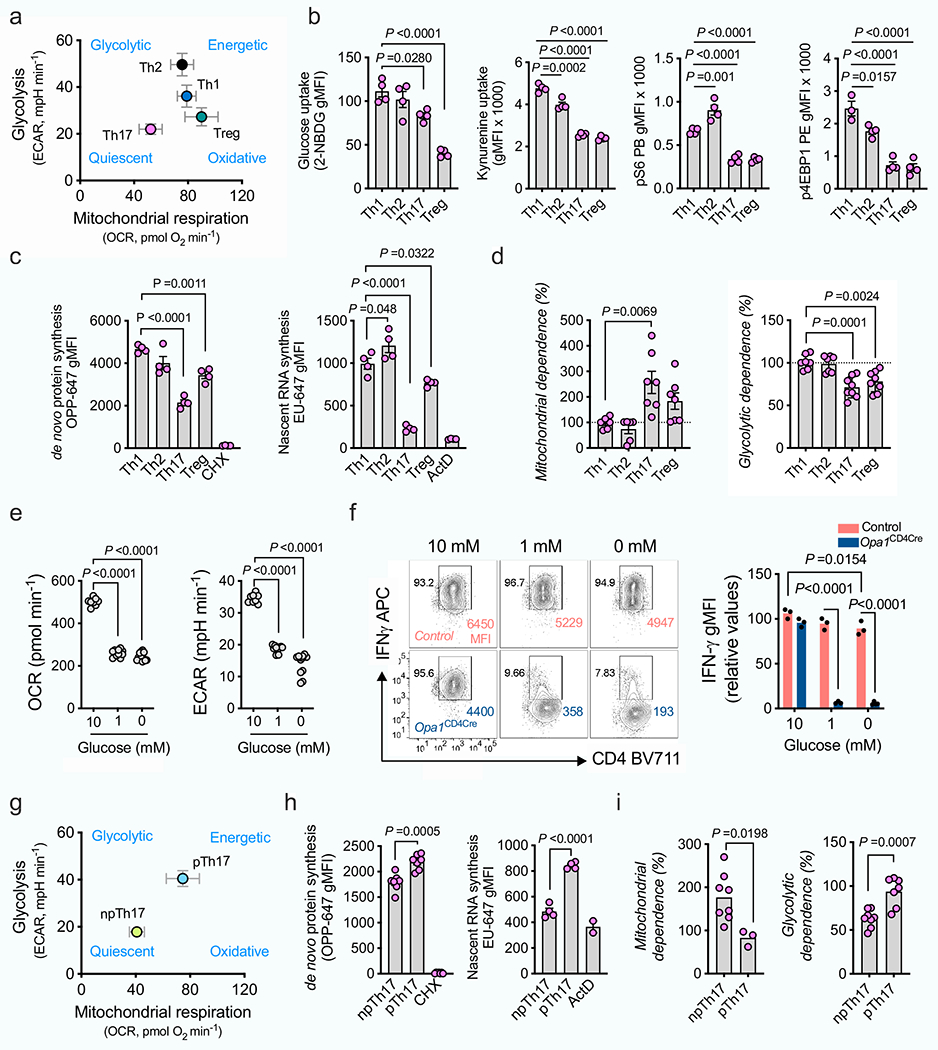
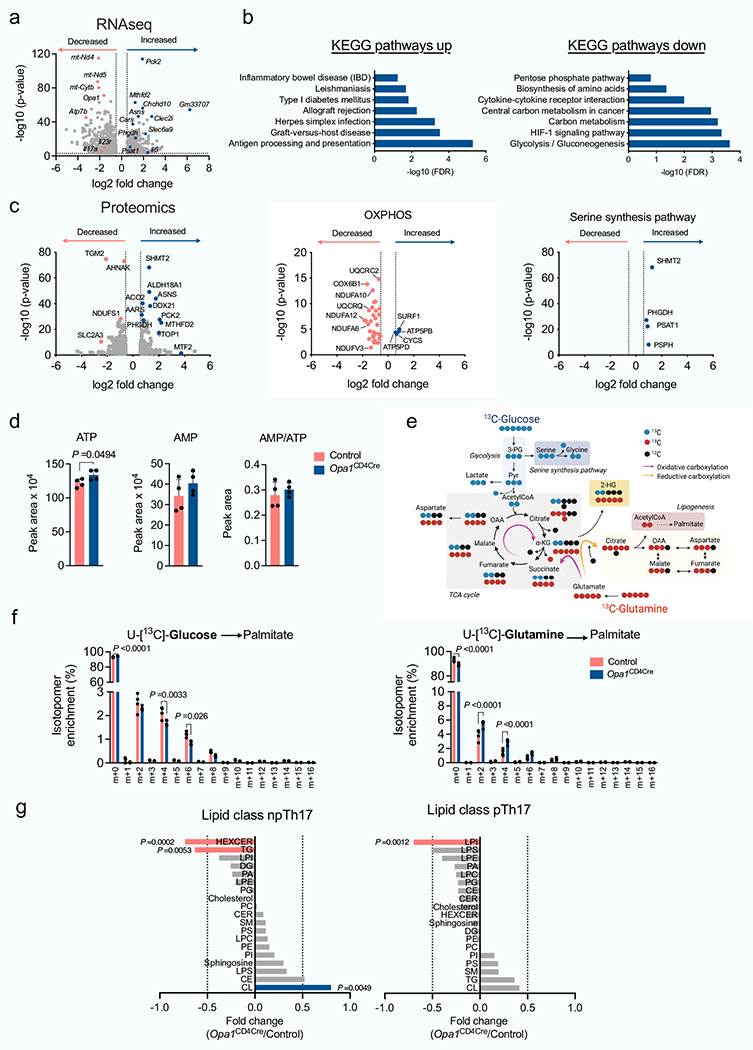
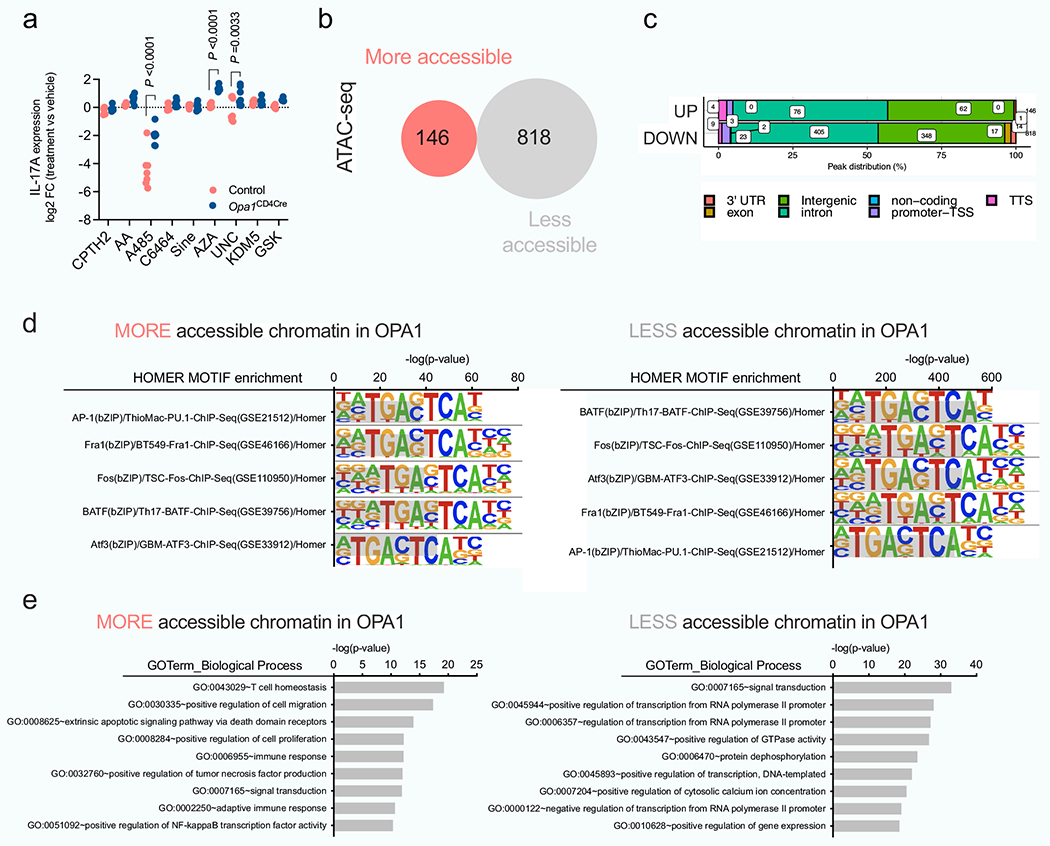
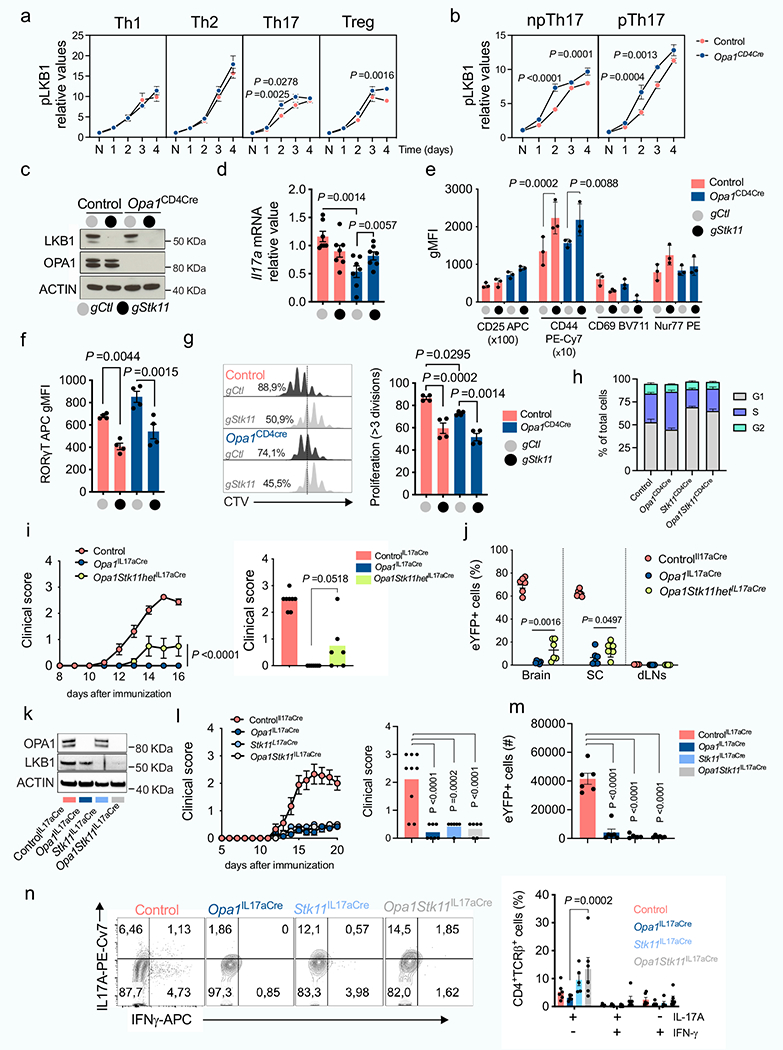
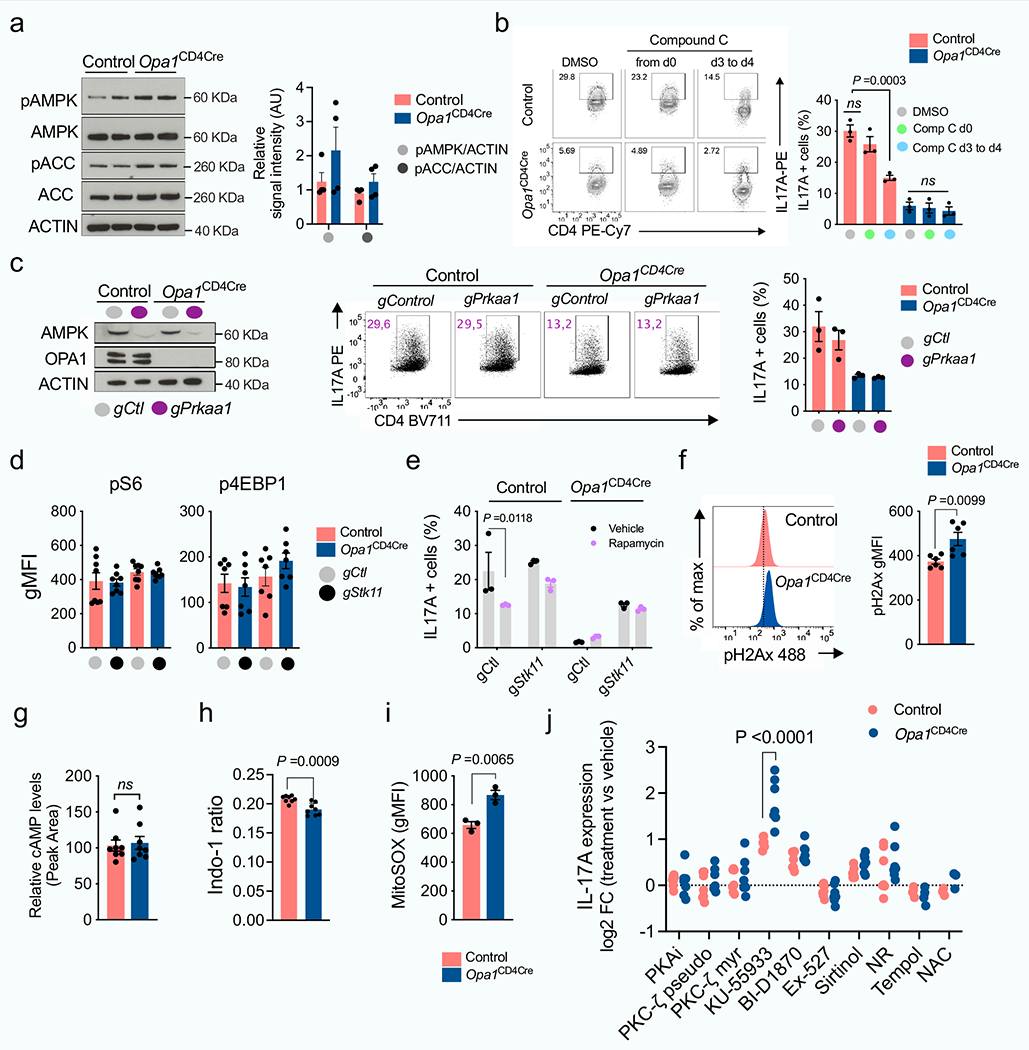
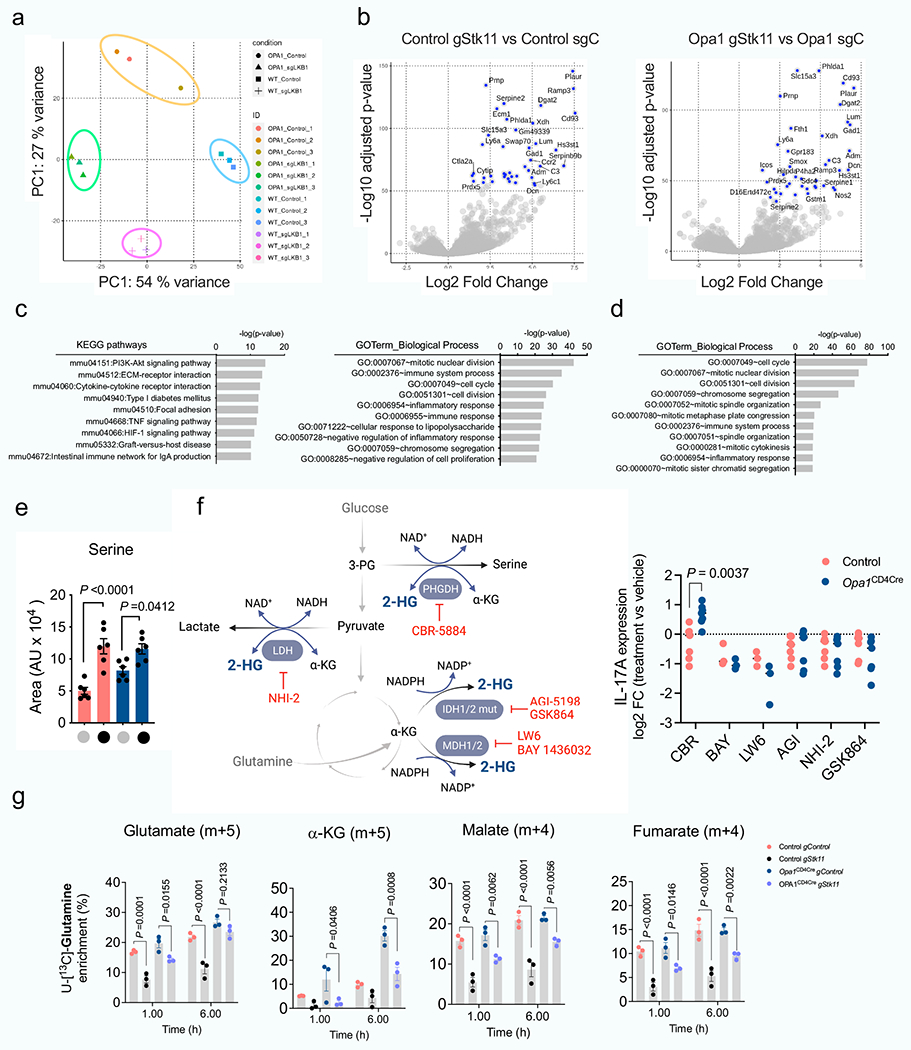
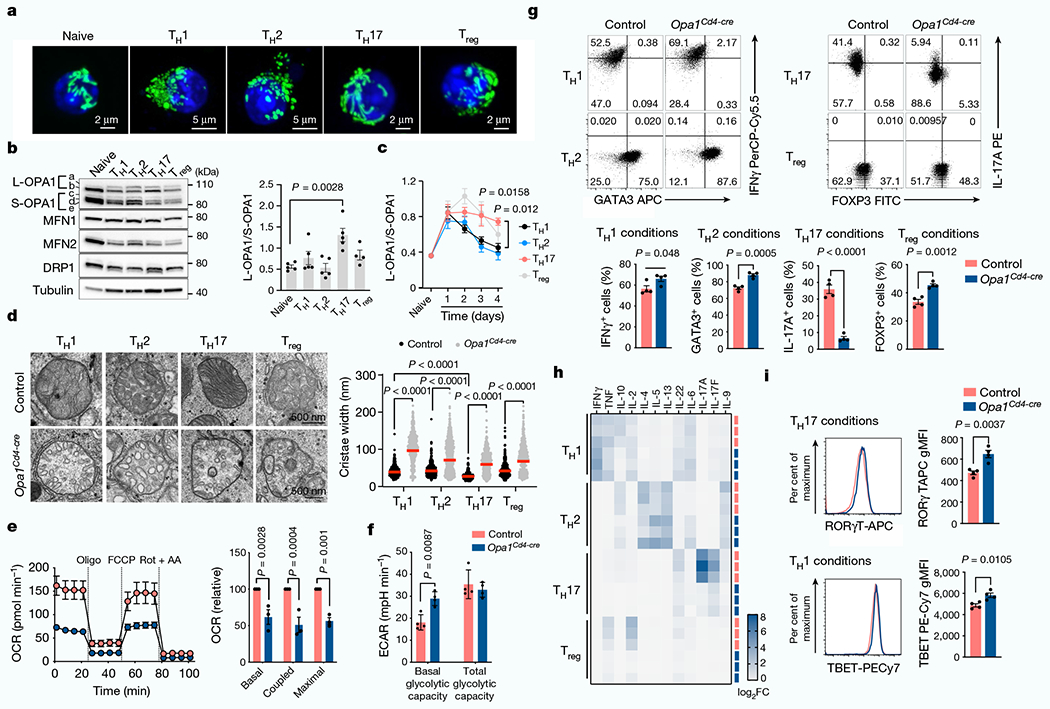
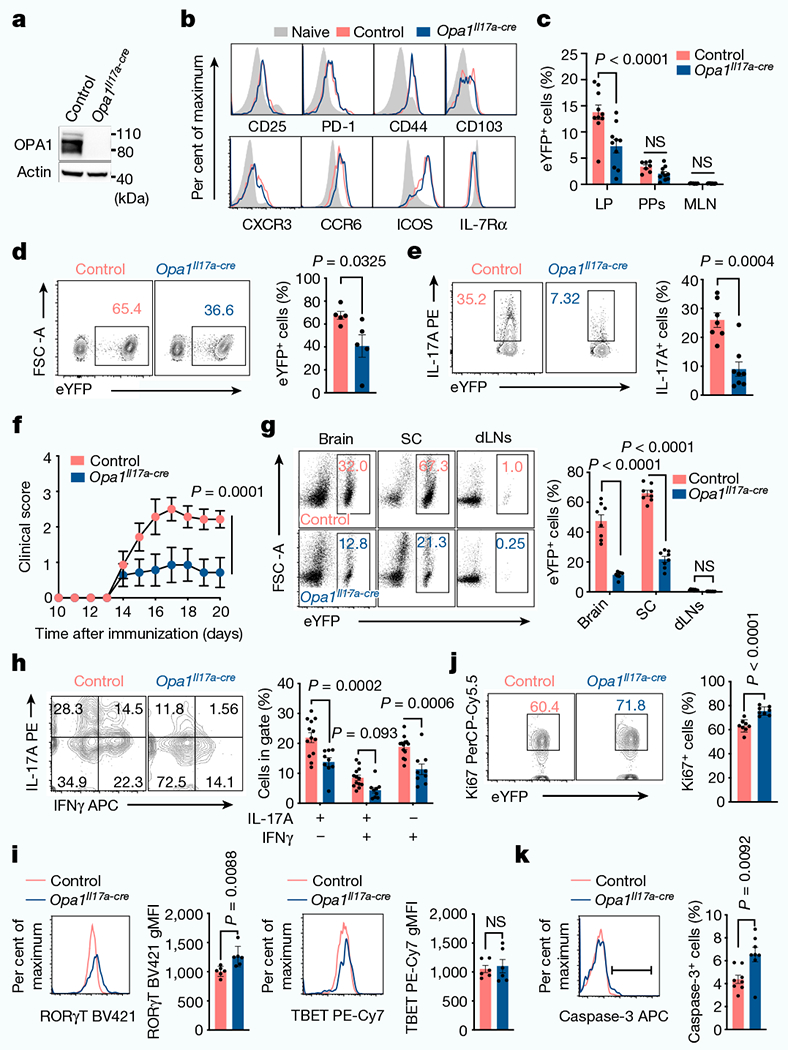
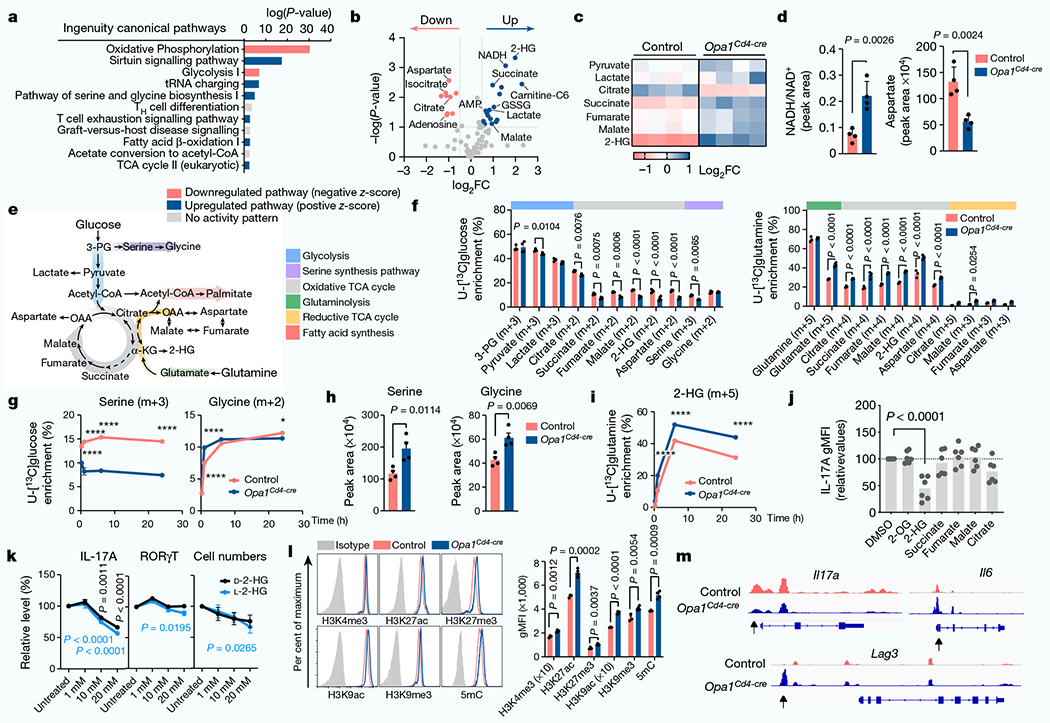
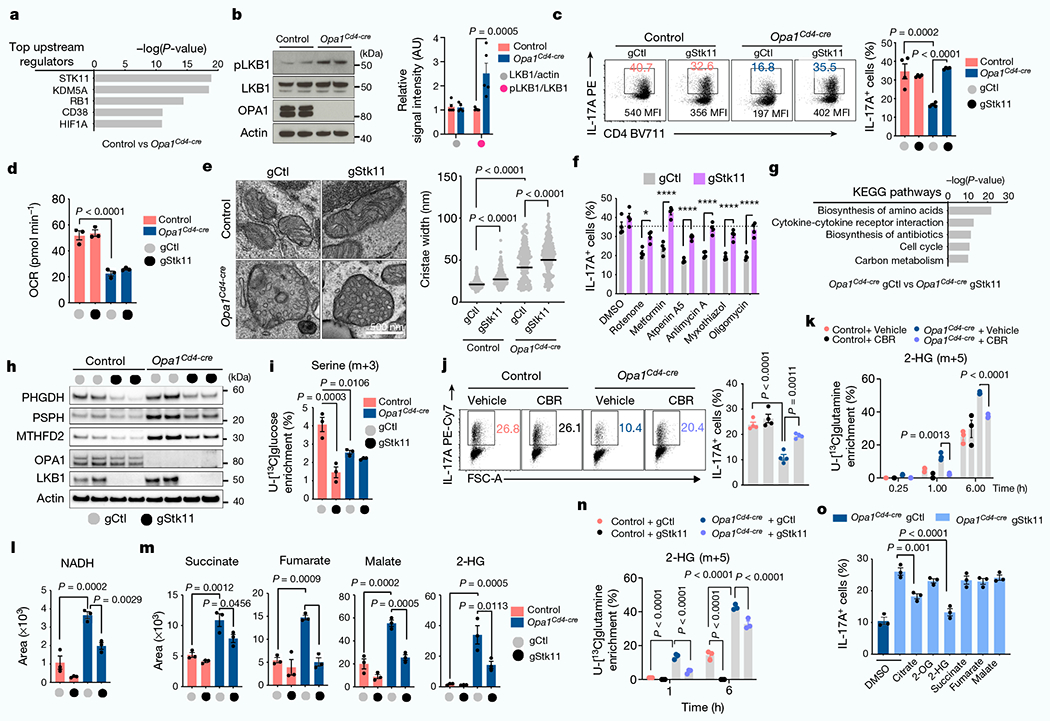
CD4+ T cell differentiation requires metabolic reprogramming to fulfil the bioenergetic demands of proliferation and effector function, and enforce specific transcriptional programmes1-3. Mitochondrial membrane dynamics sustains mitochondrial processes4, including respiration and tricarboxylic acid (TCA) cycle metabolism5, but whether mitochondrial membrane remodelling orchestrates CD4+ T cell differentiation remains unclear. Here we show that unlike other CD4+ T cell subsets, T helper 17 (TH17) cells have fused mitochondria with tight cristae. T cell-specific deletion of optic atrophy 1 (OPA1), which regulates inner mitochondrial membrane fusion and cristae morphology6, revealed that TH17 cells require OPA1 for its control of the TCA cycle, rather than respiration. OPA1 deletion amplifies glutamine oxidation, leading to impaired NADH/NAD+ balance and accumulation of TCA cycle metabolites and 2-hydroxyglutarate-a metabolite that influences the epigenetic landscape5,7. Our multi-omics approach revealed that the serine/threonine kinase liver-associated kinase B1 (LKB1) couples mitochondrial function to cytokine expression in TH17 cells by regulating TCA cycle metabolism and transcriptional remodelling. Mitochondrial membrane disruption activates LKB1, which restrains IL-17 expression. LKB1 deletion restores IL-17 expression in TH17 cells with disrupted mitochondrial membranes, rectifying aberrant TCA cycle glutamine flux, balancing NADH/NAD+ and preventing 2-hydroxyglutarate production from the promiscuous activity of the serine biosynthesis enzyme phosphoglycerate dehydrogenase (PHGDH). These findings identify OPA1 as a major determinant of TH17 cell function, and uncover LKB1 as a sensor linking mitochondrial cues to effector programmes in TH17 cells.


Conflict of interest statement

Competing interests E.L.P. is member of the scientific advisory boards of ImmunoMet Therapeutics. E.L.P. and E.J.P. are founders of and scientific advisors to Rheos Medicines.

Figures

Extended Data Fig. 1 |
Extended Data Fig. 1 |. Mitochondrial membrane remodeling in CD4+TN cells under T-helper (Th) and regulatory (Treg) conditions in vitro and in vivo.
a) Mitochondrial sphericity In live cell spinning disk microscopy images In CD4+ TN cells (PhAM mice) cultured in Th and Treg conditions (TN: n = 1673, Th1: n = 8406, Th2: n = 5485, Th17: n = 7672 and Treg: n = 4824 segmented objects (mitochondria), 2 independent experiments. Violin plot shows median with quartiles. b) EM images (left) and cristae width (right) in TN cells cultured in Th and Treg conditions (TN: n = 362, Th1: n = 479, Th2: n = 369, Th17: n = 319, and Treg: n = 294 cristae, 3 biological replicates). (c) Intracellular expression in TN, Th and Treg cells (n = 4 biological replicates). Representative graph summarize results of two independent experiments. d) Immunoblot of CD4+ TN, Th and Treg cells, day 4, representative experiment out of two. ACTIN: sample processing control (e) Quantification of protein levels from immunoblots as in Fig. 1b (n = 4 biological replicates, 2 independent experiments). f) Immunoblot of proteins that control mitochondrial dynamics in CD4+ TN cells cultured for the indicated times in Th and Treg conditions. TUBULIN: sample processing control. Right, protein levels (n = 4 biological replicates, 2 independent experiments). g) EM images (left) and cristae width (right) in CD4+ TN and effector T cells from reporter mice subjected to immune challenges (naive: n = 410, Th1: n = 262, Th2: n= 675, Th17: n = 461 and Treg: n = 402 cristae, 3 mice per condition). Data b, g are geometric mean, c mean and e, f means ± s.e.m. Two-sided Tukey’s test (b) or Dunnett’s test (a, c, e, f, g). Exact P values are indicated.
Extended Data Fig. 2 |
Extended Data Fig. 2 |. Mitochondrial dysfunction and proliferation defects in Opa1CD4cre T cells.
CD4+ TN cells from control and Opa1cd4cre mice were cultured 4 days in Th and Treg conditions. a) Immunoblot for OPA1 at the end of the culture (2 biological replicates per condition shown). ACTIN: loading control. b) Spinning disk microscopy images from mitochondria (MitoTracker Deep Red, purple) and nuclei (Hoechst, blue). Scale bar: 2 μm. Representative images from 3 biological replicates. c) Baseline OCR (left) and ECAR (right) (n = 4 biological replicates). d) Mitochondrial membrane potential determined by Tetramethylrhodamine methyl ester (TMRM) (n = 3 biological replicates) e) Cell proliferation, day 3 (n = 8 biological replicates, 2 independent experiments). f) Cell viability determined by 7-aminoactinomycin D (7-AAD) and annexin-V staining, day 4 (n = 7 biological replicates, 2 independent experiments). g) Cell-cycle analysis determined by Ki-67 and DAPI staining (n = 3 biological replicates). h) Surface expression of CD25, CD44 and CD69, and intracellular expression of Nur77 in CD4+ TN cells from control and Opa1CD4Cre mice cultured 3 days in Th and Treg conditions (n = 4 biological replicates). i) IL-17A expression and proliferation in control and Opa1CD4Cre Th17 cells, day 3. Graph shows IL-17A expression per each cell division state gated on live CD4+ T cells (n = 4 biological replicates).j) IL-17A expression in CD4+ TN cells cultured in Th17 conditions with increasing concentration of plate bound anti-CD3 or IL-6 for three days and restimulated (n = 4 biological replicates). Representative plots and a graph summarizing the results of at least two independent experiments are shown, except where noted otherwise. Data are means ± s.e.m. Two-sided šidák’s test (d, e, f, h, i, j) or unpaired two-tailed t-test (c). Exact P values are indicated.
Extended Data Fig. 3 |
Extended Data Fig. 3 |. Role of inner and outer MM remodeling in IL-17A production.
Mfn1, Mfn2 or Dnml1 floxed mice were crossed with CD4Cre mice (Mfn1CD4Cre, Mfn2CD4Cre and Drp1CD4Cre). a, b, c, d, e, CD4+ TN cells across genotypes were cultured in Th and Treg conditions. a) Immunoblot of MFN1, MFN2 and DRP1 in a representative experiment out of two. ACTIN: loading control. b) Cytokine and TF expression in Th- and Treg-reestimulated cells across genotypes (Th1 conditions: Control n=15; Mfn1, Mfn2 n =11; Drp1 n =8; Th2, Th17 and Treg conditions; Control n =11; Mfn1, Mfn2 n =7; Drp1 n =4, biological replicates). c) Intracellular levels of T-bet and ROR-γt (Control n = 15; Mfn1CD4Cre n =11; Mfn2CD4Cre n =11; Drp1CD4Cre n =8, biological replicates). d) Proliferation as determined by Cell Trace Violet dilution staining (n = 4 biological replicates, except control; n = 6). e) Relative baseline OCR, ATP-coupled respiration, and maximal respiration in Th17 cells across genotypes (n = 4 biological replicates per group).f, g, h, i, Control and Opa1CD4Cre CD4+ TN cells were transfected with Cas9 and indicated gRNAs. f) Immunoblot for DRP1 and OPA1. ACTIN: loading control. g) Representative spinning disk confocal images from mitochondria (Mitotracker Deepred, green) and nuclei (Hoechst, blue) from 3 biological and transfection replicates. h) OCR upon oligomycin (Oligo), fccp and rotenone + Antimycin A (ROT+AA) addition (left) and relative baseline OCR (right) (n =4 biological and transfection replicates). i) Intracellular IL-17A expression (n =7 biological and transfection replicates). Representative plots and a graph summarizing the results of at least two independent experiments are shown, except where noted otherwise. Data are means ± s.e.m. Two-sided Tukey’s test (b, c, d, e, h, i). Exact P values are indicated.
Extended Data Fig. 4 |
Extended Data Fig. 4 |. OPA1-requirement for IL-17A expression across cell culture and in vivo conditions.
TN cells cultured in Th17 non-pathogenic (np) and pathogenic (p) conditions. a) EM images and cristae width (Control np: n = 528, p: n = 343; Opa1CD4Cre np: n = 321, p: n = 267 cristae, 3 biological replicates). Graph shows geometric mean, black. (b) Cytokine (c) TF expression, d) supernatant cytokines, and e) proliferation, n = 4 biological replicates. f) Cell viability (n = 8, 2 independent experiments). g) Gating strategy to identify CD4+TCRβ+eYFP+ (Th17) cells. h) Ki-67 expression in LP Th17 cells (Control: n = 6; Opa1IL17aCre: n = 3), PP (Control: n = 7; Opa1IL17aCre: n = 4) and MLN (Control: n = 6; Opa1IL17aCre: n = 3), 2 independent experiments. i) Th17 cell numbers (LP: n = 3; PP; Control: n = 3; Opa1IL17aCre: n = 4, MLN: n = 4). Mice were anti-CD3 immunized.j) LP Th17 cell numbers (n = 4), k) ROR-γT expression (n = 4), l) surface expression (CCR6, CXCR3: Control: n = 4; Opa1IL17aCre: n = 3; ICOS, CD27, CD103: n = 4) and m) Ki-67 levels (Control: n = 9; Opa1IL17aCre: n =8, 2 independent experiments). Mice were MOG immunized. n) Disease incidence, onset and peak disease (days, controlIL17aCre: n = 16; Opa1IL17aCre: n = 14, 2 independent experiments. o) Cell numbers (n = 8). p) Neutrophil percentage (CD45+CD11b+Ly6G+, n = 8). q) CCR6 and CXCR3 levels (n = 8). r) Phosphorylated S6 and 4E-BP1 (CD4+TCRβ+eYFP+cells). Plots and graphs summarize results of at least two independent experiments, except noted otherwise. Data are means ± s.e.m. Two-sided Tukey’s test (a) or šidák’s test (b, c, e, i, l, q) or unpaired two-tailed t-test (h, j, k, m, o, p). Exact P values are indicated.
Extended Data Fig. 5 |
Extended Data Fig. 5 |. Th17 cells rely on OPA1 independent of metabolic activity.
a, b, c, d, CD4+ TN cells were cultured in Th and Treg conditions. a) Bioenergetic profile (baseline OCR/ECAR, n = 4 independent experiments). b) Glucose and kynurenine uptake, phosphorylated S6 (n = 4) and 4E-BP1 (Th1: n = 3, Th2,Th17,Treg: n = 4 biological replicates). c) de novo protein and nascent RNA synthesis by O-propargyl puromycin (OPP) and ribonucleoside ethynyl uridine (EU) incorporation, respectively (n = 4 biological replicates). Cyclohexamide (CHX) and actinomycin D (ActD): negative controls. d) Protein translation dependence on mitochondria (left, Th1, Th2: n = 6; Th17,Treg: n = 7 biological replicates) or glycolysis (right, Th1, Th2: n = 7: Th17, Treg: n = 8 biological replicates), 2 independent experiments. (e) OCR and ECAR (10 mM: n = 8; 1 mM and 0 mM n = 4 biological replicates) and (f) IFN-γ expression (n = 3 biological replicates) in cells cultured in Th1 conditions 3 days before overnight culture in RPMI with 10% non-dialyzed FBS and decreasing glucose concentrations. g, h, i, CD4+ TN cells cultured in Th17 np/p conditions. g) Bioenergetic profile (n = 4 biological replicates). h) de novo protein synthesis (left, n = 7 biological replicates, 2 independent experiments) and nascent RNA synthesis (right, np/p: n = 4, ActD: n = 2 biological replicates). i) Protein translation dependence on mitochondria (left, np: n = 8: p: n = 3 biological replicates) or glycolysis (right, np: n = 8: p: n = 7 biological replicates, 2 independent experiments). Representative plots and graphs summarize results of at least two independent experiments, except where noted otherwise. Data are means ± s.e.m. Two-sided Tukey’s test (be), šidák’s test (f) or unpaired two-tailed t-test (h, i). Exact P values are indicated.
Extended Data Fig. 6 |
Extended Data Fig. 6 |. Multi-OMICS analysis of Th17 cells upon OPA1 deletion.
Control and Opa1CD4CTe CD4+ TN cells were cultured in Th17 conditions and the RNA extracted and sequenced. a) Volcano plot shows differentially expressed genes (1518: log10 P value < 3, log2 FC > 0.5). b) DAVID KEGG pathway analysis from differentially up- (779) or downregulated (739) genes (FDR, false discovery rate). c) Control and Opa1CD4Cre CD4+ TN cells were cultured in Th17 conditions and proteins from whole cell lysates extracted and analyzed (LC-MS). Left, volcano plot from differentially expressed proteins (562: log10 P value<1.3, log2 FC > 0.58). Middle and right volcano plots, protein expression in relation to OXPHOS and serine and glycine biosynthesis pathways, respectively. d) Cellular ATP, AMP and AMP/ATP ratio by LC-MS (n= 4 per genotype, day 4). e) Schematic of [U-13C]-Glucose and [U-13C]-Glutamine carbon allocation into central carbon metabolites. f) Fractional labelling of palmitate with [U-13C]-Glucose (left) or [U-13C]-Glutamine (right) in control and Opa1CD4Cre Th17 cells cultured 20 h on day 3 with fully labelled subsrates (n = 4 per group). g) Control and Opa1CD4ae CD4+ TN cells were cultured in Th17 conditions 4 days and lipids extracted and analyzed (n = 4 biological replicates). Graph, FC of distinct lipid classes in Opa1CD4Cre vs. control (HEXCER: hexosylceramide, TG: triacylglycerades, LPI: lysophosphatidylinositol, DG: diacylglycerol, PA: phosphatidic acid, LPE: lysophosphatidylethanolamine, PG: phosphatidylglycerol, Cholesterol, PC: phosphatidylcholines, CER: ceramides, SM: sphingomyelin, PS: phosphatidylserine, LPC: lysophosphatidylcholines, PE: phosphatidylethanolamine, PI: phosphatidylinositol, Sphingosine, LPS: lipopolysaccharide, CE: cholesterol esters, CL: cardiolipins). Transcriptomics, proteomics and lipidomics were performed once (a,b: n = 3; g: n = 4 biological replicates). Graphs summarize results of at least two independent experiments in d, f. Data are means ± s.e.m. Unpaired two-tailed t-test (a, c, d, f, g). Exact P values are indicated.
Extended Data Fig. 7 |
Extended Data Fig. 7 |. OPA1 controls chromatin accessibility in Th17 cells. a) CD4+ TN cells.
a) CD4+ TN cells from control and Opa1CD4Cre mice were cultured in Th17 conditions for 1 day followed by 48 h incubation with inhibitors for histone acetylation and methylation, and DNA methylation. IL-17A expression was analyzed by flow cytometry and results show log2 FC of IL-17A MFI in inhibitor-treated vs vehicle-treated cells (n = 7 biological replicates for all conditions except GSK: n = 4 biological replicates). Graph combines data from two independent experiments. Data are mean ± s.e.m. Two sided šidák’s test. Exact P values are indicated. b, c, d, e, CD4+ TN cells from control and Opa1CD4Cre mice were cultured in Th17 conditions 4 days and the DNA extracted and processed for ATAC-seq (n = 3 biological replicates). b) Number of differentially accessible chromatin regions (FC >2, p < 0.01). c) Genomic localization of the differentially regulated accessible chromatin regions. d) HOMER motif TF analysis on regulated chromatin regions. e) GO term pathway enrichment analysis from the differentially regulated accessible chromatin regions between Opa1CD4Cre and control Th17 cells (FC >2, p < 0.01).
Extended Data Fig. 8 |
Extended Data Fig. 8 |. LKB1 deletion in OPA1 reestablishes IL-17A expression.
LKB1 phosphorylation kinetics in CD4+ TN cells cultured in Th and Treg (a) and np/p Th17 (b) conditions (Control: n = 4; Opa1CD4Cre: n = 3 biological replicates). c, d, e,f g, h Control and Opa1CD4Cre CD4+ TN cells transfected with Cas9 and indicated gRNAs. (c) Immunoblot for LKB1 and OPA1. ACTIN: loading control, (d) IL-17A mRNA expression (RT-PCR, n = 7), (e) CD25, CD44,CD69 and Nur77 expression (n = 3), (f) ROR-γT expression (n = 4), (g) cell proliferation (n = 4), (h) and cell-cycle analysis (n = 4, biological and transfection replicates). i) Left, clinical disease score upon MOG immunization and at day 16 (Right), (control: n = 8; Opa1IL17aCre: n = 7; and Opa1Stk11hetIL17aCre: n = 6 mice).j) CD4+TCRβ+eYFP+cell frequencies, day 20 post-immunization (n = 6 mice). k) Immunoblot for LKB1 and OPA1 in CD4+TCRβ+eYFP+ cells from control, Opa1IL17aCre, Stk11IL17aCre and Opa1Stk11IL17aCre mice. ACTIN: loading control. I) Left, clinical disease score upon MOG immunization and at day 16 (Right) (control: n = 9; Opa1IL17aCre: n = 7; Stk11IL17aCre: n = 6 and Opa1Stk11IL17aCre: n = 6 mice). m) CD4+TCRβ+eYFP+ SC cell numbers (n = 6 mice per genotype except Stk11IL17aCre: n = 5 mice) and n) IL-17A and IFN-γ expression, day 20 postimmunization (control: n = 6 mice; Opa1IL17Cre: n = 5 mice; Stk11IL17Cre: n = 5 mice; Opa1Stk11IL17Cre: n = 6 mice). Representative plots and graphs summarize results of at least two independent experiments, except noted otherwise. Data are means ± s.e.m. Two-sided šidák’s test (a, b, h, n) or Tukey’s test (d, e, f, g, i, j, l, m) . Exact P values are indicated.
Extended Data Fig. 9 |
Extended Data Fig. 9 |. LKB1 antagonizes OPA1 deficiency independent of mTOR and AMPK.
a) Immunoblot for phosphorylated and total AMPK and ACC in control and Opa1CD4Cre Th17 cells. ACTIN: sample processing control. Graph, relative signal intensity (n = 4, 2 independent experiments). b) IL-17A expression in control and Opa1CD4Cre CD4+ TN cells cultured in Th17 conditions and Compound C from day 0 (d0) or from day 3 to 4 (d3) and restimulated (n = 3). c) Left, immunoblot for AMPK and OPA1 in T cells transfected with Cas9 and indicated gRNAs and cultured 5 days in Th17 conditions. ACTIN: sample processing control. Right, IL-17A expression in restimulated cells (n = 3 biological and transfection replicates). d) Expression of phosphorylated S6 (n = 8) and 4E-BP1 (n = 7 biological and transfection replicates), 2 independent experiments. e) IL-17A expression in T cells transfected with Cas9 and indicated gRNAs and cultured in Th17 conditions 2 days followed by 48 h rapamycin treatment (n = 3 biological and transfection replicates). f) Phosphorylated H2Ax expression (n = 6, 2 independent experiments). g) Cyclic AMP (cAMP) levels (LC-MS, n = 8, 2 independent experiments). h) Basal calcium levels (n = 8, 2 independent experiments). i) Mitochondrial ROS (mitoSOX, n = 3). j) Control and Opa1CD4Cre CD4+ TN cells cultured in Th17 conditions 1 day followed by 2 day inhibitor-treatment. Graph, IL-17A MFI log2 FC inhibitor-treated vs. vehicle-treated cells (n = 7 biological replicates, except Tempol: n = 4 and NAC: n = 3, 2 independent experiments). Representative plots and graphs summarize results of at least two independent experiments, except noted otherwise. Data (ai) are means ± s.e.m. Unpaired two-tailed t-test (a, f, g, h, i), two-sided Tukey’s test (b, c, d) or šidák’s test (e, j). Exact P values are indicated.
Extended Data Fig. 10 |
Extended Data Fig. 10 |. LKB1 couples TCA cycle and serine metabolism to Th17 effector function.
a) Principal component analysis (PCA) of the transcriptome of control and Opa1CD4Cre CD4+ TN cells transfected with Cas9 and indicated gRNAs, cultured 4 days in Th17 conditions (n = 3 biological and transfection replicates). b) Volcano plots of the differentially expressed genes (DEG, FC > 1, p-value < 0.001) for the comparisons: control gStk11 vs. control gCtl (left) and Opa1CD4CregStk11 vs. Opa1CD4CregCtl (right). Blue dots annotate the highest 40 DEG. c, d, KEGG pathway and Gene Ontology (GO) annotation analysis from DEG (FC>1, p-value<0.001) between (c) control gStk11 vs. control gCtl or (d) Opa1CD4CregStk11 vs. Opa1CD4CregCtl. e) Intracellular serine in control and Opa1CD4Cre CD4+ TN cells transfected with Cas9 and indicated gRNAs (n = 6 transfection replicates, 2 independent experiments) by LC-MS. f) Left, schematic shows 2-HG production from primary and promiscuous enzymatic reactions and the inhibitors used for targeting its production. Right, CD4+ TN cells from control and Opa1CD4Cre mice were cultured under Th17 conditions for 1 day followed by 48 h inhibitor treatment. IL-17A expression was analyzed by flow cytometry in restimulated cells and expressed as log2 FC inhibitor-treated vs. vehicle-treated cells (CBR, AGI, NHI-2, GSK864: n = 7 per group; BAY, LW6: n = 3 per group). Graph summarizes data from 2 experiments. g) Kinetics of fractional labelling of glutamate (m + 5), α-ketoglutarate (m + 4), malate (m + 4) and fumarate (m+4) in control and Opa1CD4Cre CD4+ T cells transfected with Cas9 and indicated gRNAs cultured for 4 days in Th17 conditions and incubated with [U-13C]-Glutamine for the indicated times (n = 3 biological and transfection replicates). Data are means ± s.e.m. Two-sided šidák’s test (f) or Tukey’s test (e, g). Exact P values are indicated.
Fig. 1 |
Fig. 1 |. OPA1 is required for TH17 cell effector function.
a, Representative live-cell spinning disk microscopy images showing mitochondria (GFP, green) and nuclei (Hoechst 42, blue) in CD4+ T cells from PhAM mice cultured in T helper (TH) and Treg cell conditions on day 4. Two separate experiments. b, Immunoblot of OPA1, MFN2, MFN1, DRP1 (left) and ratio of l- and s-OPA1 isoforms (right) in TN, TH and Treg T cells on day 4. Tubulin is used as a sample processing control. c, Kinetics of OPA1 isoforms during TH and Treg differentiation. In b,c, TH1, TH2 and TH17: n = 5 biological replicates, Treg: n = 4 biological replicates and 3 independent experiments. d, Electron microscopy (left) and width of mitochondrial cristae (right). Control TH1: n = 442, control TH2: n = 401, control TH17: n = 418, control Treg: n = 421, Opa1Cd4-cre TH1: n = 615, Opa1Cd4-cre TH2: n = 786, Opa1Cd4-cre TH17: n = 554 and Opa1Cd4-cre Treg: n = 433 cristae, and 3 biological replicates. Data are shown as individual measurements and geometric mean (red bar). e, Left, oxygen consumption rate (OCR) on addition of oligomycin (oligo), fluoro-carbonyl cyanide phenylhydrazone (FCCP) and rotenone plus antimycin A (Rot + AA) (n = 7 injections, 3 biological replicates). Right, baseline OCR, ATP-coupled respiration and maximal respiration (n = 3 independent experiments). f, Basal glycolytic rate and total glycolytic capacity (n = 4 biological replicates), measured by extracellular acidification rate (ECAR). g, Cells expressing IFNγ, 1L-17A, GATA3 and FOXP3 following restimulation (n = 4 biological replicates). The percentage of cells in each quadrant is indicated. h, Heat map of cytokine expression in the supernatant of indicated cells types, shown as log2 fold change (FC) (n = 3 biological replicates). i, TBET and ROR-γT expression (n = 4 biological replicates). gMFI, geometric mean fluorescence intensity. Representative plots and graphs summarize results of at least two independent experiments except where noted otherwise. Data in b,c,e-g,i are mean ± s.e.m. Two-sided Tukey’s test (b,d), Dunnett’s test (c), Šidak’s test (e,f) or unpaired two-tailed f-test (g,i). Exact P-values are indicated.
Fig. 2 |
Fig. 2 |. OPA1 deficiency in IL-17A-expressing cells ameliorates TH17-mediated autoimmune pathogenesis.
a, Immunoblot of CD4+TCRβ+ cells expressing enhanced yellow fluorescent protein (eYFP) (TH17 cells) isolated from control and Opa1Il17a-cre reporter mice. Actin is used as a loading control. b, Surface markers on CD4+TCRβ+eYFP+ cells and CD4+ TN cells (CD4+CD44lowCD62Lhigh) from small intestine lamina propria. c, Frequency of live CD4+TCRβ+eYFP+ cells in the small intestine lamina propria (LP) (control: n = 10, Opa1Il17a-cre: n = 10 mice), Peyer’s patches (PPs) (control: n = 7, Opa1Il17a-cre: n = 10 mice) and MLN (control: n = 8, Opa1Il17a-cre: n = 10 mice), 2 independent experiments. d,e, Mice were injected with anti-CD3 antibody every 48 h for 100 h. Frequency of CD4+TCRβ+eYFP+ cells (n = 5 mice) (d) and IL-17A expression in restimulated CD4+TCRβ+eYFP+ cells (e) (control: n = 7, Opa1Il17a-cre: n = 8 mice, 2 independent experiments). f, Mice were immunized with myelin oligodendrocyte glycoprotein (MOG) peptide and monitored for clinical disease score (n = 7 mice per group). g, Frequency of CD4+TCRβ+eYFP+ cells from brain, spinal cord (SC) and draining lymph nodes (dLNs) 20 days after immunization (n = 8 mice per genotype, 2 independent experiments). h, Expression of IL-17A and IFNγ in brain CD4+TCRβ+eYFP+ cells (control: n = 13, Opa1Il17a-cre: n = 9 mice, 2 independent experiments). ik, Expression of RORγt and TBET (i; n = 6 mice per genotype), Ki67 (j) and active caspase-3 (k) (n= 8 mice per genotype, 2 independent experiments) in CD4+TCRβ+eYFP+ cells from brain (i) and spinal cord (j ,k). Representative plots and graphs summarize results of at least two independent experiments, except where noted otherwise. Data are mean ± s.e.m. Two-sided šidák’s test (c,fh) or unpaired two-tailed t-test (d,e,ik). Exact P-values are indicated.
Fig. 3 |
Fig. 3 |. OPA1 modulates the TCA cycle and 2-HG for epigenetic control of TH17 cell function.
a, ingenuity pathway analysis of differentially regulated proteins (Opa1Cd4-creversus control TH17 cells; log10(P-value<1.3, log2FC >0.58)). b, Volcano plot of metabolite levels determined by liquid chromatography–mass spectrometry (LC-MS) analysis. The plot shows metabolites that are increased (blue) or decreased (red) in Opa1Cd4-cre versus control TH17 cells; FC>0.5 and log10(P-value) > 1. GSSG, oxidized glutathione. c, Heat map showing metabolite levels (log2FC) in control and Opa1Cd4-cre TH17 cells. d, Cellullar NADH/NAD+(left) and aspartate (right), determined by LC–MS. e, Schematic of central carbon metabolism. 3-PG, 3-phosphoglycerate; OAA, oxaloacetate. f, Fractional labelling of metabolites in TH17 cells cultured for 20 h with fully-labelled U-[13C]glucose on day 3 (left, n = 4 biological replicates per group) or U-[13C]glutamine (right, control: n = 3, Opa1Cd4-cre: n = 4 biological replicates). Colours along the top of the graph correspond to the scheme in e. g, Fractional labelling of serine and glycine from U-[13C]glucose. h, intracellular serine and glycine levels, determined by LC–MS. i, Fractional labelling of 2-HG from U-[13C]glutamine. j, IL-17A expression in CD4+ T cells cultured for 4 days in TH17 conditions after overnight treatment with metabolites (n = 6 biological replicates, 2 independent experiments). 2-OG, 2-oxoglutarate. k, Cell numbers (n = 7 biological replicates) and cytokine and transcription factor expression (n = 8 biological replicates) in cells cultured for 3 days in TH17 conditions with D-2-HG (black) or L-2-HG (blue) for the last 48 h, 2 independent experiments. I, Acetylation and methylation status of histone H3 lysine 4 (H3K4), lysine 9 (H3K9) and lysine 27 (H3K27) and DNA methylation. 5mC, 5-methylcytosine. m, Accessible chromatin regions as indicated by ATAC-seq. Representative plots and graphs summarize results of at least two independent experiments. Arrows indicate differentially accessible chromatin regions. a,g,i, n = 3 biological replicates. bd,h,l, n = 4 biological replicates. Data in d,fl are mean±s.e.m. Two-sided šidák’s test (f,g,i,k), Dunnett’s test (j) or unpaired two-tailed t-test (d,h,l). Exact P-values are indicated. *P<0.05, ****P<0.0001.
Fig. 4 |
Fig. 4 |. LKB1 couples TCA cycle and de novo serine metabolism for 2-HG production.
a, Top upstream regulators of differentially regulated proteins (Opa1Cd4-cre versus control TH17 cells; log10(P-value < 1.3, log2FC > 0.58, Ingenuity pathway analysis)). b, Immunoblot (left) and quantification (right) of LKB1 phosphorylation and expression (n = 5 biological replicates, 2 independent experiments). Actin is used as a sample processing control. c, 1L-17A expression in T cells transfected with Cas9 and indicated guide RNAs (gRNAs). gCtl, control guide RNA; gStk11, Stk11-targeting guide RNA. d, Basal OCR. e, Electron microscopy image (left) and width of mitochondrial cristae (right) (control gCtl: n = 214; control gStk11: n = 271, Opa1Cd4-cre gCtl: n = 236; Opa1Cd4-cre gStk11: n = 257 cristae, 3 biological replicates). Data are shown as individual measurements and geometric mean (black bar). f, 1L-17A expression in T cells transfected with Cas9 and indicated gRNAs, cultured in TH17 conditions for four days and treated overnight as indicated. g, Kyoto Encyclopedia of Genes and Genomes (KEGG) pathway annotation of differentially expressed genes (Opa1Cd4-cre gStkll versus Opa1Cd4-cre gCtl, P <0.001, log2FC > 1). h, Immunoblot in TH17 cells transfected with Cas9 and indicated gRNAs. Two replicate transfections shown . i, Detection of serine (m+3) in cells cultured for 6 h with U-[13C]glucose. j, 1L-17A expression in cells treated for 20 h with CBR-5884 on day 2. k, Detection of 2-HG (m+5) fractional labelling from U-[13C]glutamine. l,m, Intracellular NADH (l), succinate, fumarate, malate and 2-HG (m) detection by LC-MS. n, 2-HG (m+5) in cells cultured with U-[13C]glutamine. o, 1L-17A expression in Opa1Cd4-cre T cells transfected with Cas9 and indicated gRNAs, cultured in TH17 conditions for four days and treated overnight as indicated. Representative plots and graphs summarize results of at least two independent experiments, except where noted otherwise. Data a,d,e,g,i,k-o: n = 3 biological replicates per group; c,f,j: n = 4 biological replicates per group. Data in bd,f,io are mean ± s.e.m. Two-sided šidák’s test (b,f), Tukey’s test (ce,in) or Dunnett’s test (o). Exact P-values are indicated.

Comment in

References

    1. Buck MD, O’Sullivan D & Pearce EL T cell metabolism drives immunity. J. Exp. Med 212, 1345–1360 (2015). - PMC - PubMed
    1. Bailis W et al. Distinct modes of mitochondrial metabolism uncouple T cell differentiation and function. Nature 571, 403–407 (2019). - PMC - PubMed
    1. Xu T et al. Metabolic control of TH17 and induced Treg cell balance by an epigenetic mechanism. Nature 548, 228–233 (2017). - PMC - PubMed
    1. Giacomello M, Pyakurel A, Glytsou C & Scorrano L The cell biology of mitochondrial membrane dynamics. Nat. Rev. Mol. Cell Biol 21, 204–224 (2020). - PubMed
    1. Martinez-Reyes I & Chandel NS Mitochondrial TCA cycle metabolites control physiology and disease. Nat. Commun 11, 102 (2020). - PMC - PubMed

Publication types

MeSH terms