. 2022 Sep 28;12(1):16218.
doi: 10.1038/s41598-022-19013-x.

Multiparameter analysis of timelapse imaging reveals kinetics of megakaryocytic erythroid progenitor clonal expansion and differentiation

Affiliations

Multiparameter analysis of timelapse imaging reveals kinetics of megakaryocytic erythroid progenitor clonal expansion and differentiation

Vanessa M Scanlon et al. Sci Rep. .

Abstract

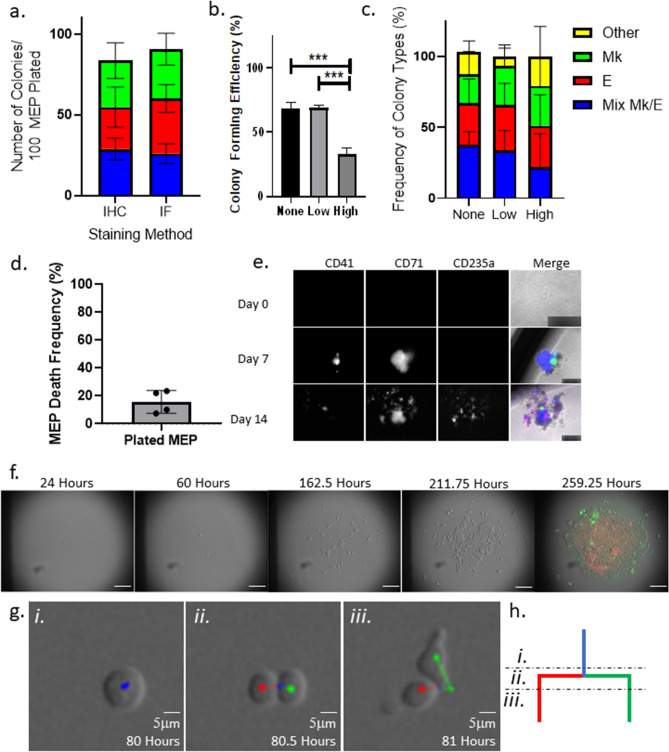
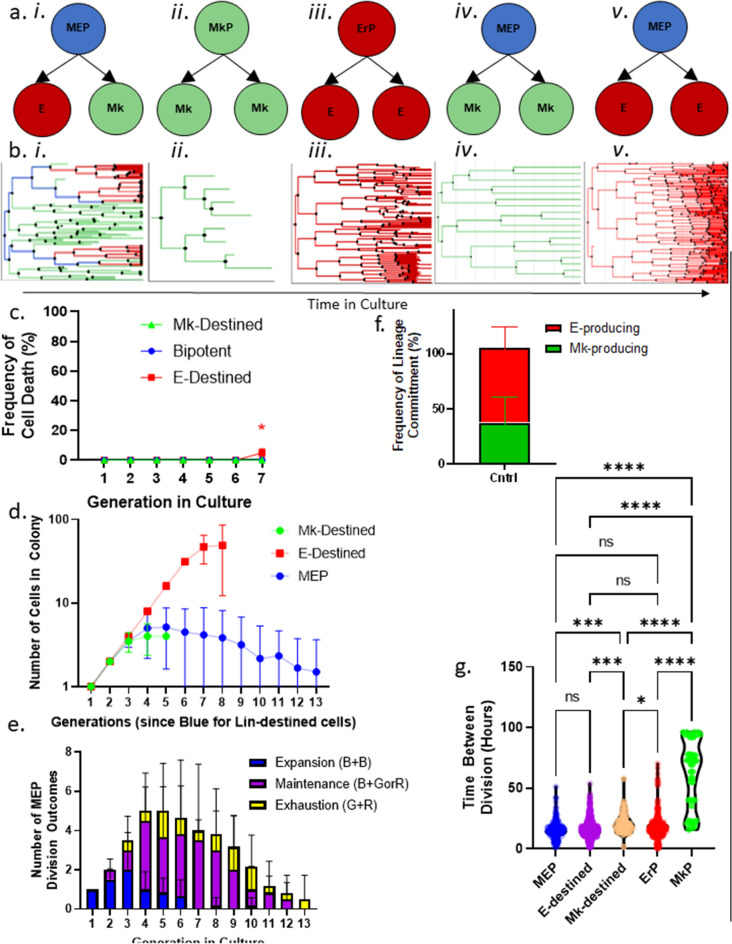
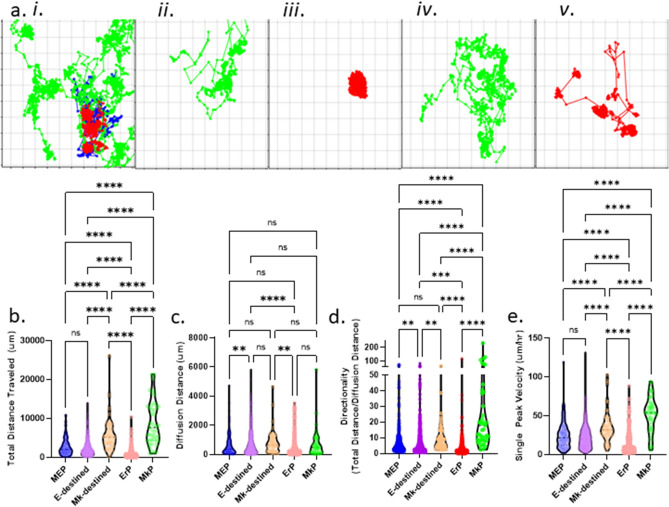
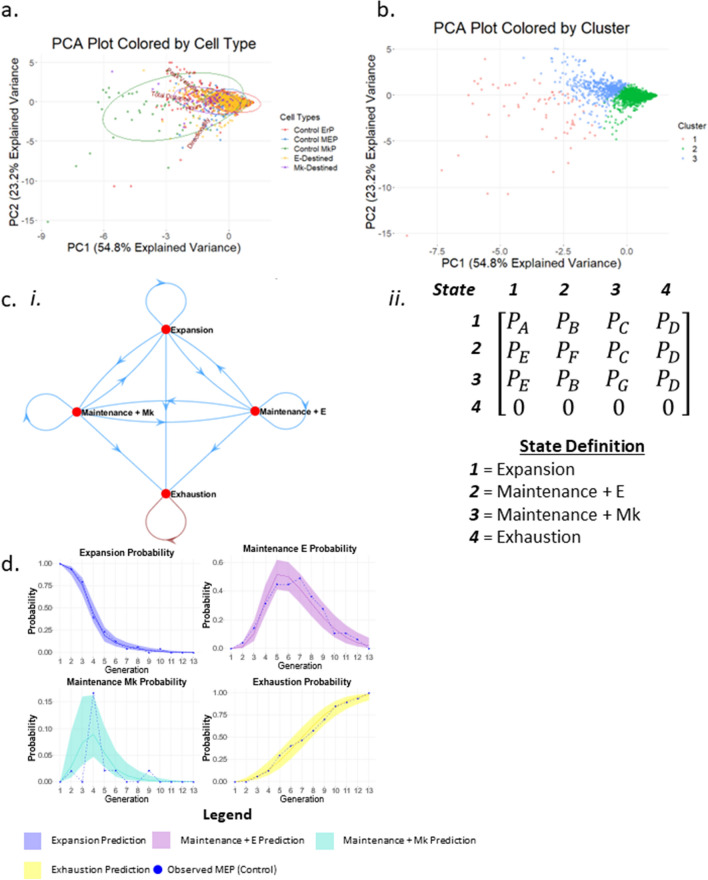
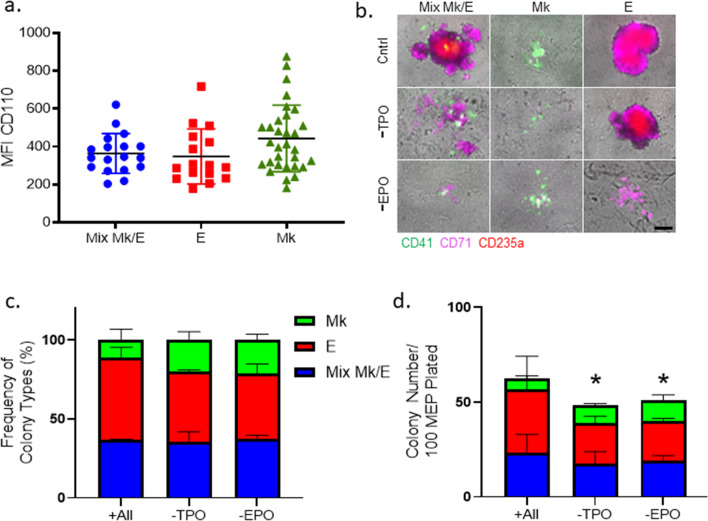
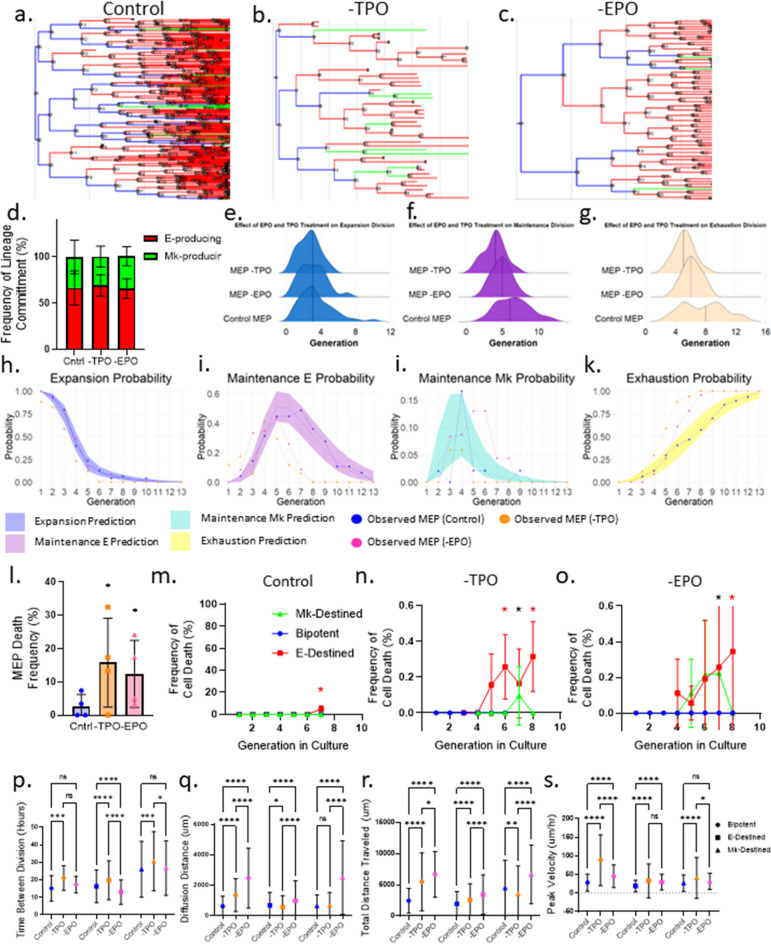
Single-cell assays have enriched our understanding of hematopoiesis and, more generally, stem and progenitor cell biology. However, these single-end-point approaches provide only a static snapshot of the state of a cell. To observe and measure dynamic changes that may instruct cell fate, we developed an approach for examining hematopoietic progenitor fate specification using long-term (> 7-day) single-cell time-lapse imaging for up to 13 generations with in situ fluorescence staining of primary human hematopoietic progenitors followed by algorithm-assisted lineage tracing. We analyzed progenitor cell dynamics, including the division rate, velocity, viability, and probability of lineage commitment at the single-cell level over time. We applied a Markov probabilistic model to predict progenitor division outcome over each generation in culture. We demonstrated the utility of this methodological pipeline by evaluating the effects of the cytokines thrombopoietin and erythropoietin on the dynamics of self-renewal and lineage specification in primary human bipotent megakaryocytic-erythroid progenitors (MEPs). Our data support the hypothesis that thrombopoietin and erythropoietin support the viability and self-renewal of MEPs, but do not affect fate specification. Thus, single-cell tracking of time-lapse imaged colony-forming unit assays provides a robust method for assessing the dynamics of progenitor self-renewal and lineage commitment.


Conflict of interest statement

The authors declare no competing interests.

Figures

Figure 1
Figure 1
Approach setup. (a) In situ immunofluorescence staining detects a similar number and ratio of colony types derived from individual MEPs. MEP CFU assays grown for 14 days were stained using either the traditional immunohistochemistry protocol or the in situ immunofluorescence protocol. Colonies were categorized based on the presence of cells stained with antibodies against lineage-specific markers. Three colony types were scored: Mk/E mixed colonies (blue), E-only colonies (red), Mk-only colonies (green). The average absolute colony counts per 100 plated MEPs by type are presented in stacked bar graphs. n ≥ 5. Mean and SD indicated. (b) MEP phototoxicity is avoided by reducing initial imaging frequency. Colony forming efficiency of MEPs grown for 7 days, calculated by the number of colonies observed out of the total plated cells is represented in the bar chart according to image acquisition settings. “None” represents colonies grown in the absence of imaging. “Low” represents colonies grown in the absence of imaging for the first 24 h, followed by imaging every 2 h for the next 36 h, and finally imaging every 10 min for the duration of colony growth. “High” represents colonies grown in the absence of imaging for the first 24 h followed by imaging every 10 min for the duration of colony growth. n ≥ 3; ***p < 0.01. Mean and SD indicated. (c) Low imaging frequency does not alter ratio of colony types grown from individual MEPs. Colony count normalized to the total number of colonies grown in each of the acquisition conditions. n ≥ 3; ***p < 0.01. Mean and SD indicated. (d) Frequency of MEP death with low imaging frequency. MEP death frequency was calculated as the number of MEPs that failed to give rise to a colony as observed in timelapse acquisitions normalized to the total number of imaged MEPs. n = 4. Mean and SD indicated. (e) Representative clonally growing MEPs stained with fluorescently conjugated anti-CD41, anti-CD71, and/or anti-CD235a during colony growth. Individual MEPs and colonies grown from individual MEPs were stained in situ with fluorescently conjugated antibodies against lineage markers at day 0, 7, and 14 of the CFU assays. Representative images of cells and colonies at the respective time points are shown for each channel (marker) and merged. Scale bars are set to 50 µm for day 0 and 250 µm for days 7 and 14. (f) Representative time-lapse sequence of an individual MEP forming a colony and in situ stained with anti-CD41 and anti-CD71. Selected time points during the acquisition are shown to demonstrate colony growth from an individual MEP. Scale bar = 100 μm. (g) Tracking MEP mitotic events with the Baxter algorithm. A representative image sequence capturing a tracked bipotent progenitor (i) undergoing cytokinesis (ii) and separating into daughter cells (iii). Scale bar = 5 μm. (h) Example of lineage tree branching reflecting a mitotic event. Illustration of lineage branching built by single-cell tracking of time-lapse sequences. Blue line represents a bipotent progenitor. Red line represents an E-destined daughter cell. Green line represents an Mk-destined daughter cell. Subsections of the lineage branch correspond with the representative tracked cells in (g).
Figure 2
Figure 2
Growth and differentiation. (a) Schematic representations of the sorted progenitors and resulting colony types. (i) Sorted MEPs that give rise to an Mk/E mixed colony. (ii) Sorted MkPs that give rise to an Mk-only colony. (iii) Sorted ErPs that give rise to an E-only colony. (iv) Sorted MEPs that give rise to an Mk-only colony. (v) Sorted MEPs that give rise to an E-only colony. (b) Corresponding representative lineage trees for each colony output. Blue lines represent MEPs, red lines represent E-destined cells, and green lines represent Mk-destined cells. Italic roman numerals correspond with (a). (c) Cell death rate by cell state in control culture conditions. Blue points represent bipotent cells (n = 222). Red points represent E-destined cells (n = 2035; p < 0.017). Green points represent Mk-destined cells (n = 165). Mean and SD indicated. (d) Expansion rates of cell types in time-lapse CFU assays. Cell number at each generation by cell state: MEP (blue), Mk-destined (green), and E-destined (red) cells grown in control conditions over 13 divisions (n = 6 movies). Mean and SD indicated. (e) Division outcomes by generation in culture. Absolute number of MEP division outcomes by generation in culture categorized as expansion (blue: 1 MEP → 2 MEP), maintenance (purple: 1 MEP → 1 MEP + 1 E- or Mk-destined progenitor), or exhaustion (yellow: 1 MEP → 1 E-destined progenitor + 1 Mk-destined progenitor) (n = 6 movies). Mean and SD indicated. (f) Frequency of MEP lineage commitment. Frequency of lineage commitment was calculated as the number of E- or Mk-destined daughter cells produced by MEPs in control timelapse CFU conditions (n = 6 movies). Mean and SD indicated. (g) Lifespan of cell states. Lifespan of cells categorized by state as defined in the timelapse CFU assays was measured by time between divisions in hours of bipotent MEP (blue; n = 188), E-destined (purple; n = 964), Mk-destined (orange; n = 49), committed ErP (red; n = 505), and committed MkP (green; n = 47) cells. *p < 0.05, **p < 0.01, ***p < 0.001, ****p < 0.0001, ns not significant.
Figure 3
Figure 3
Motility is a differential behavioral phenotype between progenitor cells undergoing state transitions. (a) Corresponding representative trajectory maps for each colony output. Cell trajectories were generated based on the x,y coordinates of cells in time-lapse CFU assays. Blue trajectories represent MEPs, red trajectories represent E-destined cells, and green trajectories represent Mk-destined cells. Italic roman numerals correspond with Fig. 2a. (b) Total distance traveled by cell state. Total distance was measured as the sum of the distance traveled by an individual cell between time points for the entire lifetime of the bipotent MEP (blue; n = 188), E-destined (purple; n = 964), Mk-destined (orange; n = 49), committed ErP (red; n = 505), and committed MkP (green; n = 47) cell. *p < 0.05, **p < 0.01, ***p < 0.001, ****p < 0.0001, ns not significant. (c) Diffusion distance traveled by cell state. Diffusion distance was measured as the shortest distance between the starting and ending position of the bipotent MEP (blue; n = 188), E-destined (purple; n = 964), Mk-destined (orange; n = 49), committed ErP (red; n = 505), and committed MkP (green; n = 47) cell at the end of their lifespan. *p < 0.05, **p < 0.01, ***p < 0.001, ****p < 0.0001, ns not significant. (d) Directionality of motility by cell state. Directionality was calculated by the ratio of total distance over diffusion distance of bipotent MEP (blue; n = 188), E-destined (purple; n = 964), Mk-destined (orange; n = 49), committed ErP (red; n = 505), and committed MkP (green; n = 47). *p < 0.05, **p < 0.01, ***p < 0.001, ****p < 0.0001, ns not significant. (e) Peak velocity by cell state. Peak velocity is reported as the single highest distance traveled between two time frames over the time between frames for the bipotent MEP (blue; n = 188), E-destined (purple; n = 964), Mk-destined (orange; n = 49), committed ErP (red; n = 505), and committed MkP (green; n = 47) cell. *p < 0.05, **p < 0.01, ***p < 0.001, ****p < 0.0001, ns not significant.
Figure 4
Figure 4
Quantitative behavioral phenotypes predict cell state. (a) Clustering of cells based on multi-dimensional analysis. Individual cells are graphed on PCA plots based on all quantified behavioral phenotypes (peak velocity, total distance, lifespan, and directionality) and color coded based on cell state: bipotent MEP (blue), E-destined (orange), Mk-destined (purple), committed ErP (red), and committed MkP (green). (b) k-means clustering of PCA plots. Three clusters were generated by k-means clustering. (c) Markov chains depicting cell state transitions of MEPs in CFU culture conditions. (i) Markov chains most accurately encompass the cell state transitions MEPs were observed to undergo. States include expansion, maintenance + E, maintenance + Mk, and exhaustion. (ii) The matrix used to derive the mathematical model to predict MEP state transitions. (d) Probability of MEP state transitions. The probability that MEPs will undergo four division types (expansion, maintenance + E, maintenance + Mk, exhaustion) by generation in culture is represented by the solid lines in each graph with a 95% confidence interval represented by the colored shadowed regions. Actual observed frequencies of each division outcome by generation are depicted by the dotted lines.
Figure 5
Figure 5
Thrombopoietin and erythropoietin do not instruct MEP lineage commitment. (a) Index sorting and analysis of TPO receptor, c-Mpl (CD110). MEPs were index sorted into 96-well plates and grown in CFU assay conditions for 14 days. Colony type outcome was correlated with expression of CD110 at the time of sorting/plating. n = 66. Mean and SD indicated. (b) Representative colonies grown from individual MEPs in control, -TPO, and -EPO conditions. Mk/E mix, E-only, and Mk-only colonies were observed in control, -TPO, and -EPO CFU conditions at 14 days. Cells within the colony were stained in situ with CD41 (green), CD71 (magenta), and CD235a (red). Scale bar = 250 μm. (c) Frequency of colony types observed in control, -TPO, and -EPO CFU assays. Colony counts (Mk/E mix in blue, E-only in red, and Mk-only in green) were normalized to total colonies grown in control, -TPO, and -EPO conditions. n = 4. Mean and SD indicated. (d) Colony counts of MEPs grown in control, -TPO, and -EPO CFU assays. Colony counts (Mk/E mix in blue, E-only in red, and Mk-only in green) are reported out of 100 plated MEPs grown in control, -TPO, or -EPO CFU conditions. n = 4, *p < 0.05. Mean and SD indicated.
Figure 6
Figure 6
Thrombopoietin supports MEP self-renewal as well as survival of MEPs and all downstream lineage progenitors. (a) Representative lineage tree of Mk/E mixed colony grown in control conditions. Blue lines represent MEPs, red lines represent E-destined cells, and green lines represent Mk-destined cells. (b) Representative lineage tree of Mk/E mixed colony grown in -TPO conditions. Blue lines represent MEPs, red lines represent E-destined cells, and green lines represent Mk-destined cells. (c) Representative lineage tree of Mk/E mixed colony grown in -EPO conditions. Blue lines represent MEPs, red lines represent E-destined cells, and green lines represent Mk-destined cells. (d) Frequency of MEP lineage commitment. Frequency of lineage commitment was calculated as the number of E- or Mk-destined daughter cells produced by MEPs normalized to 100% in control, -TPO, and -EPO timelapse CFU conditions (n ≥ 3 movies). Mean and SD indicated. (e) Distribution of MEP expansion divisions over time in culture. Distribution of MEP expansion divisions in control, -TPO, or -EPO conditions. The mean is represented by a solid vertical line (n ≥ 3 movies). (f) Distribution of MEP maintenance divisions over time in culture. Distribution of MEP expansion divisions in control, -TPO, or -EPO conditions. The mean is represented by a solid vertical line (n ≥ 3 movies). (g) Distribution of MEP exhaustion divisions over time in culture. Distribution of MEP expansion divisions in control, -TPO, or -EPO conditions. The mean is represented by a solid vertical line (n ≥ 3 movies). (h) Probability of MEP expansion divisions. The probability that MEPs will undergo expansion divisions by generation in culture is represented by the solid line with a 95% confidence interval represented by the colored shadowed region. Actual observed frequency of expansion division outcome by generation is depicted by the dotted line. (i) Probability of MEP maintenance + E divisions. The probability that MEPs will undergo maintenance + E divisions by generation in culture is represented by the solid line with a 95% confidence interval represented by the colored shadowed region. Actual observed frequency of maintenance + E division outcome by generation is depicted by the dotted line. (j) Probability of MEP maintenance + Mk divisions. The probability that MEPs will undergo maintenance + Mk divisions by generation in culture is represented by the solid line with a 95% confidence interval represented by the colored shadowed region. Actual observed frequency of maintenance + Mk division outcome by generation is depicted by the dotted line. (k) Probability of MEP exhaustion divisions. The probability that MEPs will undergo exhaustion divisions by generation in culture is represented by the solid line with a 95% confidence interval represented by the colored shadowed region. Actual observed frequency of exhaustion division outcome by generation is depicted by the dotted line. (l) Frequency of MEP death in control, -TPO, and -EPO CFU conditions. MEP death frequency was calculated as the number of MEPs that failed to give rise to a colony as observed in time-lapse acquisitions normalized to the total number of imaged MEPs for control, -TPO, and -EPO conditions (n ≥ 3, *p < 0.05). Mean and SD indicated. (m) Cell death rate by cell state in control culture conditions. Blue points represent bipotent cells. Red points represent E-destined cells (*p < 0.05). Green points represent Mk-destined cells (n = 6 movies). Mean and SD indicated. (n) Cell death rate by cell state in -TPO culture conditions. Blue points represent bipotent cells. Red points represent E-destined cells (*p < 0.05). Green points represent Mk-destined cells (*p < 0.05, n = 4 movies). Mean and SD indicated. (o) Cell death rate by cell state in -EPO culture conditions. Blue points represent bipotent cells. Red points represent E-destined cells (*p < 0.05). Green points represent Mk-destined cells (*p < 0.05, n = 3 movies). Mean and SD indicated. (p) Lifespan of cell states by culture condition. Lifespan of cells categorized by state as defined in the time-lapse CFU assays was measured by time between divisions in hours of bipotent MEP (circles), E-destined (squares), Mk-destined (triangles), in control (blue), -TPO (orange), and -EPO (pink) conditions. (*p < 0.05, **p < 0.01, ***p < 0.001, ****p < 0.0001, ns not significant, 55 ≤ n ≤ 2035). Mean and SD indicated. (q) Total distance of cell states by culture condition. Total distance traveled by cells categorized by state as defined in the timelapse CFU assays of bipotent MEP (circles), E-destined (squares), Mk-destined (triangles), in control (blue), -TPO (orange), and -EPO (pink) conditions. n for each condition and cell state is listed below each graph. *p < 0.05, **p < 0.01, ***p < 0.001, ****p < 0.0001, ns not significant, 55 ≤ n ≤ 2035. Mean and SD indicated. (r) Diffusion distance of cell states by culture condition. Diffusion distance of cells categorized by state as defined in the timelapse CFU assays of bipotent MEP (circles), E-destined (squares), Mk-destined (triangles), in control (blue), -TPO (orange), and -EPO (pink) conditions. n for each condition and cell state is listed below each graph. *p < 0.05, **p < 0.01, ***p < 0.001, ****p < 0.0001, ns not significant, 55 ≤ n ≤ 2035. Mean and SD indicated. (s) Peak velocity of cell states by culture condition. Peak velocity of cells categorized by state as defined in the time-lapse CFU assays of bipotent MEP (circles), E-destined (squares), Mk-destined (triangles), in control (blue), -TPO (orange), and -EPO (pink) conditions. n for each condition and cell state is listed below each graph. *p < 0.05, **p < 0.01, ***p < 0.001, ****p < 0.0001, ns not significant 55 ≤ n ≤ 2035. Mean and SD indicated.

References

    1. Lu Y-C, et al. The Molecular signature of megakaryocyte-erythroid progenitors reveals a role for the cell cycle in fate specification. Cell Rep. 2018;25:2083–2093.e4. doi: 10.1016/j.celrep.2018.10.084. - DOI - PMC - PubMed
    1. Debili N, et al. Characterization of a bipotent erythro-megakaryocytic progenitor in human bone marrow. Blood. 1996;88:1284–1296. doi: 10.1182/blood.V88.4.1284.bloodjournal8841284. - DOI - PubMed
    1. Sanada C, et al. Adult human megakaryocyte-erythroid progenitors are in the CD34+CD38mid fraction. Blood. 2016;128:923–933. doi: 10.1182/blood-2016-01-693705. - DOI - PMC - PubMed
    1. Xavier-Ferrucio J, et al. Low iron promotes megakaryocytic commitment of megakaryocytic-erythroid progenitors in humans and mice. Blood. 2019;134:1547–1557. doi: 10.1182/blood.2019002039. - DOI - PMC - PubMed
    1. Bouilloux F, et al. EKLF restricts megakaryocytic differentiation at the benefit of erythrocytic differentiation. Blood. 2008;112:576–584. doi: 10.1182/blood-2007-07-098996. - DOI - PubMed

Publication types