. 2022 Oct;25(10):1366-1378.
doi: 10.1038/s41593-022-01166-7. Epub 2022 Sep 28.

The three-dimensional landscape of cortical chromatin accessibility in Alzheimer's disease

Affiliations

The three-dimensional landscape of cortical chromatin accessibility in Alzheimer's disease

Jaroslav Bendl et al. Nat Neurosci. 2022 Oct.

Abstract

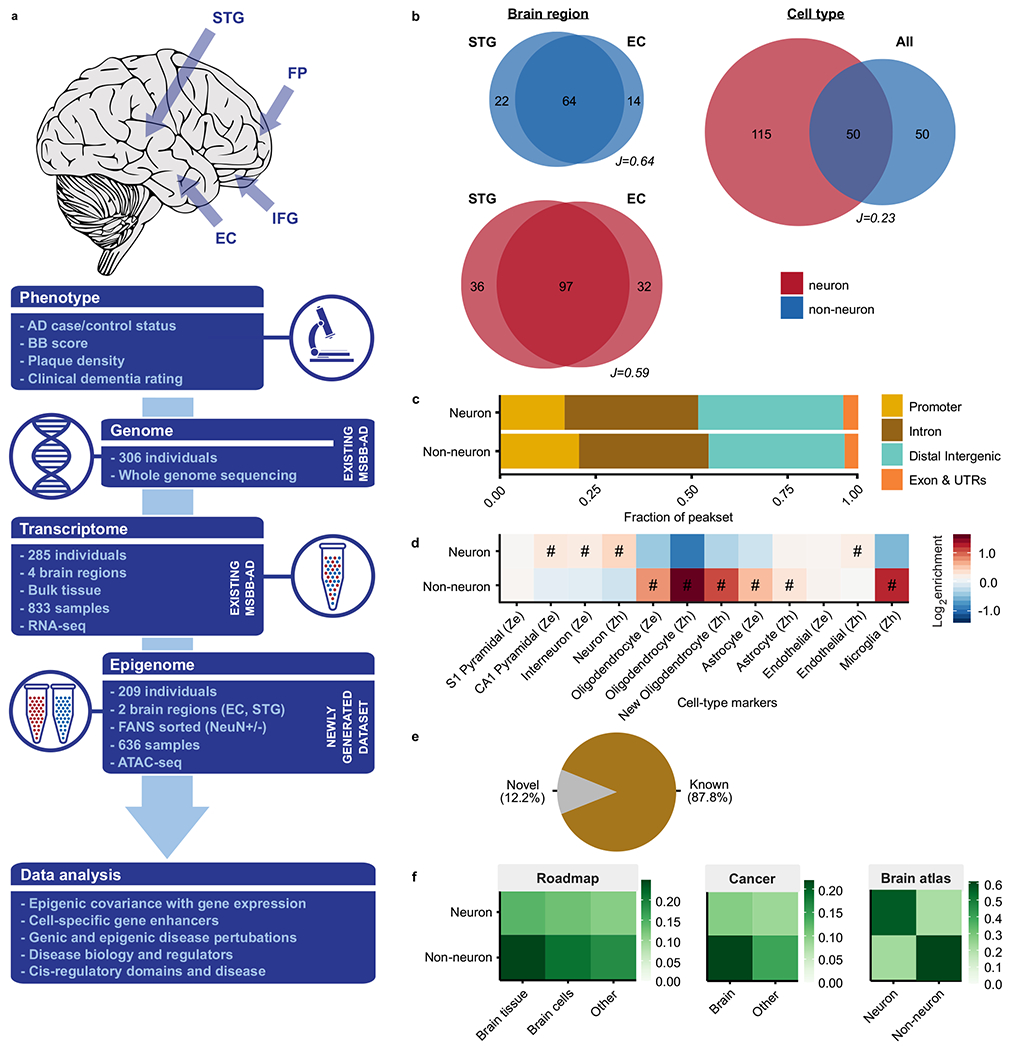
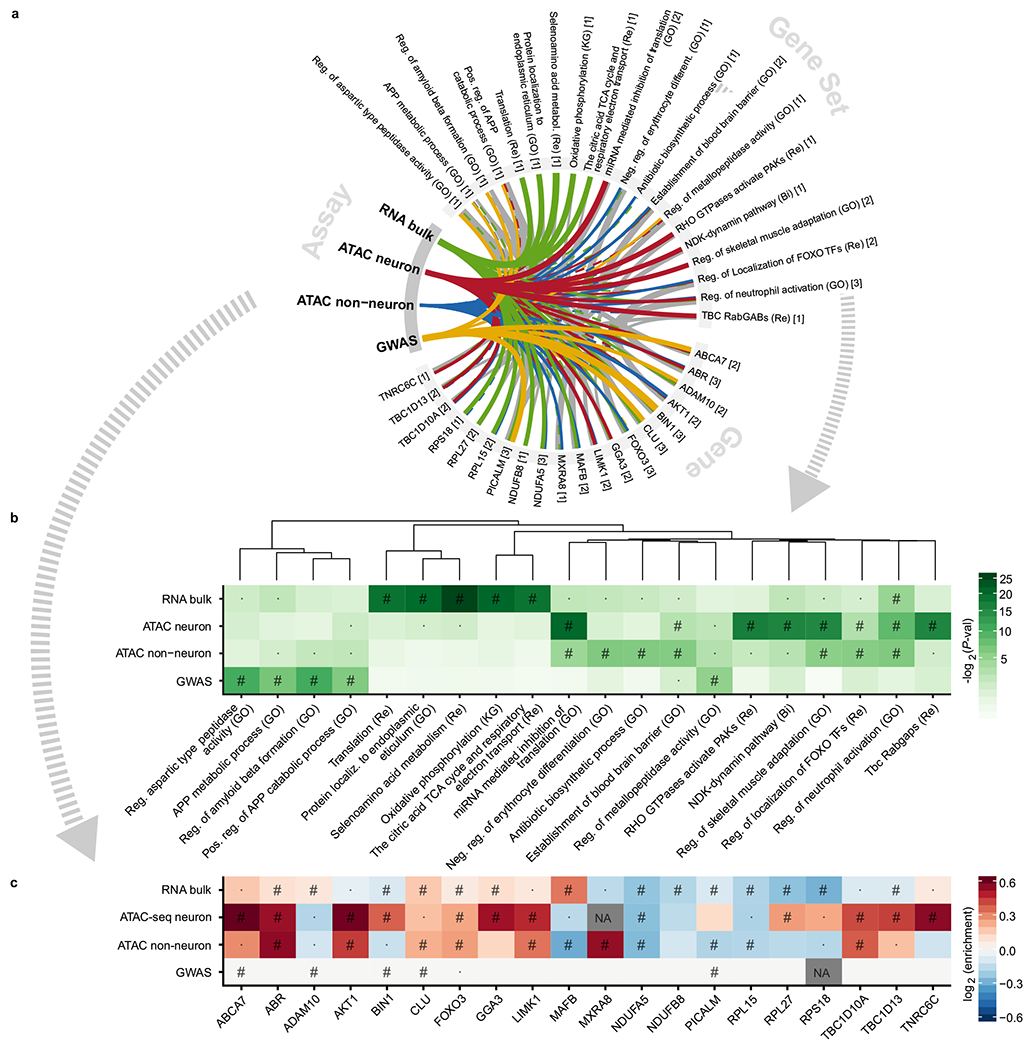
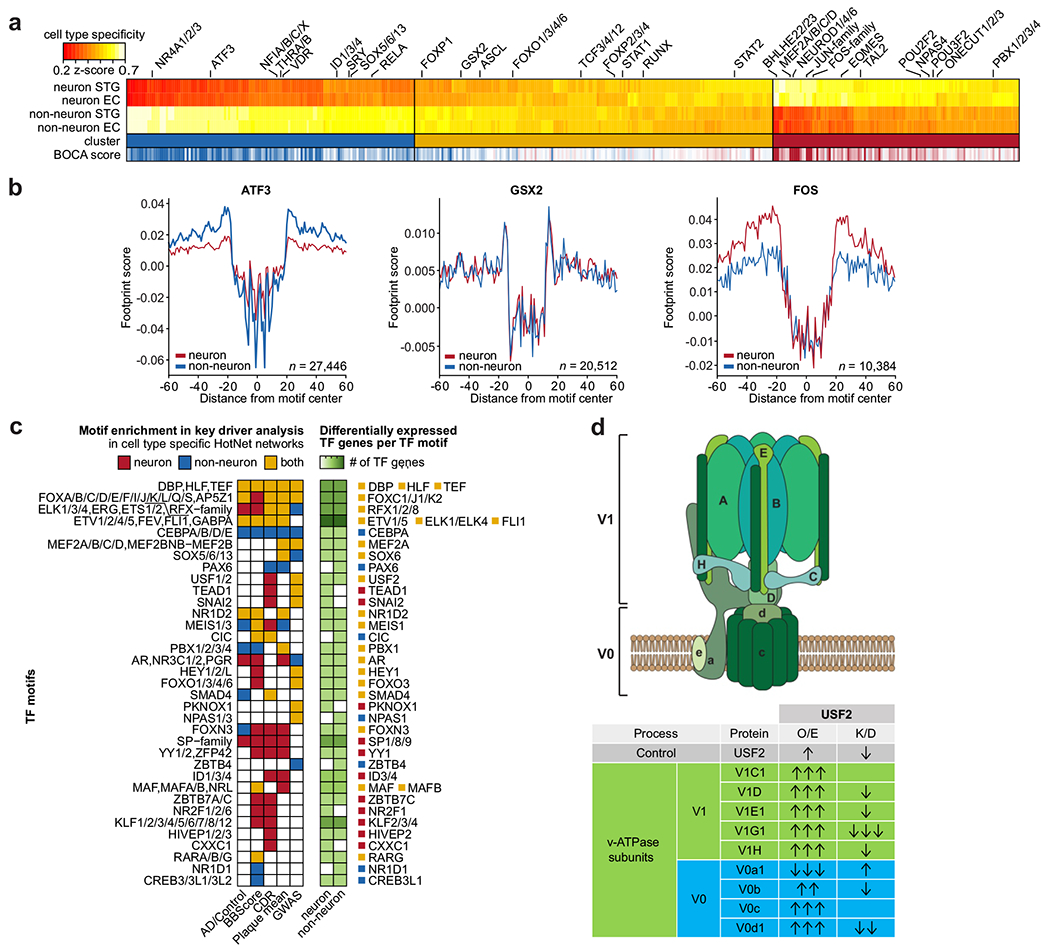
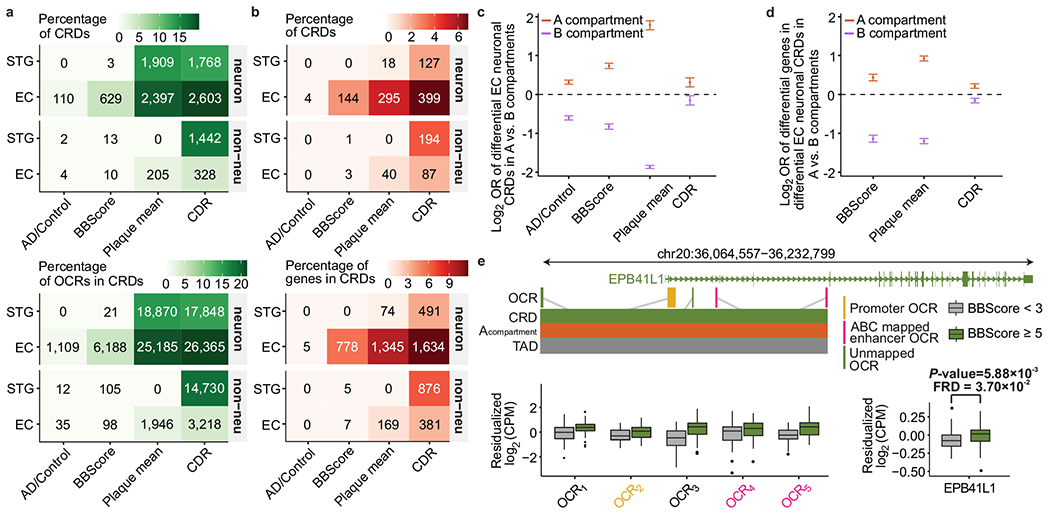
To characterize the dysregulation of chromatin accessibility in Alzheimer's disease (AD), we generated 636 ATAC-seq libraries from neuronal and nonneuronal nuclei isolated from the superior temporal gyrus and entorhinal cortex of 153 AD cases and 56 controls. By analyzing a total of ~20 billion read pairs, we expanded the repertoire of known open chromatin regions (OCRs) in the human brain and identified cell-type-specific enhancer-promoter interactions. We show that interindividual variability in OCRs can be leveraged to identify cis-regulatory domains (CRDs) that capture the three-dimensional structure of the genome (3D genome). We identified AD-associated effects on chromatin accessibility, the 3D genome and transcription factor (TF) regulatory networks. For one of the most AD-perturbed TFs, USF2, we validated its regulatory effect on lysosomal genes. Overall, we applied a systematic approach to understanding the role of the 3D genome in AD. We provide all data as an online resource for widespread community-based analysis.


Conflict of interest statement

Competing interests: The authors declare no competing interests.

Figures

Fig. 1 |
Fig. 1 |. Large-scale chromatin accessibility analysis in the human brain.
a, Description of the study design. ATAC-seq was performed on neuronal (NeuN+) and non-neuronal (NeuN−) nuclei isolated from two different brain regions (STG and EC) in MSBB-AD samples. Existing RNA-seq profiling in the same cohort was performed on bulk tissue derived from four different brain regions (EC, IFG, FP and STG). All samples have genomic and AD-related phenotypic data. b, Venn diagrams by cell type and brain region summarizing the overlap in megabases of OCRs. “J” indicates the Jaccard index between the respective OCRs. c, Proportions of neuronal and non-neuronal OCRs stratified by genomic context. d, Heatmap showing enrichment of cell-specific neuronal and non-neuronal OCRs with cell type specific markers from “Ze”: Zeisel and “Zh”: Zhang. OCRs were assigned to genes using the GREAT approach (Methods). “#”: Test wide significant at FDR<0.05 “ · ”: Nominally significant at P-value<0.05. e, Novelty of OCRs compared to known OCRs from the union of three broad human tissue OCR resources,,, and four brain OCR resources,,,. f, Overlap of neuronal and non-neuronal OCRs with sets of selected reference studies,,, (comparisons with all reference studies in Supplementary Fig. 6).
Fig. 2 |
Fig. 2 |. Variance component analysis of gene expression.
a-b, The analysis was built upon (a) neuronal and (b) non-neuronal open chromatin datasets. Genes, i.e., columns, are sorted by decreasing proportion of variance explained by epigenome (enhancer and promoter), with the mean variance explained by each component shown in parentheses. c, Comparison of variance explained by each component across all RNA-seq genes. A Wilcoxon two sided signed-rank test was used to test the differences between models using neuronal and non-neuronal ATAC-seq. Horizontal lines in the violin plot indicate median values.
Fig. 3 |
Fig. 3 |. Linking distal regulatory OCRs (OCRABC) to genes using Activity-By-Contact (ABC) method.
a, Histogram of the number of OCRABC linked per gene. b, Histogram of the number of genes linked per OCRABC. c, Histogram of distance of OCRABC to the TSS of regulated genes. d-e, Scatterplot of genomic distance vs ABC score of enhancer-gene links for (d) neurons and (e) non-neurons. The dashed black line denotes the minimum ABC score for an enhancer-gene link to be reported as a valid association. The solid yellow line indicates LOESS (local regression) fit. f, Histogram of the number of genes “skipped” by an OCRABC to reach their linked genes. g, Correlation between enhancer OCRs and promoter OCRs of linked genes from the ABC method, for links that did not meet the cut-off (low scores, OCRother) versus those that did (high scores, OCRABC). Neuronal dataset: n=4,578 OCRABC-OCRother pairs (P-value=8.7×10⁻¹⁴), non-neuronal dataset: n=4,763 OCRABC-OCRother pairs (P-value=6.3×10⁻¹³); P-value of the significance of difference is calculated from Fisher’s Z transformed correlations divided by the standard error of the difference of two z scores. Box plot centered on median, bounds defined between the 25th and 75th percentile with minimum and maximum defined as median ± 1.5 × interquartile range, whiskers extending to the lowest/highest value within this range and potential outliers from this are shown as dots. h, Schematic of CRISPRi system for transcription repression of distal enhancers. i, Expression levels of three genes after KRAB-dCas9-mediated repression of their ABC-predicted distal enhancers as determined with quantitative polymerase chain reaction (qPCR). Each experiment uses two single guide RNAs (sgRNAs), each performed in triplicate (n=6). P-values were determined by the two-tailed t-test (EEF1A2 P-value=9.75×10⁻⁹, DBN1: P-value=2.86×10⁻⁴, RPS21: P-value=3.87×10⁻⁹). Box plots are centered on median, bounds defined between the 25th and 75th percentile with minimum and maximum defined as median ± 1.5 × interquartile range, and whiskers extending to the lowest/highest value within this range.
Fig. 4 |
Fig. 4 |. Disease-associated chromatin changes.
a, Disease-associated OCRs stratified by cell type, brain regions, and AD-related phenotypes. b, Disease-associated OCRs stratified by brain regions or AD-related phenotypes. c, Genetic context of disease-associated OCRs (risk ratio calculated by unconditional maximum likelihood estimation and small sample adjustment; confidence interval calculated by normal approximation; neuronal OCRs n=61,454, 133,720, 143,925, 14,623; non-neuronal OCRs n=45,177, 75,050, 78,586, 7,888). d, Enrichment of common genetic variants in AD with disease-associated OCRs when assayed by LD-score regression. Only sets of OCRs covering at least 0.05% of the genome were tested. Positive coefficients signify enrichment, error bars indicate ± standard deviation from the mean, and both coefficients, and P-values were obtained directly from LD-score . “*”: FDR significant after correction across all tests. Neuronal OCRs: n=4,406 (P-value=0.658), 6,165 (P-value=0.398), 12,282 (P-value=0.658), 33,386 (P-value=0.501), 5,380 (P-value=0.066), 9,345 (P-value=0.064), 28,778 (P-value=0.146), 315,630 (P-value=0.217); non-neuronal OCRs n=2,085 (P-value=0.008), 4,122 (P-value=0.828), 9,514 (P-value=0.386), 205,120 (P-value=0.008). e, Correlation between disease-associated chromatin changes at promoters (ATAC-seq) and disease-associated changes in gene expression (RNA-seq) at the corresponding genes. Pearson correlations were used (95% confidence intervals calculated on Fisher’s Z transformation; P-values determined by two-sided t-test) and only comparisons with over 100 differential OCRs and genes were tested. Neuronal OCRs: n=200 (P-value=1.45×10⁻¹), 727 (P-value=3.77×10⁻²), 444 (P-value=8.01×10⁻¹), 2,072 (P-value=3.95×10⁻⁹), 4,180 (P-value=1.16×10⁻³), 307 (P-value=1.07×10⁻⁶), 691 (P-value=1.49×10⁻¹¹), 2,434 (P-value=6.85×10⁻³⁵); non-neuronal OCRs: n=79 (P-value=2.38×10⁻³), 89 (P-value=1.42×10⁻³), 404 (P-value=1.59×10⁻¹⁰), 1,212 (P-value=2.79×10−51), 151 (P-value=4.46×10⁻⁸), 2,300 (P-value=5.98×10−80). f, Examples of changes in chromatin accessibility and gene expression near the genes encoding NYAP1 and CCKBR.
Fig. 5 |
Fig. 5 |. Gene set enrichment analysis using general gene sets.
a-b, Top five gene sets of the four overall assays and the top genes within each. Thickness indicates the strength of association. A full line indicates significance at FDR<5%, whereas a dashed line indicates nominal significance (P-values were directly outputted from CameraPR). Grey lines between genes and gene sets indicate gene set membership and the thickness is inversely proportional to the size of the gene set. The numbers in square brackets indicate the number of assays in which the gene or gene set was found significant at FDR<5%. The gene sets are clustered based on the constituent member genes. FDR throughout is calculated for all tests within one assay (e.g. all contrasts analyzed in ATAC Neuron times the number of gene sets tested). c, Heatmap of fold changes in chromatin accessibility/gene expression and significance of change. The GWAS associations are genetic variants, which might increase, decrease or otherwise alter gene function. Thus no colors are applied to these. P-values were directly outputted from dream and for GWAS from MAGMA. “#” Significance at FDR<5%. “ · ”: Nominal significance. “NA”: not available. “Bi”: Biocarta. “GO”: Gene Ontology. “KG”: Kegg. “Re”: Reactome. The ApoE- and MHC-loci were excluded from the GWAS analysis, as is customary. Not all genes are directly linked to an OCR in neuron and non-neuron ATAC-seq.
Fig. 6 |
Fig. 6 |. Mapping of transcription factors to cell types and AD-related phenotypes.
a, Hierarchical clustering of TF motifs based on a cell type specificity score across neuronal and non-neuronal OCRs. High specificity scores indicate high specificity to the given cell type. The concordance with the Brain Open Chromatin Atlas is indicated as “BOCA score“ ranging from blue (strong non-neuronal signal) to red (strong neuronal signal). Select motifs are further described in Supplementary Table 14. b, Aggregated footprint scores across all potential TF binding sites for three motifs that represent the three major clusters of TFs according to cell type specificity. c, Overview of prioritized TF genes. The prioritized TF genes (i) belong to TF motifs whose neuronal and/or non-neuronal TFRNs are enriched in AD genes, (ii) show a significant correlation of their gene expression with their regulatory targets, and (iii) show significant AD-related dysregulation of their gene expression in at least one AD phenotype comparison. d, Top: Schematic of the V0 and V1 subunits of the v-ATPase complex responsible for maintaining lysosomal pH. Bottom: Summary of western blot data in SH-SY5Y human neuroblastoma cells stably overexpressing USF2 or transfected with siUSF2. Arrow direction indicates protein level increase or decrease, while the number of arrows represents statistical significance by Student’s two-tailed unpaired t-test, i.e. one arrow: P-value<0.05; two arrows: P-value<0.005; three arrows: P-value<0.0005. O/E: over-expressed; K/D: knocked-down.
Fig. 7 |
Fig. 7 |. Definition of neuronal and non-neuronal cis-regulatory domains.
a, An example of cis-regulatory domains in STG neurons identified by estimating the interindividual correlation structure between nearby OCRs. From top to bottom: genes that are present in the locus; a single Hi-C TAD (dark gray horizontal bar) and Hi-C loops (red arcs); OCRs (gray vertical bars); CRDs, where each colorbar represents a different regulatory domain; correlation matrix of OCRs including colored triangles that highlight CRDs. b, Number of CRDs stratified by cell type and brain region. The percentage is the fraction of OCRs within CRDs to the total number of OCRs. c, Venn diagrams by cell type and brain region summarizing the overlap of CRDs. “J” indicates the Jaccard index between the respective CRDs. d, CTCF density at and around CRD and TAD boundaries. e, Size distribution of cell type and region specific CRDs and cell type specific TADs. f, Associations of enhancer-promoter regions (ABC method) that are within the same CRDs. The odds ratios with their 95% confidence intervals are plotted as a function of the distance between enhancer and gene TSSs. P-values are estimated based on a two-sided Fisher’s exact test. CRD: cis-regulatory domain; TAD: topologically associating domain; kb: kilobase; and Mb: megabase.
Fig. 8 |
Fig. 8 |. Disease-associated perturbations in CRDs.
a, Counts of CRDs and OCRs within CRDs that are associated with AD-related phenotypes stratified by cell type and brain regions. b, Counts of CRDs and genes mapped to CRDs using the ABC model, that showed association with AD-related phenotypes in both epigenomic and transcriptomic levels using differential CRD test, stratified by brain region and cell type. c, Odds ratios of disease associated EC neuronal CRDs to be in A compartments vs. B compartments, measured for AD related phenotype: AD/Control: n=110 CRDs, P-value=5.25×10⁻³² (3.75×10−111); BBscore: n=629 CRDs, P-value=2.35×10−106 (1.15×10−128); Plaque mean: n=2,397 CRDs, P-value=2.37×10−199 (<10−200); CDR: n=2,603 CRDs, P-value=5.18×10⁻⁷ (1.30×10⁻²) in A(B) compartments. d, Odds ratios of disease associated genes in EC neuronal CRDs to be in A compartments vs. B compartments, measured for each AD related phenotype: 1) BBscore: n=778, P-value=6.17×10⁻²⁴ (5.0×10−142), 2) Plaque mean: n=1,345, P-value=1.3×10−181(1.3×10−282) and 3) CDR: n=1,634, P-value=6.58×10⁻¹³(9.93×10⁻⁷) in A(B) compartments. Odds ratios and P-values in c-d are estimated using two-sided Fisher’s exact test and error bars show upper and lower bounds of odds ratio at 95% confidence interval. e, Examples of changes in OCR expression (OCR1: P-value=4.20×10⁻⁴, FDR=5.67×10⁻²; OCR2: P-value=2.16×10⁻², FDR=2.56×10⁻¹; OCR3: P-value=5.26e×10−5, FDR=2.83×10⁻²; OCR4: P-value=3.08×10⁻¹ FDR=7.05e-1; OCR5: P-value= 2.59×10⁻⁴, FDR=4.8×10⁻²) and gene expression near the EPB41L1 gene (P-value=5.88×10⁻³, FDR=3.7×10⁻²) in BBScore associated CRD in EC neurons. P-values and FDR values were directly outputted from dream. Box plot centered on median, bounds defined between the 25th and 75th percentile with minimum and maximum defined as median ± 1.5 × interquartile range, whiskers extending to the lowest/highest value within this range and potential outliers are shown as dots.

References

    1. Andrews SJ, Fulton-Howard B & Goate A Interpretation of risk loci from genome-wide association studies of Alzheimer’s disease. Lancet Neurol. 19, 326–335 (2020). - PMC - PubMed
    1. Marzi SJ et al. A histone acetylome-wide association study of Alzheimer’s disease identifies disease-associated H3K27ac differences in the entorhinal cortex. Nat. Neurosci 21, 1618–1627 (2018). - PubMed
    1. Klein H-U et al. Epigenome-wide study uncovers large-scale changes in histone acetylation driven by tau pathology in aging and Alzheimer’s human brains. Nat. Neurosci 22, 37–46 (2019). - PMC - PubMed
    1. Gasparoni G et al. DNA methylation analysis on purified neurons and glia dissects age and Alzheimer’s disease-specific changes in the human cortex. Epigenetics Chromatin 11, 41 (2018). - PMC - PubMed
    1. Li P et al. Epigenetic dysregulation of enhancers in neurons is associated with Alzheimer’s disease pathology and cognitive symptoms. Nat. Commun 10, 2246 (2019). - PMC - PubMed

Methods-only references

    1. Haroutunian V, Katsel P & Schmeidler J Transcriptional vulnerability of brain regions in Alzheimer’s disease and dementia. Neurobiol. Aging 30, 561–573 (2009). - PMC - PubMed
    1. Morris JC et al. The Consortium to Establish a Registry for Alzheimer’s Disease (CERAD). Part I. Clinical and neuropsychological assessment of Alzheimer’s disease. Neurology 39, 1159–1165 (1989). - PubMed
    1. Buenrostro JD, Wu B, Chang HY & Greenleaf WJ ATAC-seq: a method for assaying chromatin accessibility genome-wide. Curr. Protoc. Mol. Biol 109, 21.29.1–21.29.9 (2015). - PMC - PubMed
    1. Dobin A et al. STAR: ultrafast universal RNA-seq aligner. Bioinformatics 29, 15–21 (2013). - PMC - PubMed
    1. Zhang Y et al. Model-based analysis of ChIP-Seq (MACS). Genome Biol. 9, R137 (2008). - PMC - PubMed

Publication types