

doi: 10.1038/s41593-022-01170-x.
Epub 2022 Sep 28.
Oligodendrocyte precursor cells engulf synapses during circuit remodeling in mice
Affiliations
- PMID: 36171430
- PMCID: PMC9534756
- DOI: 10.1038/s41593-022-01170-x
Item in Clipboard
Oligodendrocyte precursor cells engulf synapses during circuit remodeling in mice
Nat Neurosci.
2022 Oct.
Erratum in
-
Publisher Correction: Oligodendrocyte precursor cells engulf synapses during circuit remodeling in mice.Nat Neurosci. 2022 Dec;25(12):1735. doi: 10.1038/s41593-022-01209-z. Nat Neurosci. 2022. PMID: 36344700 Free PMC article. No abstract available.
Abstract
Oligodendrocyte precursor cells (OPCs) give rise to myelinating oligodendrocytes throughout life, but the functions of OPCs are not limited to oligodendrogenesis. Here we show that OPCs contribute to thalamocortical presynapse elimination in the developing and adult mouse visual cortex. OPC-mediated synapse engulfment increases in response to sensory experience during neural circuit refinement. Our data suggest that OPCs may regulate synaptic connectivity in the brain independently of oligodendrogenesis.
© 2022. The Author(s).
Conflict of interest statement
The authors declare no competing interests.
Figures
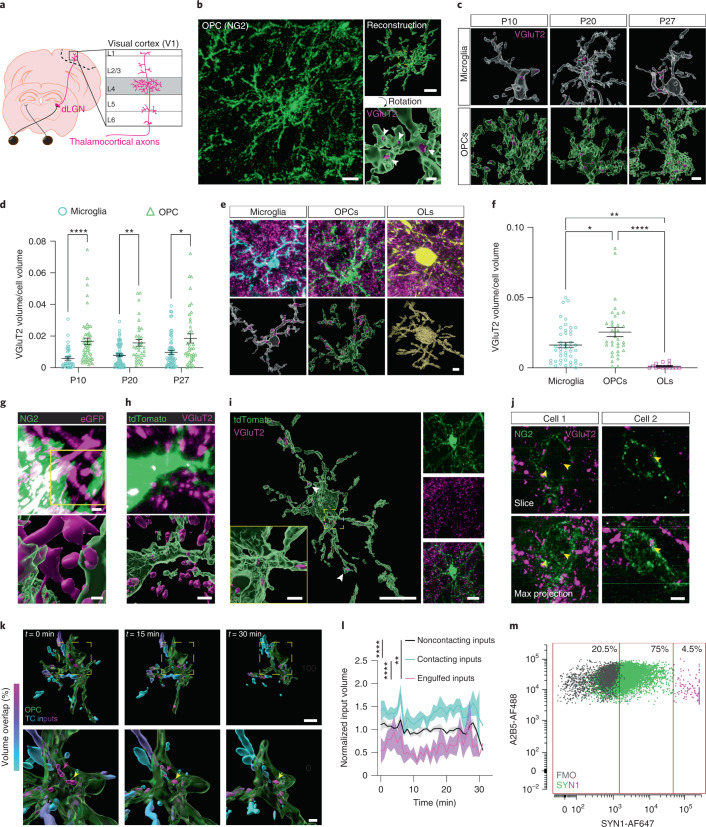
a, Schematic of TC inputs terminating in mouse V1. b, Confocal image and volumetric reconstructions of an OPC (NG2, green) containing TC inputs (VGluT2, magenta and white arrowheads). Scale bars, 10 μm, 5 μm (inset top) and 2 μm (inset bottom). c, Reconstructions of microglia (Iba1, white) and OPCs (NG2, green) containing TC inputs (VGluT2, magenta) during development. Scale bar, 5 μm. d, Quantification of synaptic material within microglia and OPCs. Two-way ANOVA with Geisser–Greenhouse correction (cell type: P < 0.0001; age: P = 0.6225; interaction: P = 0.1776) and Šídák multiple comparisons. n (microglia/OPCs): P10 = 38/53, P20 = 63/35 and P27 = 60/39, from three mice per group. e, Images and reconstructions of a microglia (Iba1, cyan), an OPC (green) and a mature oligodendrocyte (yellow) in an adult NG2-CreERT2tdTomato mouse, stained for TC inputs (VGluT2, magenta). Scale bar, 5 µm. OLs, oligodendrocytes. f, Quantification of the volume of synaptic material contained within microglia, OPCs and oligodendrocytes. One-way ANOVA (P < 0.0001) with Tukey’s posthoc test; n (microglia/OPCs/OLs) = 45/34/14 from three mice per group. g, Image and reconstruction of an OPC (NG2, pseudocolored green) containing AAV-hSYN-eGFP+ TC inputs (pseudocolored magenta). Scale bars, 2 μm. h, Image and reconstruction of an OPC (tdTomato, green) containing VGluT2-stained inputs (magenta). Scale bar, 2.5 μm. i, An OPC (tdTomato, green) and internalized inputs (VGluT2, magenta; white arrowheads) imaged on an Airyscan microscope. Scale bars, 10 µm, 1 µm (inset) and 10 µm (right). j, OPCs (NG2, green) and inputs (VGluT2, magenta; yellow arrowheads) imaged on a STED microscope. Scale bar, 2 µm. k, Reconstructions of an OPC (green) interacting with inputs colored based on the percentage of fluorescence overlap with the OPC (magenta 100% overlap, cyan 0% overlap). Images taken from a 30-min time-lapse session shown in Supplementary Video 1. Scale bars, 10 μm (top) and 5 μm (bottom). Yellow and magenta arrowheads indicate engulfed inputs that were present throughout or disappeared during the imaging session, respectively. l, Average volumes of inputs based on their contact with OPCs. Lines represent mean and shaded areas represent s.e.m. Two-tailed Friedman test (P < 0.0001) with Dunn’s multiple-comparison correction. n = 6 videos taken from three mice. m, Flow cytometry plot demonstrating presence of the presynaptic marker SYNAPSIN (SYN1hi) within OPCs (A2B5hi). FMO, fluorescence minus one control condition. Data points are colored based on the amount of SYN contained within each OPC. In d and f, individual data points are shown with bars representing mean ± s.e.m. *P < 0.05, **P < 0.01, ****P < 0.0001.

a, Confocal images and reconstructions of an OPC (tdTomato, pseudocolored green), LRP1 (cyan) and TC inputs (VGluT2). VGluT2 inputs with LRP1 in magenta, without LRP1 in white. Scale bars, 5 µm, 1 µm (inset) and 5 µm (fluorescence). b, Images and reconstruction of an OPC (tdTomato, green) containing the early phagosomal marker EEA1 (cyan) and TC inputs (VGluT2, magenta). Yellow arrowheads, colocalization between VGluT2 and EEA1. Scale bars, 2 µm, 1 µm (inset) and 4 µm (fluorescence). c, Reconstruction of an OPC (tdTomato, green) containing the late phagosomal marker Rab7 (cyan) and TC inputs (VGluT2, magenta). Yellow arrowheads, colocalization between VGluT2 and Rab7. Scale bars, 2 µm, 0.5 µm (inset) and 2 µm (fluorescence). d, Images and reconstruction of an OPC (tdTomato, green) containing TC inputs (VGluT2, magenta) and lysosomes (Lamp2, blue). White arrowheads, colocalization between VGluT2 and Lamp2. Scale bars, 2 µm, 1 µm (inset) and 2 µm (fluorescence). e, Images of an OPC (tdTomato, green), TC inputs (AAV-hSYN-eGFP, magenta) and Lamp2 (blue) taken on a structured illumination microscope alongside reconstructions. Scale bars, 16 μm, 1 μm (inset). (i), Increased magnification of inputs outside of Lamp2. Scale bar, 1 μm. (ii,iii), Orthogonal views of the OPC (green) containing inputs (white). Scale bar, 1 μm. f, Images and reconstructions of an OPC (NG2, green) containing TC inputs expressing AAV-hSYN-pSynDig (magenta and white) and an image of the pSynDig-expressing inputs within the volume of the OPC. Scale bars, 10 μm and 1 µm (inset). g, Quantification of pSynDig eGFP and mCherry signals within OPCs. Two-tailed ratio paired t-test, P = 0.0485; n = 25 cells from three mice. h, Images and reconstruction of an OPC (yellow) and pSynDig fluorescence signal (intact inputs, white; inputs being digested, magenta) taken on an Airyscan microscope. Lines demonstrate the location along the reconstructed OPC from which the cross-section image on the right was taken. In panels on the right, the OPC volume is outlined in yellow. Scale bars, 2 μm and 1 μm (cross-sections). *P < 0.05.

a, Schematic of the LDR visual deprivation and stimulation paradigm. b, Volumetric reconstructions of microglia (Iba1, white) and engulfed VGluT2+ inputs (magenta) in normally reared mice at P27 (control), mice dark-reared between P20 and P27 (LDR) and mice re-exposed to light for 10 h following LDR (LDR + 10). Scale bar, 2 μm. c, Quantification of the volume of synaptic material within microglia from each condition. One-way ANOVA (P > 0.05; NS, not significant); n (P27/LDR/LDR + 10): 28/49/64, from three mice per group. d, Reconstructions of OPCs (NG2, green) and engulfed synaptic inputs (VGluT2, magenta) from control, LDR, and LDR + 10 mice. Scale bar, 2 µm. e, Quantification of the volume of synaptic material contained within each OPC from control, LDR, and LDR + 10 mice. One-way ANOVA (P = 0.0199) with Tukey’s posthoc test; n (P27/LDR/LDR + 10): 20/30/42, from three mice per group. f, Reconstructions of OPCs (NG2, green) and engulfed TC inputs (VGluT2, magenta) in P27 mice following depletion of microglia using PLX5622 for 1 week. Scale bar, 2 μm. g, Quantification of the volume of synaptic material contained within each OPC in the presence or absence of microglia. Two-tailed Mann–Whitney t-test, P = 0.0082; n (control/PLX): 26/42, from three mice per group. h, Reconstructions of OPCs (NG2, green) and synaptic inputs (VGluT2, magenta) from LDR and LDR + 10 mice fed PLX5622 or control chow between P20 and P27. Scale bar, 2 μm. i, Quantification of synaptic engulfment in LDR and LDR + 10 mice containing or lacking microglia. Two-way ANOVA (stimulation: P < 0.0001; treatment: P < 0.05; interaction between stimulation and treatment: P < 0.05); n (OPCs, control/PLX): LDR = 45/52, LDR + 10 = 51/54, from three mice per group. In c,e,g, and i, individual data points are shown with bars representing mean ± s.e.m. *P < 0.05, **P < 0.01, ***P < 0.001 and ****P < 0.0001.
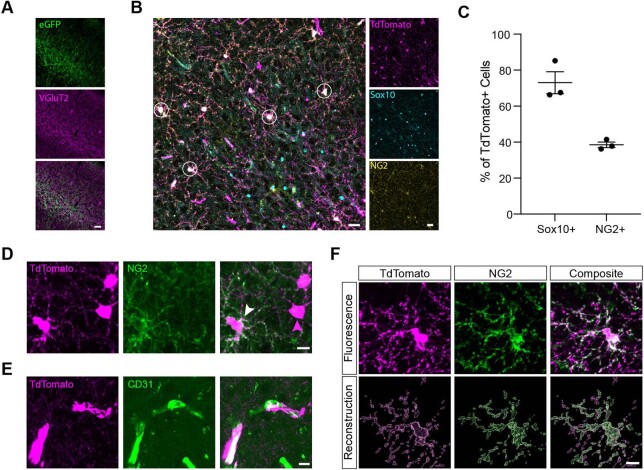
(a) Confocal images of TC axons and inputs in V1 labeled with AAV-hSYN-eGFP (green) and immunostained for VGluT2 (magenta). Scale bar, 40 μm. (b) Representative image of tdTomato+ cells (magenta) in the NG2-CreERT2tdTomato mouse line. Cells of the oligodendrocyte lineage immunostained for Sox10 (cyan) and the OPC marker NG2 (yellow). White circles, OPCs confirmed by co-expression of tdTomato and NG2. Scale bar, 20 μm. Fluorescence scale bar, 40 μm. (c) Quantification of the percentages of tdTomato+ cells that co-stain for Sox10 and NG2. Individual data points and mean ± s.e.m. shown; n = 3 mice per group. (d) High resolution images of tdTomato+ cells (magenta) immunostained for NG2 (green). White arrow, confirmed OPC in which tdTomato and NG2 signal overlap. Compared to other tdTomato+ cells (magenta arrow), OPCs can be distinguished by their bean-shaped somata. Scale bar, 10 μm. (e) Confocal images of tdTomato+ cells (magenta) co-localizing with blood vessels (CD31, green). These are likely pericytes and are easy to distinguish from OPCs based upon morphology. Scale bar, 10 μm. (f) High magnification image of a tdTomato+ OPC (magenta) immunostained for NG2 (green). Bottom, volumetric reconstructions of the same cell based upon tdTomato versus NG2 signal, demonstrating a high level of overlap between the two channels. Scale bar, 10 μm.

(a) Fluorescence images acquired on LSM710 (top row) and LSM900 Airyscan (bottom row) confocal microscopes with a 63x oil objective. In both, OPCs from the NG2-CreERT2tdTomato reporter line (pseudocolored in green) were imaged along with thalamocortical inputs (VGluT2, magenta). The Airyscan example is taken from Fig. 1. Scale bar, 10 µm. (b) Quantification of engulfment by OPCs with both imaging techniques show similar results despite the difference in resolution. Standard confocal data is replotted from Fig. 1. Two-tailed Unpaired t-test; P > 0.05; n (standard/Airyscan) = 36/12 cells from 3 mice per group.

(a) Left, confocal image of an OPC (tdTomato, green), thalamocortical (TC) inputs (VGluT2, magenta), and post-synaptic compartments (Homer1b/c, cyan). Points of colocalization between VGluT2 and Homer1b (white) represent intact synapses. Right, a reconstruction showing intact synapses within the OPC. Fluorescence scale bar, 10 µm. Reconstruction scale bar, 1 µm. (b) Quantification of the percentage of intact TC synapses within an OPC among all intact synapses in the imaging field. n = 16 cells from 3 mice. Individual data points shown with bars representing mean ± s.e.m.
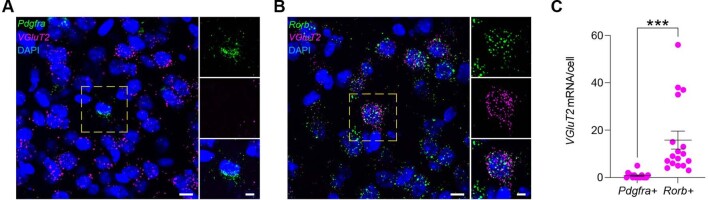
Representative confocal images of V1 sections following fluorescence in situ hybridization (FISH) probed for the OPC marker Pdgfra
(a) and the excitatory neuronal marker Rorb
(b), along with the mRNA encoding the presynaptic marker VGluT2 (magenta). DAPI shown in blue. Scale bar, 10 µm. Inset scale bar, 5 µm. (c) Quantification of the number of VGluT2 mRNA transcripts in each Pdgfra + OPC and Rorb + neuron in P27 mice. Unpaired two-tailed student’s T-test (P = 0.0005). Individual data points shown with bars representing mean ± s.e.m.; n (OPCs/neurons) = 16/17 from 3 mice. ***P <0.0005.

(a) Schematic of the in vivo two-photon imaging paradigm using AAV-hSYN-eGFP to label thalamocortical (TC) inputs in the NG2-CreERT2tdTomato reporter line. (b) In vivo two-photon image of a tdTomato+ OPC (green) and eGFP+ TC inputs (magenta). Scale bar, 10 μm. (c) Reconstruction of OPC shown in (B) (white) with inputs color coded based upon their distance to the OPC surface (engulfed in red, contacting in cyan, and non-contacting in magenta). Scale bar, 10 μm. (d) Inset of reconstruction shown in (C). Yellow arrow, engulfed input. Scale bar, 3 μm. (e,f) The number of TC inputs contacting individual OPCs normalized to OPC volume and the number of TC inputs contacting individual OPCs (13 OPCs from 5 mice). (g) In vivo two-photon image of a tdTomato+ OPC and eGFP+ TC inputs including XZ and YZ orthogonal projections. Scale bar, 5 μm. (h) Reconstruction of OPC shown in (g). OPC in green and inputs color coded based upon overlap between OPC and eGFP input signals as demonstrated by the volume overlap scale on the right. Scale bar, 3 μm. (i) In vivo two-photon image of a tdTomato+ OPC and eGFP+ TC inputs including XZ and YZ projections. Scale bar, 10 μm. (j) Cumulative frequency distribution of average input size of non-contacting, contacting, or engulfed inputs. Two-tailed Kruskal-Wallis test with Dunn’s post-hoc comparisons (engulfed vs. contacting P = 0.0001, engulfed vs. non-contacting P = 0.0354, contacting vs. non-contacting P > 0.05). (k) Quantification of the average volumes of synaptic inputs depending upon whether they contact OPCs, are engulfed by OPCs, or do not interact with OPCs. Two-tailed One-way ANOVA, P <0.0001 with Tukey post-hoc test (engulfed vs. contacting P = 0.0038, engulfed vs. non-contacting P = 0.5258, contacting vs. non-contacting P = 0.0412). n = 10, 12, and 12 OPCs from 5 mice for engulfed, contacting and non-contacting volumes. Data represented in histograms as mean ± s.e.m. *P < 0.05, **P < 0.01, ***P < 0.001.

(a) Representative gating strategy for OPCs and microglia. The cells were initially distinguished from debris by the expression of CD45 and PDGFRA proteins. Next, the CD45low and PDGFRAhi population were separately gated as follows: (Ai) single cells1 →single cells2 →viable cells →OPCs (PDGFRAhi+A2B5hi) and (Aii) microglia (Cd11bhi+CD45low). (Aiii) Back gating strategy was used as a reference for OPCs and microglia population between the different samples. n = 3 mice at P55. (b),(c) Flow cytometry plots showing immunoreactivity for SYNAPSIN and SNAP25 in both OPCs and microglia. An independent fluorescence minus one (FMO) control (grey) was used as a baseline to set the gate for the negative (SYN1/SNAP25 – negative) and positive (SYN1/SNAP25 – moderate and SYN1/SNAP25 – high) events. The highest mean fluorescence intensity in the microglia population was used to set the gate for the ‘high engulfers’ in OPCs (SYN1/SNAP25 – high, highlighted in magenta on the merged plot). (d),(e) Relative quantification of all positive events for SYN1 and SNAP25 in OPC and microglia populations. Two-tailed paired t-test, P > 0.05. Box plots show s.e.m., 25% quartile and median values. (f) UMAP showing a distinct OPC population with high immunoreactivity for SYN1 compared to the negative and moderate populations. All data represented is pooled data from three independent biological replicates.

(a),(b) Confocal images of V1 sections following fluorescence in situ hybridization (RNAscope) probed for the OPC marker gene Pdgfra (magenta) along with genes that encode known regulators of phagocytic engulfment and lysosomal function: Ptprj (green), Calcrl (yellow), Arsb (green), and Mertk (yellow). DAPI shown in blue. Sections from mice at P27 (a) or P90 (b). Scale bar, 20 μm. Inset scale bar, 5 μm. (c) Quantification of the number of mRNA molecules representing the genes visualized in (A) and (B) per Pdgfra + OPC at the P27 time point. Data plotted as the cumulative frequency distribution representing the percentage of OPCs (y-axis) expressing a given number of mRNAs by gene (x-axis). n = 20 OPCs (Arsb), 19 OPCs (Calcrl), 33 OPCs (Ptprj), and 31 OPCs (Mertk) from three mice per condition. (d)–(g) Uniform Manifold Approximation and Projection (UMAP) plots demonstrating cluster markers for OPCs (Pdgfra, D), mature oligodendrocytes (Mag, E), microglia (Cx3cr1, F), and astrocytes (Aqp4, G) in the single-cell dataset from Hrvatin et al., 2018. (h)–(k) UMAPs demonstrating the expression of engulfment-related genes across cell types. Note the shared expression of the genes between OPCs and other cell types that engulf synapses, including microglia and astrocytes. Also note the enrichment of each gene in OPCs compared to mature oligodendrocytes, which do not engulf synapses (see Fig. 1E,F).

(a) Schematic of the AAV-hSYN-pSynDig virus and confocal images demonstrating the quenching of eGFP fluorescence selectively within Lamp2+ lysosomes (white arrows). Scale bar, 5 μm. (b) Quantification of the mCherry and eGFP signal at inputs outside of and within lysosomes normalized to the mCherry signal. The eGFP signal was significantly decreased compared to mCherry signal only at inputs within lysosomes. Connected points represent data from one image. Two-tailed, two-way ANOVA (Signal: P > 0.05; Interaction between signal and localization: P > 0.05) with Tukey post-hoc test. n = 11 images from 3 mice. (c) Confocal image of layer 4 of V1 following viral infection of the dorsal lateral geniculate nucleus (dLGN) with AAV9-hSYN-pSynDig. Most pSynDig+ inputs show tight colocalization with the input marker VGluT2 (blue). White box, example region quantified in (d). White arrows, inputs that are positive for both mCherry and eGFP. Magenta arrow, input that is only positive for mCherry. Scale bar, 10 μm. Inset scale bar, 10 μm. (d) Quantification of fluorescence intensity across the line scan denoted by the white box in (c) for each channel separately, normalized to each channel’s respective maximum intensity. Note the high degree of overlap between mCherry and eGFP signal in the first two blue bars and mCherry alone in the last bar. Also note the presence of a VGluT2+ synapse represented by the black peak that precedes the first blue bar, which is likely derived from a dLGN neuron that was not infected with the pSynDig virus. (e) Confocal image of pSynDig+ inputs in V1. Scale bar, 20 μm. (f) Quantification of fluorescence intensities of eGFP and mCherry across the imaging frame shows a high degree of colocalization. (g) Quantification of Pearson’s coefficient describing the colocalization of mCherry and eGFP signal at inputs expressing pSynDig. Individual data points shown with bars representing mean ± s.e.m. n = 5 images from 3 mice.

(a) Reconstructions of OPCs (NG2, green) and engulfment loci (VGluT2, magenta) illustrating experience-dependent changes in the distribution of points of engulfment across the OPC arbor. Scale bar, 3 μm. (b) Quantification of the distance between the center of the OPC soma and loci at which engulfed inputs reside. Two-tailed one-way ANOVA (P = 0.0131) with Tukey’s post-hoc test; n (OPC; P27/LDR/LDR + 10): 19/31/46, from 3 mice per group. (c) Estimated range of synaptic surveillance by a given OPC based upon the bounding box volume calculated from the distribution of engulfment loci as quantified in (b). Two-tailed, one-way ANOVA (P = 0.0003) with Tukey’s post-hoc test; (OPC; P27/LDR/LDR + 10): 22/30/42, from 3 mice per group. *P < 0.05. ***P < 0.001.

(a) Representative confocal images of microglia immunostained for Iba1 (green) in the visual cortex before and during PLX5622 administration. Scale bar, 20 μm. (b) Quantification of the number of microglia in V1 following three days (Bi) or ten days (Bii) of PLX5622 administration. Unpaired two-tailed T test, P < 0.0001 . (c) Confocal images of V1 stained for GFAP, a marker of astrocyte activation, after ten days of PLX5622 administration. Scale bar, 20 μm. (d) Quantification of the mean GFAP intensity normalized to the control group (Di) and the normalized area covered by GFAP (Dii). Unpaired two-tailed T test, P >0.05. (e) Confocal images of V1 with OPCs (NG2, green) and the oligodendroglial marker Sox10 (magenta) after ten days of PLX5622 administration. Scale bar, 20 μm. (f) Quantification of the number of OPCs (marked by co-expression of NG2+ and Sox10+) (Fi) and the percentage of Sox10+ cells that also expressed the OPC marker NG2 (Fii). Unpaired two-tailed T test, P > 0.05 (g) Representative images of myelin (MBP, green) in mice after ten days of PLX5622 administration. Scale bar, 20 μm. (h) Quantification of the mean MBP intensity normalized to the control group (Hi) and quantification of the area covered by MBP (Hii). Unpaired two-tailed T test, P > 0.05. All graphs: Individual data points with mean ± s.e.m.; n = 3 mice per condition. (f) n = 12 images from 3 mice per condition. Individual data points shown with bars representing mean ± SEM. ***P < 0.001, ****P < 0.0001.
References
-
- Bergles, D. E., Roberts, J. D., Somogyi, P. & Jahr, C. E. Glutamatergic synapses on oligodendrocyte precursor cells in the hippocampus. Nature405, 187–191 (2000). - PubMed
Publication types
MeSH terms
Grants and funding
LinkOut - more resources
Full Text Sources
Molecular Biology Databases
Research Materials
