

Drivers of partially automated vehicles are blamed for crashes that they cannot reasonably avoid
- PMID: 36171437
- PMCID: PMC9519957
- DOI: 10.1038/s41598-022-19876-0
Drivers of partially automated vehicles are blamed for crashes that they cannot reasonably avoid
Abstract
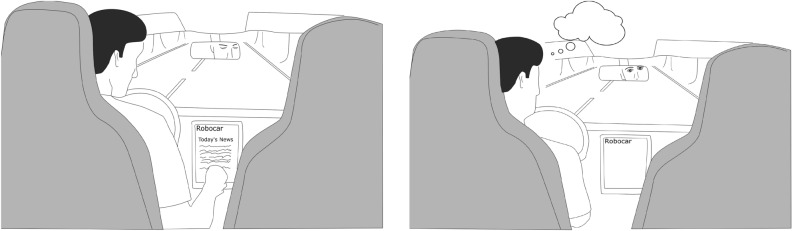
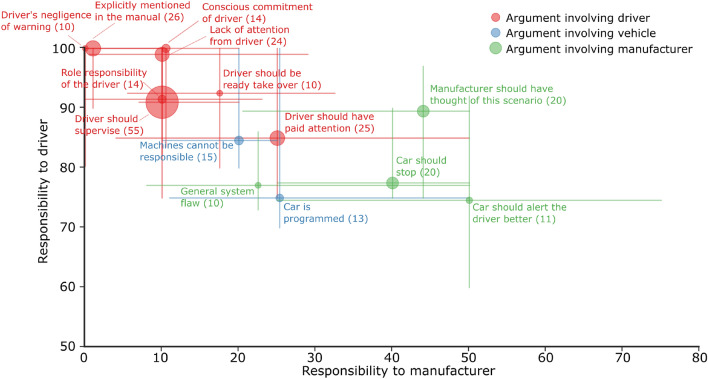
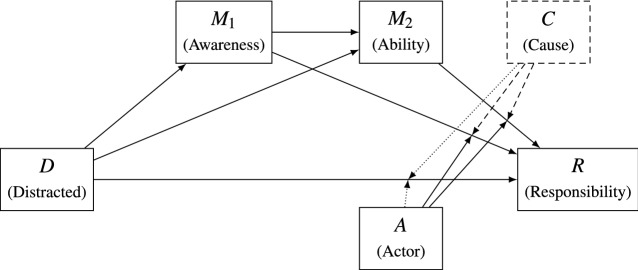
People seem to hold the human driver to be primarily responsible when their partially automated vehicle crashes, yet is this reasonable? While the driver is often required to immediately take over from the automation when it fails, placing such high expectations on the driver to remain vigilant in partially automated driving is unreasonable. Drivers show difficulties in taking over control when needed immediately, potentially resulting in dangerous situations. From a normative perspective, it would be reasonable to consider the impact of automation on the driver's ability to take over control when attributing responsibility for a crash. We, therefore, analyzed whether the public indeed considers driver ability when attributing responsibility to the driver, the vehicle, and its manufacturer. Participants blamed the driver primarily, even though they recognized the driver's decreased ability to avoid the crash. These results portend undesirable situations in which users of partially driving automation are the ones held responsible, which may be unreasonable due to the detrimental impact of driving automation on human drivers. Lastly, the outcome signals that public awareness of such human-factors issues with automated driving should be improved.
© 2022. The Author(s).
Conflict of interest statement
The authors declare no competing interests.
Figures


References
-
- National Transportation Safety Board. Collision Between a Sport Utility Vehicle Operating With Partial Driving Automation and a Crash Attenuator. Accident Report NTSB/HAR-20/01 PB2020-100112 (2018).
-
- National Transportation Safety Board. Collision Between Vehicle Controlled by Developmental Automated Driving System and Pedestrian, Tempe, Arizona, March 18, 2018. Technical Report NTSB/HAR-19/03, National Transportation Safety Board, Washington, DC, USA (2019).
-
- Crash Research & Analysis, I. Special Crash Investigations: On-Site Automated Driver Assistance System Crash Investigation of the 2015 Tesla Model S 70D. Technical Report DOT HS 812481. National Transportation Safety Board, Washington, DC, USA (2018).
Publication types
MeSH terms
LinkOut - more resources
Full Text Sources
