. 2022 Sep 28;23(1):56.
doi: 10.1186/s12868-022-00743-7.

Identification of a hippocampal lncRNA-regulating network in a natural aging rat model

Affiliations

Identification of a hippocampal lncRNA-regulating network in a natural aging rat model

Li Qi et al. BMC Neurosci. .

Abstract

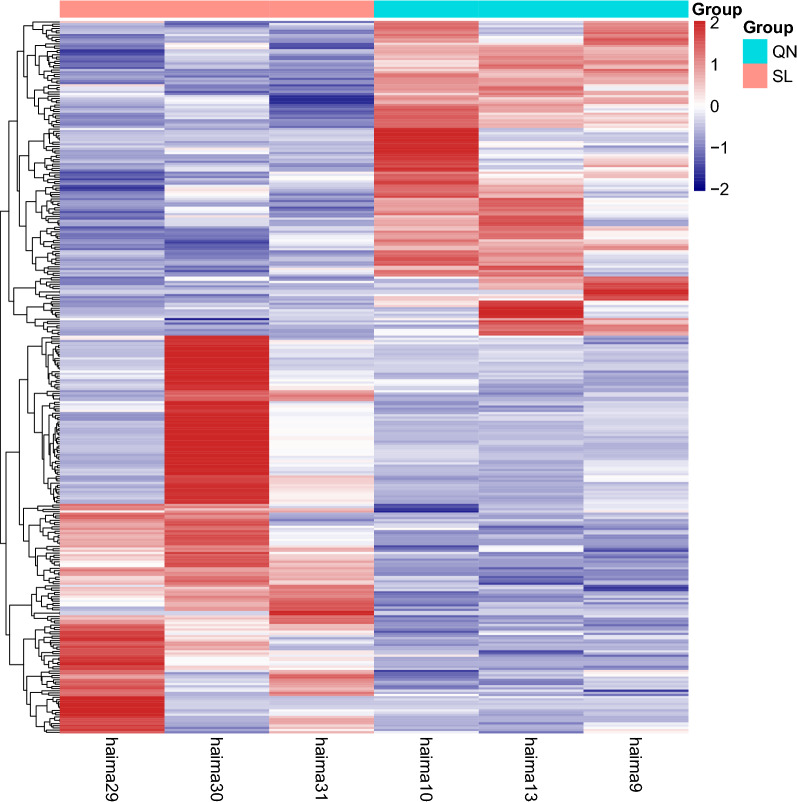
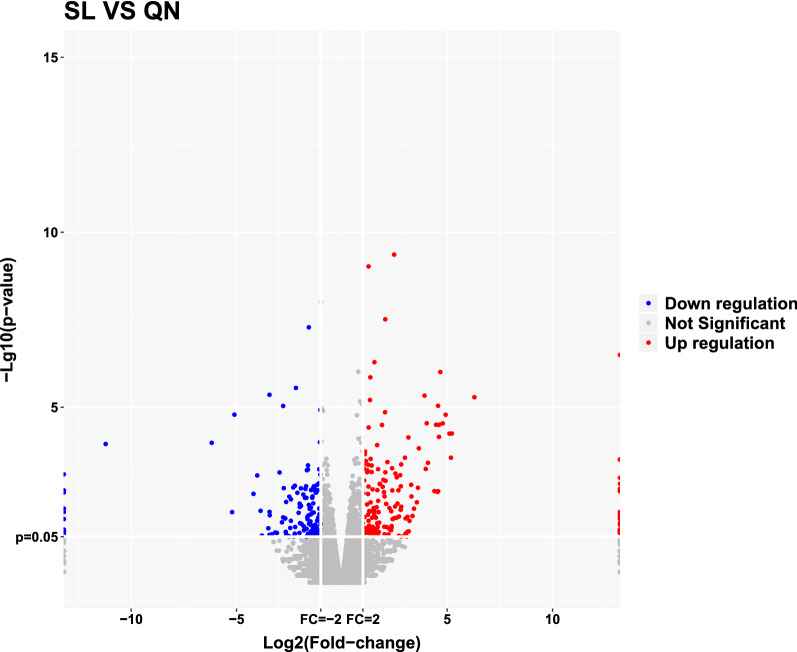
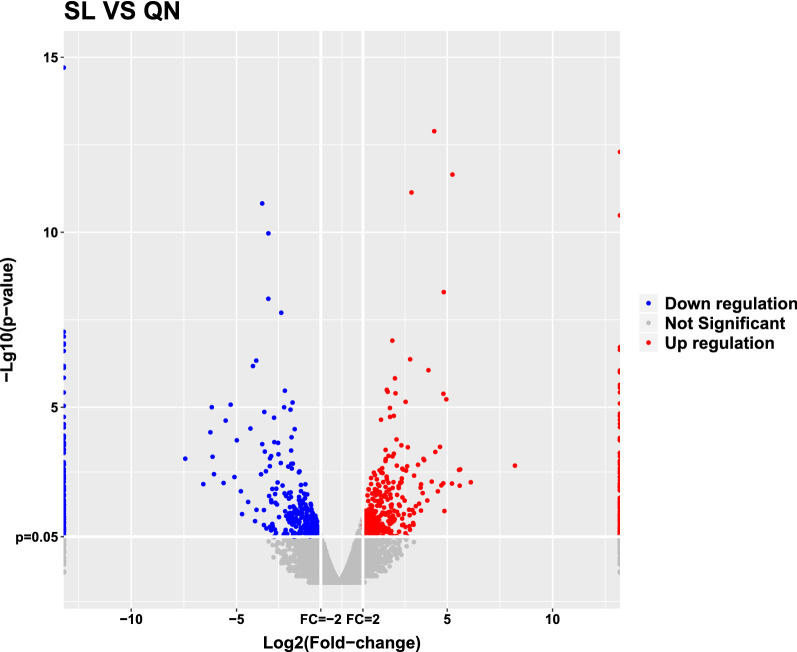
Background: Dysregulation of long noncoding RNA (lncRNA) expression is related to aging and age-associated neurodegenerative diseases, and the lncRNA expression profile in the aging hippocampus is not well characterized. In the present investigation, the changed mRNAs and lncRNAs were confirmed via deep RNA sequencing. GO and KEGG pathway analyses were conducted to investigate the principal roles of the clearly dysregulated mRNAs and lncRNAs. Subsequently, through the prediction of miRNAs via which mRNAs and lncRNAs bind together, a competitive endogenous RNA network was constructed.

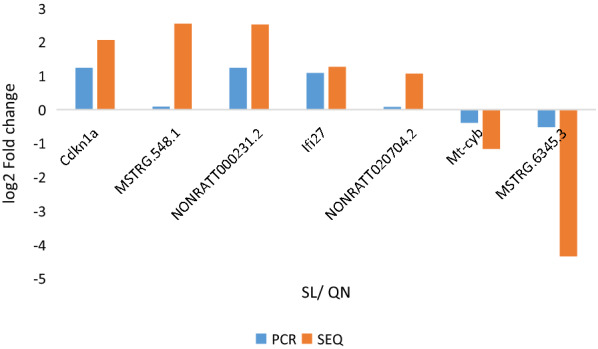
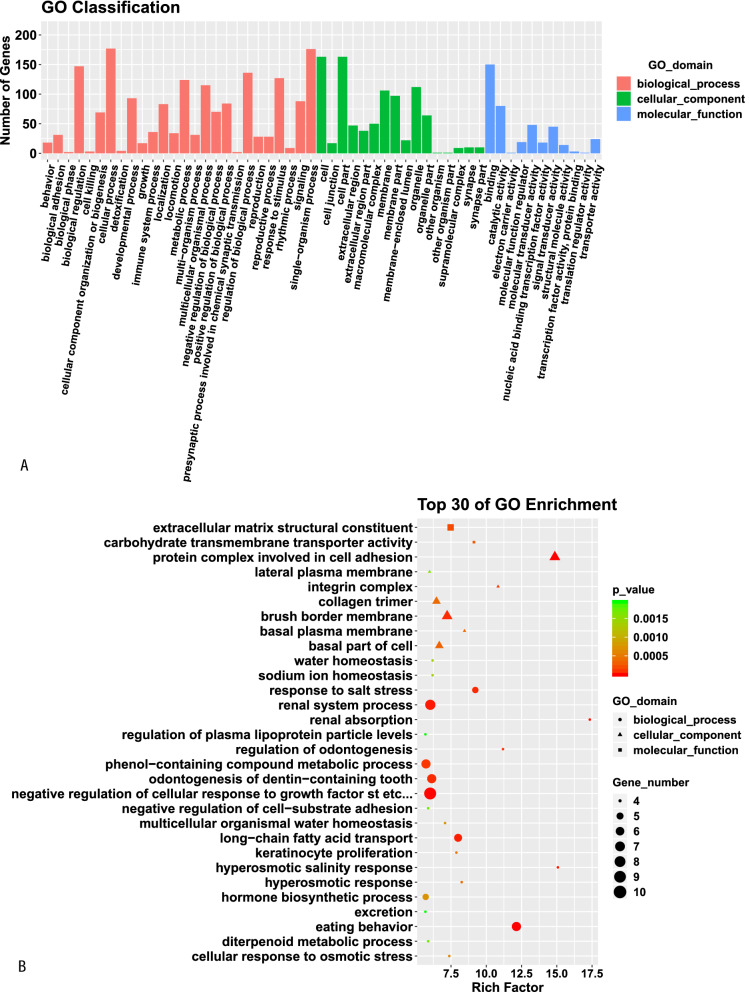
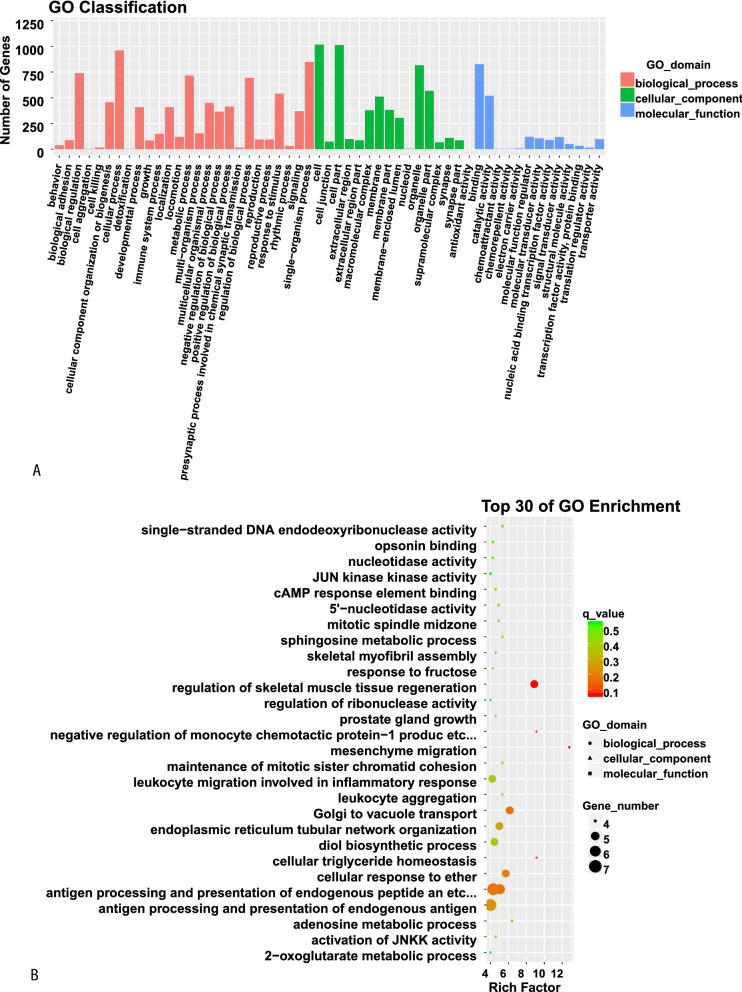
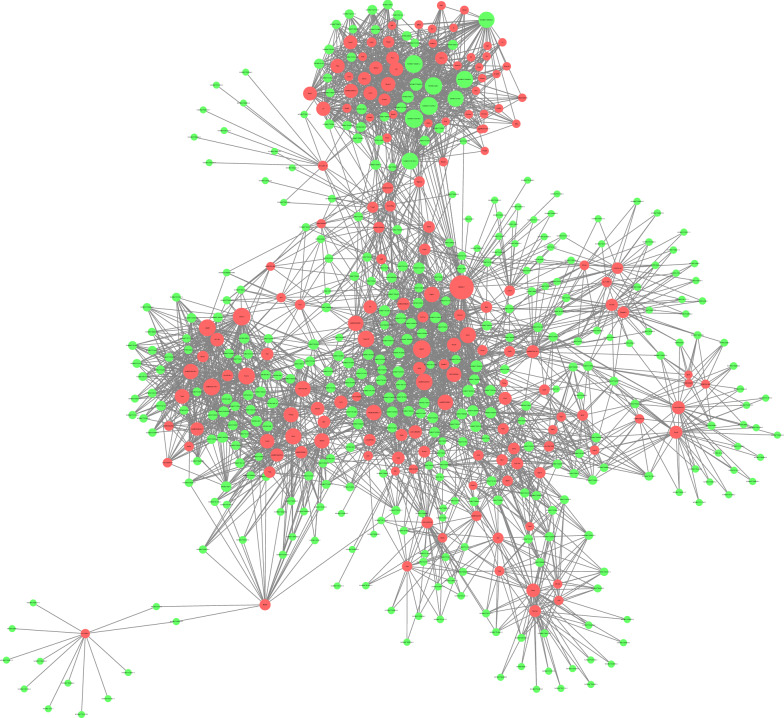
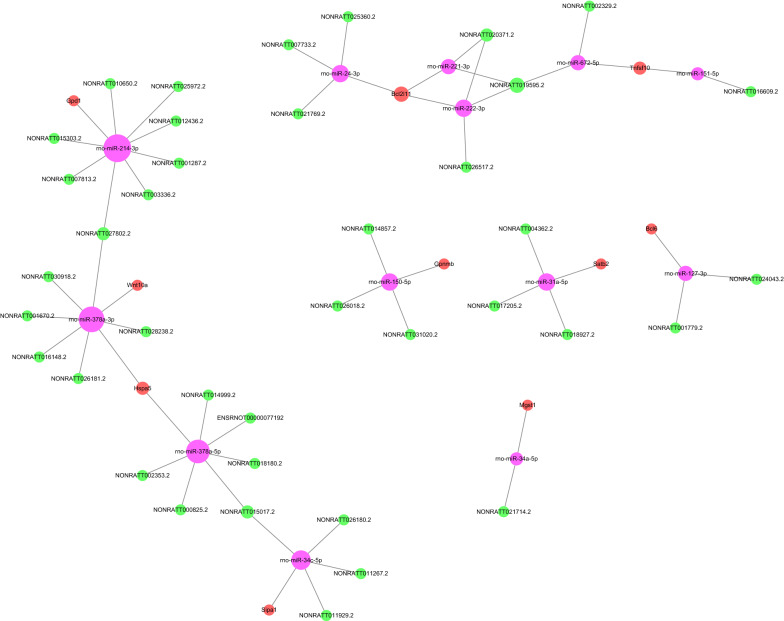
Results: A total of 447 lncRNAs and 182 mRNAs were upregulated, and 385 lncRNAs and 144 mRNAs were downregulated. Real-time reverse transcription-polymerase chain reaction validated the reliability of mRNA and lncRNA sequencing. KEGG pathway and GO analyses revealed that differentially expressed (DE) mRNAs were associated with cell adhesion molecules (CAMs), the p53 signaling pathway (SP), phagosomes, PPAR SP and ECM-receptor interactions. KEGG pathway and GO analyses showed that the target genes of the DE lncRNAs were related to cellular senescence, the p53 signaling pathway, leukocyte transendothelial migration and tyrosine metabolism. Coexpression analyses showed that 561 DE lncRNAs were associated with DE mRNAs. A total of 58 lncRNA-miRNA-mRNA target pairs were confirmed in this lncRNA‒miRNA‒mRNA network, comprising 10 mRNAs, 13 miRNAs and 38 lncRNAs.

Conclusions: We found specific lncRNAs and mRNAs in the hippocampus of natural aging model rats, as well as abnormal regulatory ceRNA networks. Our outcomes help explain the pathogenesis of brain aging and provide direction for further research.

Keywords: Aging; Hippocampus; lncRNAs; mRNAs.


Conflict of interest statement

The authors have stated no conflicts of interest.

Figures

Fig. 1
Fig. 1
Heatmap of all differentially expressed mRNAs in hippocampal tissues with aging. QN: 9-month control group; SL: aging group (n = 3). Each row represents one mRNA, and each column represents one hippocampal sample. The relative mRNA level is shown by the color scale. Red and blue colors represent high and low relative expression levels, respectively. The fold changes were normalized and scaled from − 2.0 to 2.0 by Z score
Fig. 2
Fig. 2
Volcano plot of differentially expressed mRNAs in the aging group and the 9-month control group. Normalized fold change and P values (aging group/9-month control group) were used to construct the volcano plots (n = 3). The y-axis and x-axis represent the P value and fold change, respectively. The red and blue dots represent significantly upregulated and downregulated mRNAs, respectively. The gray dots represent no statistically significantly altered mRNAs
Fig. 3
Fig. 3
Heatmap of all differentially expressed lncRNAs in hippocampal tissues with aging. QN: 9-month control group; SL: aging group (n = 3). Each row represents one lncRNA, and each column represents one hippocampal sample. The relative lncRNA level is shown by the color scale. Red and blue represent high and low relative expression levels, respectively. The fold changes were normalized and scaled from − 2.0 to 2.0 by Z score
Fig. 4
Fig. 4
Volcano plot of differentially expressed lncRNAs in the aging group and the 9-month control group. Normalized fold change and P values (aging group/9-month control group) were used to constructvolcano plots (n = 3). The y-axis and x-axis represent the P value and fold change, respectively. The red and blue dots represent statistically significantly upregulated and downregulated lncRNAs, respectively. The gray dots represent nonsignificantly altered lncRNAs
Fig. 5
Fig. 5
Validation of mRNA and lncRNA expression levels by RT‒PCR. QN: 9-month control group; SL: aging group (n = 3). mRNA and lncRNA expression levels were determined by RNA sequencing and RT‒PCR. Three parallel samples were assayed
Fig. 6
Fig. 6
GO function and KEGG pathway classification (A and C) and enrichment (B and D) analyses of DE mRNAs. The enrichment value (− log10 (P value) was calculated and visualized to show the top 30 enriched GO terms (B), and top 30 enriched pathways (D)
Fig. 6
Fig. 6
GO function and KEGG pathway classification (A and C) and enrichment (B and D) analyses of DE mRNAs. The enrichment value (− log10 (P value) was calculated and visualized to show the top 30 enriched GO terms (B), and top 30 enriched pathways (D)
Fig. 7
Fig. 7
GO function and KEGG pathway classification (A and C) and enrichment (B and D) analyses of DE lncRNAs. The enrichment value (− log10 (P value) was calculated and visualized to show the top 30 enriched GO terms (B), and top 30 enriched pathways (D)
Fig. 7
Fig. 7
GO function and KEGG pathway classification (A and C) and enrichment (B and D) analyses of DE lncRNAs. The enrichment value (− log10 (P value) was calculated and visualized to show the top 30 enriched GO terms (B), and top 30 enriched pathways (D)
Fig. 8
Fig. 8
Coexpression network analysis of differentially expressed lncRNAs–mRNAs. After Pearson correlation analysis between DE lncRNAs and mRNAs, 516 mRNAs and their corresponding lncRNAs with a COR > 0.9 and P value < 0.01 were selected to construct a coexpression network of DE lncRNAs and mRNAs. Green dots represent lncRNAs, red dots represent mRNAs, the size of the circle represents the number of dots associated with them, and the more connections there are, the larger the dots
Fig. 9
Fig. 9
lncRNA‒miRNA‒mRNA ceRNA regulatory network. A ceRNA regulatory network of lncRNAs‒miRNAs‒mRNAs was constructed with DE lncRNAs and their predicted binding miRNAs and DE mRNAs and their predicted binding miRNAs by Cytoscape_3.6.0. Green dots represent lncRNAs, red dots represent mRNAs, pink dots represent miRNAs, and the size of the circle represents the number of dots associated with them; the more connections there are, the larger the dots

References

    1. Xia X, Chen W, McDermott J, Han JJ. Molecular and phenotypic biomarkers of aging. F1000Res. 2017;6:860. doi: 10.12688/f1000research.10692.1. - DOI - PMC - PubMed
    1. Lara J, Sherratt MJ, Rees M. Aging and anti-aging. Maturitas. 2016;93:1–3. doi: 10.1016/j.maturitas.2016.08.020. - DOI - PubMed
    1. Capilla-Gonzalez V, Herranz-Pérez V, García-Verdugo JM. The aged brain: genesis and fate of residual progenitor cells in the subventricular zone. Front Cell Neurosci. 2015;9:365. doi: 10.3389/fncel.2015.00365. - DOI - PMC - PubMed
    1. Kour S, Rath PC. Long noncoding RNAs in aging and age-related diseases. Ageing Res Rev. 2016;26:1–21. doi: 10.1016/j.arr.2015.12.001. - DOI - PubMed
    1. Grammatikakis I, Panda AC, Abdelmohsen K, Gorospe M. Long noncoding RNAs(lncRNAs) and the molecular hallmarks of aging. Aging (Albany NY) 2014;6(12):992–1009. doi: 10.18632/aging.100710. - DOI - PMC - PubMed

Publication types