. 2022 Sep 28;22(1):1209.
doi: 10.1186/s12913-022-08586-y.

Burden of influenza hospitalization among high-risk groups in the United States

Affiliations

Burden of influenza hospitalization among high-risk groups in the United States

Aimee M Near et al. BMC Health Serv Res. .

Abstract

Background: Seasonal influenza poses a substantial clinical and economic burden in the United States and vulnerable populations, including the elderly and those with comorbidities, are at elevated risk for influenza-related medical complications.

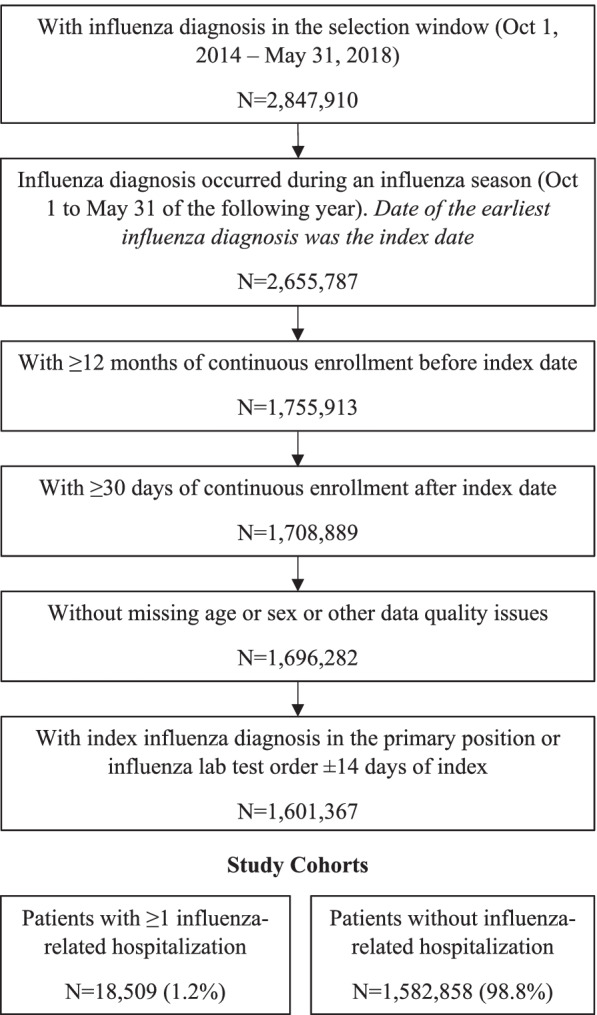
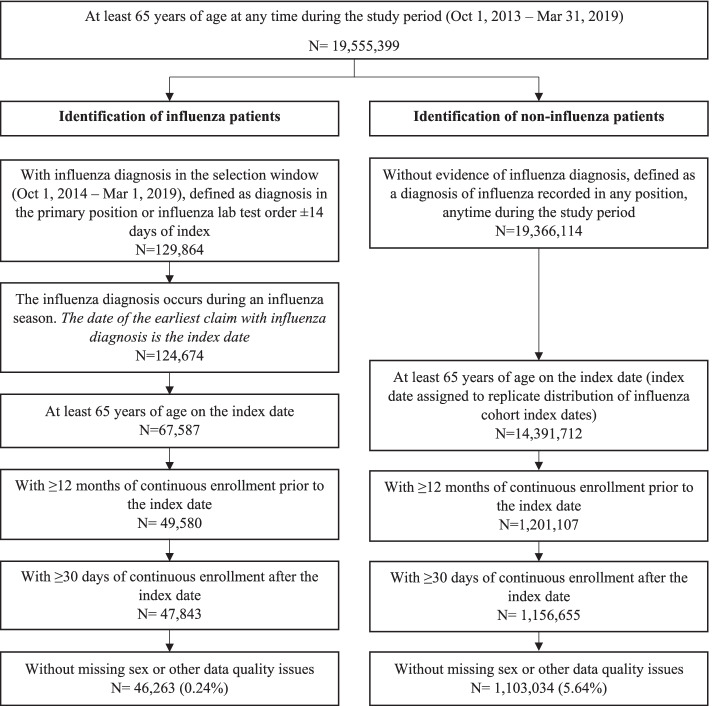
Methods: We conducted a retrospective cohort study using the IQVIA PharMetrics® Plus claims database in two stages. In Stage 1, we identified patients with evidence of medically-attended influenza during influenza seasons from October 1, 2014 to May 31, 2018 (latest available data for Stage 1) and used a multivariable logistic regression model to identify patient characteristics that predicted 30-day influenza-related hospitalization. The findings from Stage 1 informed high-risk subgroups of interest for Stage 2, where we selected cohorts of influenza patients during influenza seasons from October 1, 2014 to March 1, 2019 and used 1:1 propensity score matching to patients without influenza with similar high-risk characteristics to compare influenza-attributable rates of all-cause hospital and emergency department (ED) visits during follow-up (30-day and in the index influenza season).

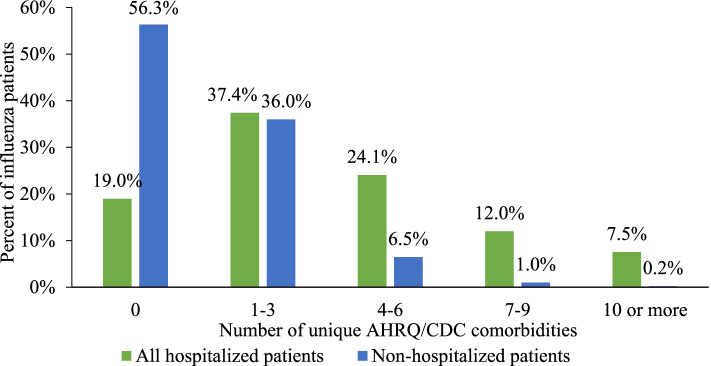
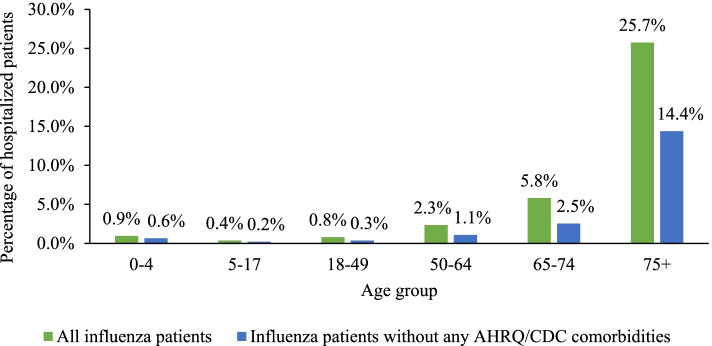
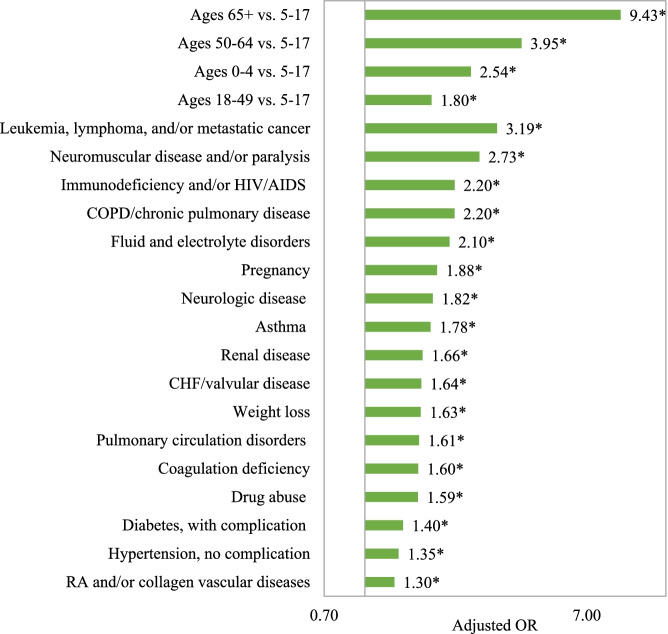
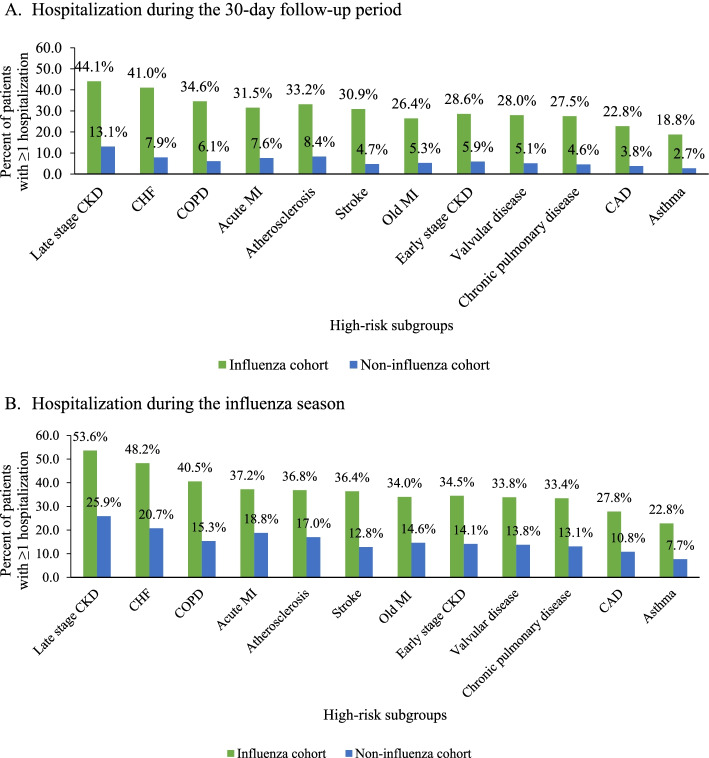
Results: In Stage 1, more than 1.6 million influenza cases were identified, of which 18,509 (1.2%) had a hospitalization. Elderly age was associated with 9 times the odds of hospitalization (≥65 years vs. 5-17 years; OR = 9.4, 95% CI 8.8-10.1) and select comorbidities were associated with 2-3 times the odds of hospitalization. In Stage 2, elderly influenza patients with comorbidities had 3 to 7 times higher 30-day hospitalization rates compared to matched patients without influenza, including patients with congestive heart failure (41.0% vs.7.9%), chronic obstructive pulmonary disease (34.6% vs. 6.1%), coronary artery disease (22.8% vs. 3.8%), and late-stage chronic kidney disease (44.1% vs. 13.1%; all p < 0.05).

Conclusions: The risk of influenza-related complications is elevated in the elderly, especially those with certain underlying comorbidities, leading to excess healthcare resource utilization. Continued efforts, beyond currently available vaccines, are needed to reduce influenza burden in high-risk populations.

Keywords: Comorbidities; Health resource utilization; Hospitalization; Influenza; Real-world.


Conflict of interest statement

D.H. and C.R. reports financial support from VIR Biotechnology Inc. Y.Y. reports a relationship with VIR Biotechnology Inc. that includes: funding grants. D.H. reports a relationship with Janssen Pharmaceuticals Inc. that includes: employment. D.H. reports a relationship with VIR Biotechnology Inc. that includes: equity or stocks. C.R. reports a relationship with VIR Biotechnology Inc. that includes: employment and equity or stocks. A.N. and J.T. are employees of IQVIA, which received funding from VIR Biotechnology Inc. to conduct this study.

Figures

Fig. 1
Fig. 1
Stage 1 patient selection criteria. Influenza was identified using ICD-9 codes 487–488 and ICD-10 codes J09-J11
Fig. 2
Fig. 2
Number of baseline AHRQ/CDC comorbidities by influenza-related hospitalization status. AHRQ: Agency for Health Research and Quality, CDC: Centers for Disease Control and Prevention. *Patients could have a maximum of 37 comorbidities defined using ICD-9/ICD-10 codes from the Elixhauser Comorbidity Software (AHRQ) and groups defined by the CDC as at high-risk for influenza-related hospitalizations
Fig. 3
Fig. 3
Influenza-related hospitalization rates of patients without any AHRQ/CDC comorbidities in the baseline period compared to all influenza patients. AHRQ: Agency for Health Research and Quality, CDC: Centers for Disease Control and Prevention
Fig. 4
Fig. 4
Logistic regression model for the odds of influenza-related hospitalization, adjusting for baseline demographic and clinical characteristics. CHF: Congestive heart failure, COPD: Chronic obstructive pulmonary disease, HIV/AIDS: Human Immunodeficiency Virus/Acquired Immunodeficiency Syndrome, RA: Rheumatoid arthritis. *Indicates significant difference between hospitalized and non-hospitalized patients (p < 0.05). Logistic regression model adjusted for age, sex, payer type, geographic region, index influenza season, evidence of influenza vaccination, and specific AHRQ/CDC comorbidities. This figure shows the odds ratios only for age groups and for select comorbidities where the odds ratio was > 1.30. Other comorbidities significantly associated with the odds of influenza-related hospitalization included rheumatoid arthritis/collagen vascular diseases, diabetes with no complication, deficiency anemias, solid tumor without metastasis, alcohol abuse, hypertension with complication, peripheral vascular disorder, liver disease, psychoses, and depression (odds ratios ranging from 1.08 to 1.30). Blood loss anemia, obesity, other metabolic disease, hypothyroidism, and chronic peptic ulcer disease were not associated with the odds of influenza-related hospitalization
Fig. 5
Fig. 5
Stage 2 patient selection criteria
Fig. 6
Fig. 6
All-cause hospitalization rates in the elderly influenza and non-influenza cohorts by comorbidity status. A Hospitalization during the 30-day follow-up period. B Hospitalization during the influenza season. CAD: Coronary artery disease, CHF: Congestive heart failure, CKD: Chronic kidney disease, COPD: Chronic obstructive pulmonary disease, MI: Myocardial infarction. All p-values for comparisons of hospitalization rates between the influenza and non-influenza cohorts < 0.05
Fig. 7
Fig. 7
Emergency department visits during the 30-day follow-up period in the elderly influenza and non-influenza cohorts by comorbidity status. A Emergency department visits during the 30-day follow-up period. B Emergency department visits during the influenza season. CAD: Coronary artery disease, CHF: Congestive heart failure, CKD: Chronic kidney disease, COPD: Chronic obstructive pulmonary disease, ED: Emergency department, MI: Myocardial infarction. All p-values for comparisons of ED visit rates between the influenza and non-influenza cohorts < 0.05

Similar articles

Cited by

References

    1. Centers for Disease Control and Prevention . Disease Burden of Influenza. 2020.
    1. Putri W, et al. Economic burden of seasonal influenza in the United States. Vaccine. 2018;36(27):3960–3966. doi: 10.1016/j.vaccine.2018.05.057. - DOI - PubMed
    1. Molinari NA, et al. The annual impact of seasonal influenza in the US: measuring disease burden and costs. Vaccine. 2007;25(27):5086–5096. doi: 10.1016/j.vaccine.2007.03.046. - DOI - PubMed
    1. Ghebrehewet S, MacPherson P, Ho A. Influenza. BMJ. 2016; 355:i6258. 10.1136/bmj.i6258. - PMC - PubMed
    1. Tokars JI, Olsen SJ, Reed C. Seasonal Incidence of Symptomatic Influenza in the United States. Clin Infect Dis. 2018;66(10):1511–1518. doi: 10.1093/cid/cix1060. - DOI - PMC - PubMed

Substances