. 2022 Sep 22:17:4449-4468.
doi: 10.2147/IJN.S346341. eCollection 2022.

Engineered Hybrid Treg-Targeted Nanosomes Restrain Lung Immunosuppression by Inducing Intratumoral CD8+T Cell Immunity

Affiliations

Engineered Hybrid Treg-Targeted Nanosomes Restrain Lung Immunosuppression by Inducing Intratumoral CD8+T Cell Immunity

Kalliopi Domvri et al. Int J Nanomedicine. .

Abstract

Introduction: Tumor immunotherapy is a key therapeutic paradigm for the treatment of several malignancies. However, in metastatic lung cancer, classical immunotherapy regimes are ineffective due to regulatory T cell (Treg)-related immunosuppression and tumor relapse.

Materials: To address this issue, we designed specific biocompatible Treg-targeted nanocarriers (NCs) as a model of immune-based nanotherapy, in order to target Treg-related immunosuppression in the lung tumor microenvironment. This is achieved through the combination of Dasatinib and Epacadostat integrated into biodegradable nanosomes which can inhibit and reverse Treg-supporting immunosuppression. Flow cytometry and immunofluorescence analysis, PET/CT scan, PTT/PA imaging and the Balb/c tumor model were used to explore the anti-tumor effect of Treg-targeted NCs both in vitro and in vivo.

Results: Findings reveal that NC treatment triggered substantial tumor cell apoptosis and drastically decreased tumor volume followed by downregulation of Ki-67 antigen expression, respectively. Drug circulation time was also increased as shown by biodistribution analysis accompanied by greater accumulation in lung and peripheral tissues. Intratumoral Th1 cytokines' expression was also increased, especially TNF-A, IL-12 by 42%, and IL-6 by 18% compared to PBS treatment. In addition, the presence of mature CD80+/CD86+dendritic cells (DCs) revealed T cell enrichment and a decline in MDSC infiltration and myeloid subsets. Interestingly, a significant decline of Gr/CD11b myeloid cell population in blood and tissue samples was also observed. This immune activation can be attributed to the enhanced PTT efficiency and tumor targeting ability of the nanospheres which under near infrared (NIR) exposure can prompt highly efficient tumor ablation. We also demonstrated their therapeutic efficacy against 4T1 metastatic breast cancer model. Additionally, the photothermal therapy in combination with PD-L1 checkpoint blockade therapy exerted long-term tumor control over both primary and distant tumors.

Discussion: Overall, our findings present a novel nano-enabled platform for the inhibition of Treg-dependent immunosuppression in NSCLC and provide a novel nanotherapeutic strategy for the treatment of metastatic neoplasia.

Keywords: T cells; Tregs; immunosuppression; metastasis; nanosomes.


Conflict of interest statement

The authors declare no conflicts of interest in relation to this work.

Figures
Figure 1
Figure 1
Continued.
Figure 1
Figure 1
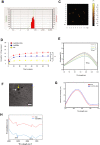
Characterization analysis of CuS/EPDA nanospheres. (A) Graphic illustration of the CuS/EPDA NCs. (B) Size distribution analysis of CuS/EPDA NCs by dynamic light scattering (DLS) method. (C) Characteristic AFM images of NCs. (D) Drug release curves from CuS/EPDA NCs with or without NIR irradiation. (E) UV–vis absorbance spectra analysis. (F) Characteristic TEM image of the CuS/EPDA NCs (black arrow: PLGA-PEG, white: CuS core, yellow: epacadostat/dasatinib drug complex). The white arrow indicates the distinct dark CuS core within the nanocarriers. (G) The fluorescence emission spectra of CuS/EPDA NCs. (H) The FTIR spectra of CuS and CuS@EPDA. The results represent the mean±SD of three Independent experiments. Differences were considered statistically significant at p < 0.05. Statistically significant data are indicated by asterisks (*P < 0.05, **P < 0.01).
Figure 2
Figure 2
Continued.
Figure 2
Figure 2
Continued.
Figure 2
Figure 2
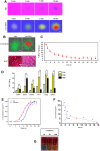
CuS/EPDA tumor targeting mechanism. (A) Cell viability assay of lung metastatic H-1993 cells after treatment with CuS (2mg/mL) or CuS/EPDA (2–4mg/mL) for 4h (Scale bar, 20 μm). (B and C) cytotoxicity evaluation of CuS/EPDA NCs in H-1993 and A549 cells under neutral or hypoxic pH. Cells were treated with CuS/EPDA NCs (0.5–10μg/mL−1) for 4h. Data represent the mean±SD of three independent experiments (*P < 0.05; **P < 0.01). (DF) Flow cytometry analysis of intracellular cytokines TNF-A, IL-6 and IL-12 levels in NC-treated mice. Serum from mice was isolated 48–72h following treatment. Data represent the mean ±SD of three independent experiments. (G and H) DC maturation analysis using flow cytometry after staining with CD11c, CD80 and CD86. Data represent the mean ±SD of three independent experiments (**P < 0.01). (I and J) Immunofluorescence staining of immunosuppression biomarkers iNOS and Arg1 in tumor tissues after CuS and CuS/EPDA incubation. Confocal microscopy images of Arg1 (green). iNOS labeled cells (red) and DAPI (blue). Images were captured using Carl Zeiss fluorescence confocal microscope. Data represent the mean±SD of three independent experiments (*P < 0.01). (K) Intracellular ROS assay (Deepred, ab186029, Abcam) of lung metastatic H-1993 cells after treatment with CuS (2mg/mL) or CuS/EPDA (2–4mg/mL) for 4 h (scale bar, 20 μm). Differences were considered statistically significant at p < 0.05. Statistically significant data are indicated by asterisks.
Figure 3
Figure 3
Pharmacokinetics and biodistribution analysis. (A) IR thermographic images of the CuS/EPDA nanosomes dispersed in PBS and irradiated with the 970 nm laser (1Wcm−2) for 10 min (scale bar, 50 nm). (B) Ki67 and Cyto Calcein staining of the intravenously injected CuS/EPDA NCs in BALB/c mice. Images were captured using Carl Zeiss fluorescence confocal microscope. Data represent the mean±SD of three independent experiments (Scale bar, 100 μm). (C) Blood circulation curve of the intravenously injected CuS/EPDA NCs in BALB/c mice. (D) Quantitative biodistribution analysis of CuS/EPDA NCs in BALB/c mice by measuring the Cy5. 5 fluorescence intensity in major organs at different time points post-injection. Data represent the mean±SD of three independent experiments. Statistically significant data are indicated by asterisks (*P < 0.05, **P < 0.01, ns, not significant). (E) Quantitative concentration analysis of CuS and CuS/EPDA NCs in tumor area by measuring the Cy5.5 fluorescence intensity at different time points post-injection. (F) Eliminating rate curve of intravenously injected CuS/EPDA NCs according to the concentration (C) over time (T) relationship. The blue and red indicators represent the first and the second time points respectively. (G) Stability of CuS/EPDA NCs after air exposure for 1–30 days. The NCs were dispersed in PBS and stored in room temperature for different periods of time.
Figure 4
Figure 4
Assessment of intratumoral immune responses in vivo. (A) Infiltration of monocytic MDSC (Ly6C) subsets in M1/M2 macrophage regions post treatment with CuS/EPDA NCs. (B) Percentage of Ly6C+ infiltrated cells. Data represent the mean±SD of three independent experiments. Differences were considered statistically significant at p < 0.05. Statistically significant data are indicated by asterisks (*P < 0.05, **P < 0.01). (C) Expression analysis of tumor-infiltrating FoxP3+ Tregs in mice following treatment with CuS/EPDA NCs. (D) Percentage of Treg cells in CD4+ T cell population. The results represent the mean± SD of three independent experiments. Differences were considered statistically significant at p < 0.05. Statistically significant data are indicated by asterisks (*P < 0.05, **P < 0.01). (E) The CD8+T/Tregs ratio analysis of the intravenously injected CuS/EPDA NCs in BALB/c mice. Statistically significant data are indicated by asterisks (*P < 0.05, **P < 0.01). (F and G) Expression analysis of IFN-γ+ CD8+ T cells in lung tissues following treatment with CuS and CuS/EPDA NCs. Data represent the mean±SD of three independent experiments. Differences were considered statistically significant at p < 0.05. Statistically significant data are indicated by asterisks (*P < 0.05, **P < 0.01).
Figure 5
Figure 5
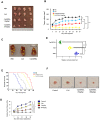
In vivo therapeutic efficacy against A549 tumor xenografts. (A) Characteristic photos of excised tumors from mice after treatment with CuS and CuS/EPDA NCs (5–10 mg/kg). (B) Comparative tumor volume assessment of A549 tumor bearing mice following treatment. (C) In vivo metastatic analysis of lymph node metastasis from control and CuS/EPDA NC-treated groups. Images showed representative lymph node metastatic foci highlighted in yellow color from different groups. (D) Statistical analysis of the number of metastatic foci of each group. (E) Survival rates of tumor-bearing mice after a 60-day tumor challenge in each group. Data were given as the mean ± SD (n = 6). Mean values and error bars are defined as mean and SD, respectively. (F) Representative photographs of excised tumors from mice after intravenous treatment with CuS/EPDA NCs (scale bar,1 cm). (G) Relative tumor volumes (V/V0) of A549 tumor bearing mice following intravenous administration. Data represent the mean±SD of three independent experiments (*P < 0.05; **P < 0.01).
Figure 6
Figure 6
Continued.
Figure 6
Figure 6
Assessment of intratumoral immune responses in vivo. (A) Flow cytometry analysis of propidium iodide (PI) and annexin V staining of CD4+ T cells activated by CD3 and CD28 antibodies post CuS/EPDA administration. The CD4+ T cells were isolated from PBMCs following centrifugation. (B) Percentage of apoptotic AICD+ cells in relation to Treg expression. The results represent the mean±SD of three independent experiments (**P < 0.01). (C) Percentage analysis of AICD+ cells from mice after treatment with CuS/EPDA or CuS/EPDA+IR. Data represent the mean±SD of three independent experiments (**p < 0.01). (D) Relative protein expression of Fas, FasL and NFAT1 in CuS/EPDA-treated BALB/c mice in comparison with control (PBS). The results represent the mean±SD of three independent experiments (*P < 0.05; **P < 0.01). (E) Graph showing positive correlation between AICD+ cells and Infiltrating CD8+ T levels. The results represent the mean±SD of three independent experiments. (F) Bioluminescence imaging of mice from control (PBS) and CuS/EPDA NC-treated groups. (G) The bioluminescence values (photons/sec/cm/sr) were quantified for each group of mice and mean values±SE were plotted. The results represent the mean±SD of three independent experiments (*P < 0.05; **P < 0.01). (H) Photoacoustic imaging of CuS/EPDA NCs in PBS buffer with different concentrations (0.1, 0.4 mg/mL−1). The highlighted yellow line indicates the isolated PA signal of the CuS/EPDA NCs. (I) The relative intensity of the PA signal at 680–750 nm. The results represent the mean±SD of three independent experiments (**P < 0.01). (J) Infrared thermal imaging of CuS/EPDA NCs and PBS with NIR irradiation (980nm, 1 Wcm−2). The results represent the mean±SD of three Independent experiments. (K) 18F-FDG PET imaging shows the primary tumor in lung cancer patients before and after daclizumab (CD25 inhibitor) treatment.
Figure 7
Figure 7
Continued.
Figure 7
Figure 7
Antitumor effect of CuS/EPDA NCs plus anti-PD-L1 immunotherapy in 4T1 orthotopic tumor model. (A) Schematic illustration showing the treatments schedule in 4T1 mouse model. (BE) Individual tumor growth kinetics in different groups. (F) Percentage rate of tumor -free mice during the treatments. (G) Morbidity-free survival of mice after the indicated treatment. The results represent the mean±SD of three independent experiments (**P < 0.01). (H) Representative photographs of excised tumors from mice after intravenous treatment with CuS/EPDA and anti-PD-L1 immunotherapy. (I) Relative tumor volumes (V/V0) of A549 tumor bearing 4T1 mice following intravenous administration. Data represent the mean±SD of three independent experiments (*P < 0.05; **P < 0.01). Differences were considered statistically significant at p < 0.05. (J) In vivo metastatic analysis of lymph node metastasis from CuS/EPDA and anti-PD-L1 immunotherapy-treated groups. Images showed representative lymph node metastatic foci highlighted in blue color from different groups. Yellow color represents no detected foci. (K) Statistical analysis of the number of metastatic foci of each group. Data represent the mean±SD of three independent experiments. Statistically significant data are indicated by asterisks (*P < 0.05, **P < 0.01, ND, not detected).

Similar articles

Cited by

References

    1. Bray F, Ferlay J, Soerjomataram I, Siegel RL, Torre LA, Jemal A. Global cancer statistics 2018:GLOBOCAN estimates of incidence and mortality worldwide for 36 cancers in 185 countries. CA Cancer J Clin. 2018;68(6):394–424. doi:10.3322/caac.21492 - DOI - PubMed
    1. Hirsch FR, Scagliotti GV, Mulshine JL, et al. Lung cancer: current therapies and new targeted treatments. Lancet. 2017;389(10066):299–311. doi:10.1016/S0140-6736(16)30958-8 - DOI - PubMed
    1. Chen DS, Mellman I. Elements of cancer immunity and the cancer-immune set point. Nature. 2017;541(7637):321–330. doi:10.1038/nature21349 - DOI - PubMed
    1. Rahma OE, Hodi FS. The intersection between tumor angiogenesis and immune suppression. Clin Cancer Res. 2019;25(18):5449–5457. doi:10.1158/1078-0432.CCR-18-1543 - DOI - PubMed
    1. Wang RF. Immune suppression by tumor-specific CD4+regulatoryT-cells in cancer. Semin Cancer Biol. 2006;16(1):73–79. doi:10.1016/j.semcancer.2005.07.009 - DOI - PubMed

MeSH terms