[Preprint]. 2022 Sep 22:2022.09.21.508922.
doi: 10.1101/2022.09.21.508922.

Evolution of antibody immunity following Omicron BA.1 breakthrough infection

Affiliations

Evolution of antibody immunity following Omicron BA.1 breakthrough infection

Chengzi I Kaku et al. bioRxiv. .

Update in

Abstract

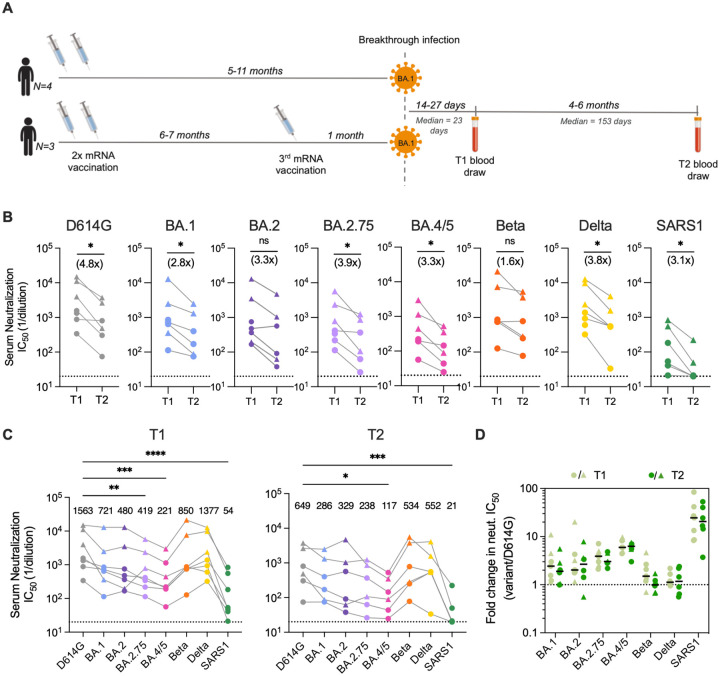
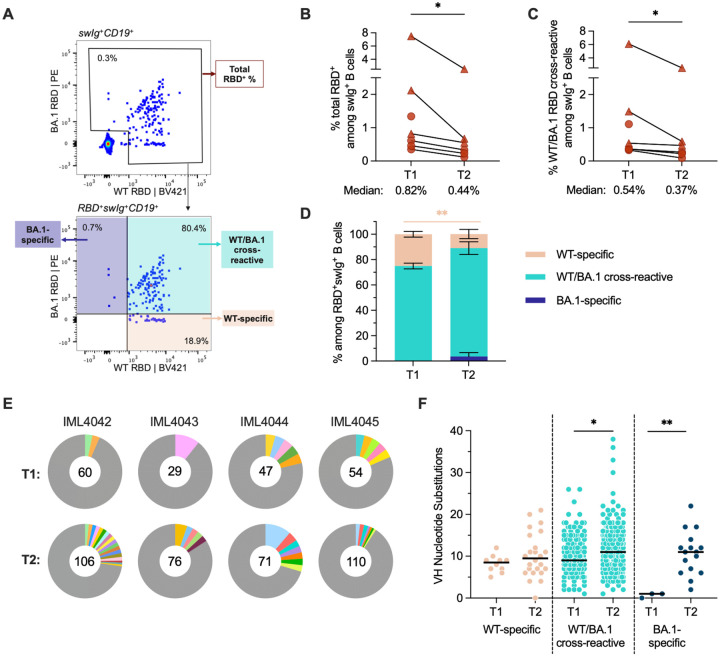
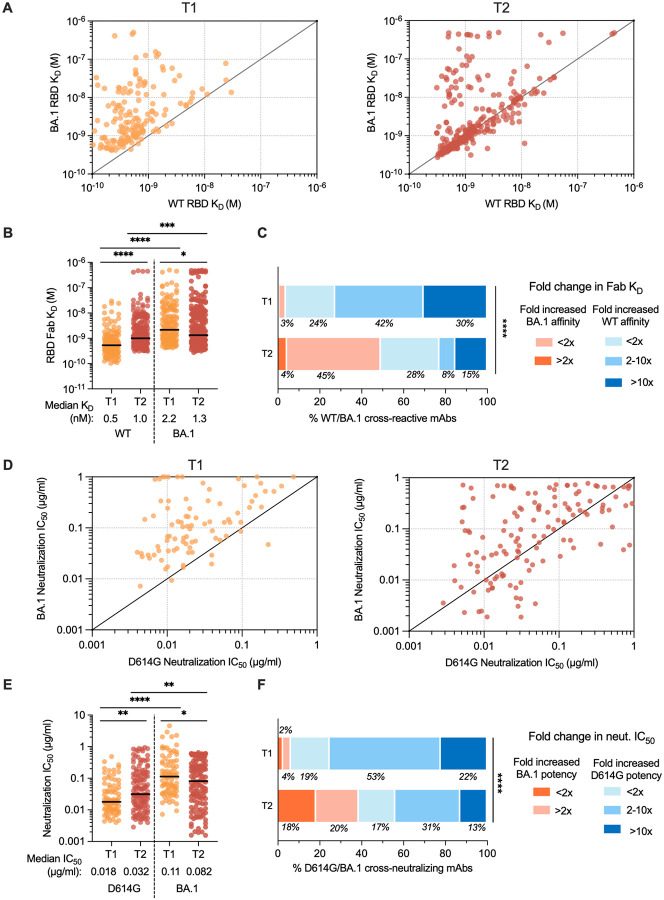
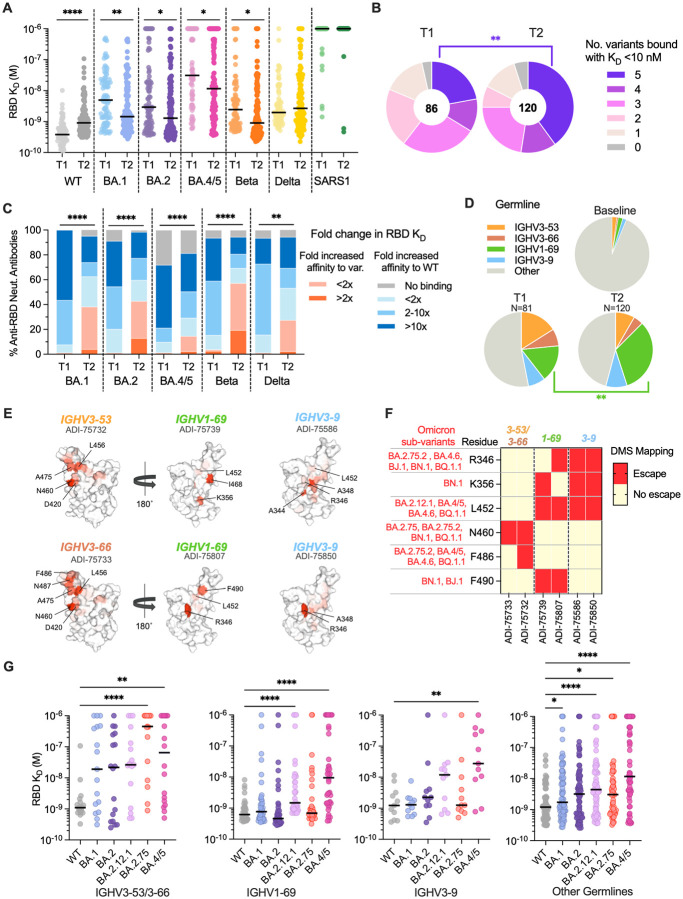
Understanding the evolution of antibody immunity following heterologous SAR-CoV-2 breakthrough infection will inform the development of next-generation vaccines. Here, we tracked SARS-CoV-2 receptor binding domain (RBD)-specific antibody responses up to six months following Omicron BA.1 breakthrough infection in mRNA-vaccinated individuals. Cross-reactive serum neutralizing antibody and memory B cell (MBC) responses declined by two- to four-fold through the study period. Breakthrough infection elicited minimal de novo Omicron-specific B cell responses but drove affinity maturation of pre-existing cross-reactive MBCs toward BA.1. Public clones dominated the neutralizing antibody response at both early and late time points, and their escape mutation profiles predicted newly emergent Omicron sublineages. The results demonstrate that heterologous SARS-CoV-2 variant exposure drives the evolution of B cell memory and suggest that convergent neutralizing antibody responses continue to shape viral evolution.


Conflict of interest statement

Competing interests: C.I.K. is a former employee and holds shares in Adimab. LLC. P.K., H.L.D., E.R.C., and J.C.G. are current employees and hold shares in Adimab LLC. L.M.W. is an employee and holds shares in Invivyd Inc. T.N.S. and J.D.B. consult with Apriori Bio. J.D.B. has consulted for Moderna and Merck on viral evolution and epidemiology. D.R.B. is a consultant for IAVI, Invivyd, Adimab, Mabloc, VosBio, Nonigenex, and Radiant. C.I.K. and L.M.W. are inventors on a provisional patent application describing the SARS-CoV-2 antibodies reported in this work. T.N.S. and J.D.B. may receive a share of intellectual property revenue as inventors on Fred Hutchinson Cancer Center–optioned technology and patents related to deep mutational scanning of viral proteins. The other authors declare that they have no competing interests.

Figures

Figure 1.
Figure 1.. Serum neutralizing antibody responses induced following BA.1 breakthrough infection.
(A) Timeline of vaccination, BA.1 breakthrough infection, and sample collections. (B) Paired analysis of serum neutralizing activity against SARS-CoV-2 D614G and BA.1, BA.2, BA.2.75, BA.4/5, Beta, and Delta variants, and SARS-CoV (SARS1) at 1-month (T1) and 5–6-month (T2) time points, as determined via a MLV-based pseudovirus neutralization assay. Connected data points represent paired samples for each donor, and the median fold change in serum titer between the two time points is shown in parentheses. Dotted lines represent the lower limit of detection of the assay. (C) Serum neutralizing titers against SARS-CoV-2 variants and SARS-CoV in samples collected at (left) 1-month and (right) 5–6-month post-breakthrough infection for each donor. Median titers are shown above the data points. Dotted lines represent the lower limit of detection of the assay. (D) Fold change in serum neutralizing titers for the indicated SARS-CoV-2 variants and SARS-CoV relative to SARS-CoV-2 D614G at early (T1) and late (T2) time points. Black bars represent median fold changes. Dotted line indicates no change in IC50. Breakthrough infection donors infected after two-dose mRNA vaccination (n = 4) are shown as circles and those infected after a third mRNA dose (n = 3) are shown as triangles. One two-dose vaccinated breakthrough donor was lost to follow-up at the second time point. Statistical comparisons were determined by (B) Wilcoxon matched-pairs signed rank test, (C) Friedman’s one-way ANOVA with Dunn’s multiple comparisons, or (D) mixed model ANOVA. *P < 0.05; **P < 0.01; ****P < 0.0001; ns, not significant.
Figure 2.
Figure 2.. SARS-CoV-2 RBD-specific memory B cell responses following BA.1 breakthrough infection.
(A) Representative fluorescence-activated cell sorting gating strategy used to enumerate frequencies of (top) total (WT+BA.1) RBD-reactive B cells among classswitched (IgG+ or IgA+) CD19+ B cells and (bottom) WT-specific, BA.1-specific, and WT/BA.1 cross-reactive B cells among total RBD-reactive, class-switched (IgG+ or IgA+) CD19+ B cells. (B-C) Frequencies of (B) total RBD-reactive or (C) WT/BA.1 RBD cross-reactive B cells among class-switched CD19+ B cells at 1-month (T1) and 5–6-month (T2) time points. Connected data points represent paired samples for each donor. Donors infected after two-dose mRNA vaccination (n = 4) are shown as circles and those infected after a third mRNA dose (n = 3) are shown as triangles. One two-dose vaccinated breakthrough donor was censored at the second time point. (D) Mean proportions of RBD-reactive, class-switched B cells that display WT-specific, BA.1-specific or WT/BA.1-cross-reactive binding at each time point. Error bars indicate standard error of mean. (E) Clonal lineage analysis of RBD-directed antibodies isolated from four donors at the early (T1) and late (T2) time points. Clonally expanded lineages (defined as antibodies with the same heavy and light chain germlines, same CDR3 lengths, and ≥ 80% CDRH3 sequence identity) are represented as colored slices. Each colored slice represents a clonal lineage with the size of the slice proportional to the lineage size. Unique clones are combined into a single gray segment. The number of antibodies is shown in the center of each pie. Three of the donors (IML4042, IML4043, and IML4044) experienced BA.1 breakthrough infection following two-dose mRNA vaccination and the remaining donor (IML4045) was infected after a booster immunization. (F) Levels of somatic hypermutation, as determined by the number of nucleotide substitutions in the variable heavy (VH) region, at the early and late time points among WT-specific, WT/BA.1 cross-reactive, and BA.1-specific antibodies. Medians are shown by black bars. Statistical significance was determined by (B and C) Wilcoxon matched-pairs signed rank test or (D and F) Mann-Whitney U test. swIg+, class-switched immunoglobulin. PE, phycoerythrin; *P < 0.05; **P < 0.01.
Figure 3.
Figure 3.. Binding and neutralizing properties of RBD-directed antibodies induced by BA.1 breakthrough infection.
(A-B) Fab binding affinities of WT/BA.1 cross-reactive antibodies for recombinant WT and BA.1 RBD antigens, as measured by BLI, are plotted as bivariates for antibodies derived from (left) 1-month and (right) 5–6-month time points in (A) and summarized as a column dot plot in (B). Median affinities are indicated by black bars and shown below data points. (C) Proportions of WT/BA.1 cross-reactive antibodies at each time point that show increased affinity for the BA.1 RBD relative to WT (red shades) or increased affinity for WT RBD (blue shades). Values represent the percentage of antibodies belonging to each of the indicated categories. (D–E) Neutralizing activities of cross-binding antibodies against SARS-CoV-2 D614G and BA.1, as determined by an MLV-based pseudovirus neutralization assay. IC50 values are plotted in (D) as bivariates for antibodies isolated from (left) 1-month and (right) 5–6-month tie points and summarized as column dot plots in (E). Median IC50 values are indicated by black bars and shown below data points. (F) Proportions of WT/BA.1 cross-neutralizing antibodies at each time point that show increased neutralizing potency against BA.1 (red shades) or D614G (blue shades). Values represent the percentage of antibodies belonging to each of the indicated categories. Statistical comparisons were determined by (B and E) multiple Mann-Whitney U tests without adjustment for multiplicity across time points and Wilcoxon matched-pairs rank tests within each time point or (C and F) Mann-Whitney U test. IC50, 50% inhibitory concentration; KD, equilibrium dissociation constant; *P < 0.05; **P < 0.01; ****P < 0.0001.
Figure 4.
Figure 4.. Breadth of D614G/BA.1 cross-neutralizing antibodies at early and late time points following BA.1 breakthrough infection.
(A) Fab binding affinities of D614G/BA.1 cross-neutralizing antibodies isolated at 1-month (T1) and 5–6-month (T2) time points for recombinant SARS-CoV-2 variant RBDs and the SARS-CoV RBD, as determined by BLI. Black bars represent medians. (B) Pie charts showing the proportions of antibodies derived from (left) early and (right) late time points that bound the indicated number of SARS-CoV-2 variant RBDs with Fab KDs < 10 nM. The total number of antibodies is shown in the center of each pie. (C) Proportions of D614G/BA.1 cross-neutralizing antibodies with the indicated fold changes in Fab binding affinities for recombinant SARS-CoV-2 variant RBDs relative to the WT RBD. (D) Pie charts showing frequencies of the indicated convergent germline genes among D614G/BA.1 cross-neutralizing antibodies isolated at early (T1) and late (T2) timelines. Germline gene frequencies observed in baseline human antibody repertoires (upper right) are shown for comparison (25). (E) Structural projections of binding escape mutations determined for the indicated convergent antibodies using deep mutational scanning analysis of yeast-displayed SARS-CoV-2 BA.1 RBD mutant libraries. The RBD surface is colored by a gradient ranging from no escape (white) to strong escape (red) at each site. See Fig. S10 for additional details. (F) Heatmap summarizing convergent antibody escape mutations present in the indicated SARS-CoV-2 Omicron sub-lineages. (G) Fab binding affinities of convergent antibodies utilizing the indicated germline genes for SARS-CoV-2 WT and Omicron sub-variant RBD antigens, as measured by BLI. Black bars indicate median affinities. Statistical comparisons were determined by (A and C) Kruskal-Wallis test with Holms corrected multiple pairwise comparisons, (B and D) Fisher’s exact test, or (G) Kruskal-Wallis test with subsequent Dunn’s multiple comparisons with WT. KD, equilibrium dissociation constant; *P < 0.05; **P < 0.01; ***P < 0.001; ****P < 0.0001.

References

    1. WHO Coronavirus (COVID-19) Dashboard | WHO Coronavirus (COVID-19) Dashboard With Vaccination Data, (available at https://covid19.who.int/).
    1. Tseng H. F. et al. , Nat. Med. 28, 1063–1071 (2022). - PMC - PubMed
    1. Tartof S. Y. et al. , Lancet Respir. Med. 10, 689–699 (2022). - PMC - PubMed
    1. Wang Q. et al. , Nature. 608, 603–608 (2022). - PMC - PubMed
    1. Tuekprakhon A. et al. , Cell. 185, 2422–2433.e13 (2022). - PMC - PubMed

Publication types