. 2022 Sep 12:13:961350.
doi: 10.3389/fimmu.2022.961350. eCollection 2022.

Integrated single-cell RNA-seq analysis identifies immune heterogeneity associated with KRAS/TP53 mutation status and tumor-sideness in colorectal cancers

Affiliations

Integrated single-cell RNA-seq analysis identifies immune heterogeneity associated with KRAS/TP53 mutation status and tumor-sideness in colorectal cancers

Xiaoyu Liu et al. Front Immunol. .

Abstract

Background: The main objective of this study was to analyze the effects of KRAS/TP53 mutation status and tumor sideness on the immune microenvironment of colorectal cancer using integrated scRNA-seq data.

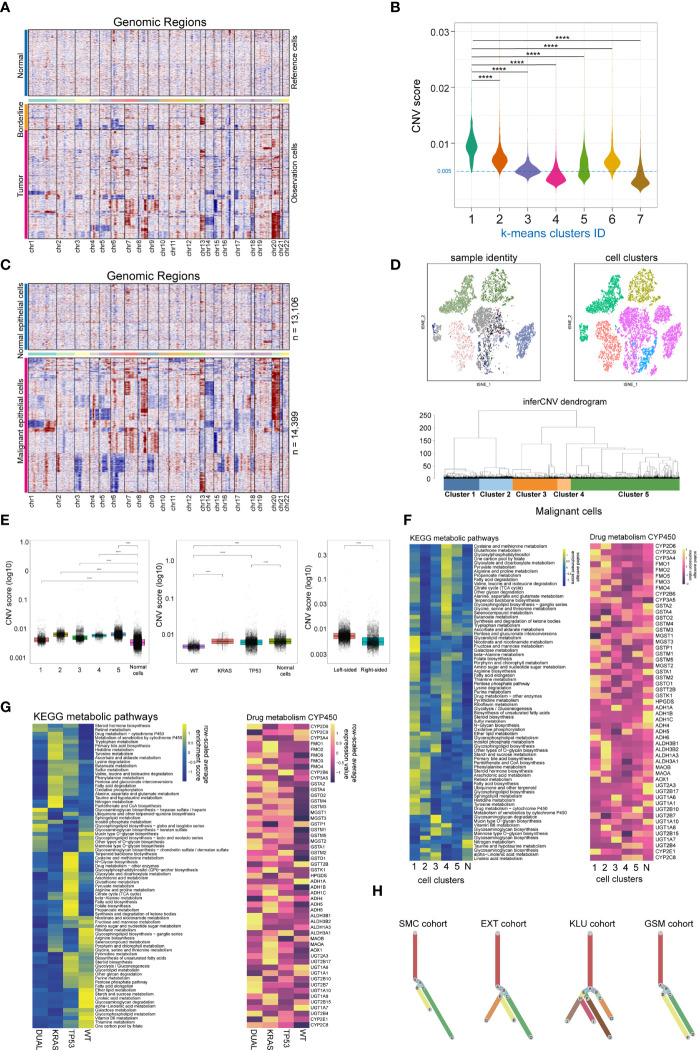
Methods: A total of 78 scRNA-seq datasets, comprising 42 treatment-naive colorectal tumors, 13 tumor adjacent tissues and 23 normal mucosa tissues were included. Standardized Seurat procedures were applied to identify cellular components with canonical cell marks. The batch-effect was assessed and corrected using harmony algorithm. The scMetabolism algorithm was used for single-cell metabolic analysis. The results and clinical significance were further validated using immunofluorescent-staining and TCGA-COAD datasets. Immune-infiltration scores of bulk-RNA-seq data were estimated using ssGSEA. The presto-wilcoxauc algorithm was used to identify differentially enriched genes or pathways across different subgroups. Two-sided p-value less than 0.05 was considered statistically significant.

Results: We refined the landscape of functional immune cell subtypes, especially T cells and myeloid cells, across normal mucosa, tumor adjacent and tumor tissue. The existence and function of two states of exhausted CD8+ T (Tex) subtypes in colorectal cancer, and FOLR2+ LYVE1+ macrophages indicating unfavorable prognosis in colorectal cancer were identified and validated. The diverse tumor mutation status reshaped the immune cell function and immune checkpoint ligands/receptors (ICLs/ICRs) expression pattern. Importantly, the KRAS/TP53 dual mutations significantly reduced the major energy metabolic functions in immune cells, and promoted the cell-to-cell communications towards immunosuppression in colorectal cancers. The results revealed LAG3, CD24-SIGLEC10 and HBEGF-CD9 pathways as potential therapeutic targets for dual mutant colorectal cancers.

Conclusions: We revealed that the immune microenvironment underwent a gradual remodeling with an enrichment of immunosuppressive myeloid cells from normal mucosa to tumor regions in colorectal cancers. Moreover, we revealed the metabolic heterogeneity of tumor-infiltrating immune cells and suggested that the KRAS/TP53 dual mutation may impair antitumor immunity by reducing T and myeloid cell energy metabolism and reshaping cellular interactions toward immunosuppression.

Keywords: KRAS mutation; TP53 mutation; clinical prognosis; colorectal cancer; therapeutic targets; tumor immune microenvironment; tumor sideness.


Conflict of interest statement

The authors declare that the research was conducted in the absence of any commercial or financial relationships that could be construed as a potential conflict of interest.

Figures

Figure 1
Figure 1
Integrated single-cell transcriptome atlas of colorectal cancer. (A, B) Schematic diagram depicted the (A) tumor sideness and (B) mutations status information. The tumor location indicated the sideness of the colorectal cancer (left-sided or right-sided). The KRAS gene primarily included RAS activating mutations such as KRASG12D and KRASG12C. Whereas the TP53 gene had more diverse mutations sites. The patient cohort information was provided to identify the origins of the patients. (C) UMAP dimension reduction of all 71,946 cells, and visualization of the characteristics according to UMAP clusters, cells origin cohorts, tumor location and sample identity. (D) UMAP plots displayed 9 major cell-types (epithelial cells, myeloid cells, B cells, T cells, plasma cells, master cells, NK-like cells, endothelial cells and fibroblasts) by tissue types. (E) Violin plots displayed the expression of marker genes across the 9 major cell types. (F) UMAP plots demonstrated the expression of key marker genes (CD3D, MS4A1, CD68, MZB1, NCAM1, KRT, PECAM1, DCN, TPSB2) across the 9 major cell types. (G) Heatmap depicted the top 10 differentially expressed marker genes across the 9 major cell types. For each group, 500 cells were randomly selected to draw the heatmap. (H) Representative images of immunofluorescent-stained cytokeratin, α-SMA, CD31, CD4 and CD8 in human colorectal cancer (upper panel) and tumor adjacent tissue (lower panel). (I) Bar plot demonstrated the proportion of T cells, Epithelial cells, Fibroblasts, Myeloid cells, Plasma cell, and NK-like cells across normal mucosa, tumor adjacent and colorectal tumor tissues.
Figure 2
Figure 2
Single cell copy-number variation and clonal evolution of malignant epithelial cells. (A) Heatmap depicted copy-number variation (CNV) hierarchical clustering of epithelial cells in colorectal tumor and tumor adjacent tissues, with normal mucosa epithelial cells as a reference. (B) Violin plot showed the CNV score across 7 epithelial cell subclusters across normal mucosa, tumor adjacent and tumor tissue, with cells from cluster 4 and 7 classified as normal epithelial cells. (C) Heatmap depicted CNV hierarchical clustering of putative malignant epithelial cells (n = 14399). (D) The subclusters and distribution patterns of malignant epithelial cells were depicted by the t-SNE (upper) and cluster tree (bottom) plots. (E) The boxplots depict the CNV scores of malignant epithelial cells based on subcultures (left), KRAS/TP53 mutation status (middle), and tumor sideness (right). (F) A heatmap of significantly altered metabolic pathways (p 0.001) in malignant epithelial cells across multiple subclusters (left), as well as the expression of representative genes in Drug metabolism CYP450 pathways (right). (G) A heatmap of significantly altered metabolic pathways (p 0.001) of malignant epithelial cells, as well as the expression of representative genes in Drug metabolism CYP450 pathways (right) based on KRAS/TP53 mutant status. (H) Clonality trees depicted the heterogenicity of evolution trajectories across the four cohort. The branches are determined by the proportion of cells in each subclone that contain the respective CNV events. ****p < 0.0001.
Figure 3
Figure 3
Tumor-infiltrating T cells exhibit molecular and metabolic heterogeneity according to tumor sideness and KRAS/TP53 mutation status. (A) The tSNE dimension reduction of all 71,946 T cells (including T cells derived from normal mucosa, tumor adjacent and tumor tissue), and visualization of the characteristics based on tSNE clusters. (B) The violin plot displayed the expression levels of key cytokines and receptors across various T cell types. (C) Visualization of the T-cell characteristics based on tSNE clusters, cells origin, tumor location and sample identity. (D) The heatmap showed spearman correlation between various cell subpopulations based on the top 500 genes with the highest standard deviation. (E) Boxplots presented the expression levels of GZMA, GZMB, IFN-γ and CXCL13 in the two Tex (CD8+LAG3+ Tex and CD8+LAG3+CTLA4+ Tex) groups. (F, G) The average expression levels of immune checkpoint molecules across various subtypes of T cells in (F) all tumor-infiltrating T cells, and (G) the expression according to KRAS/TP53 mutation status. The bar depicted the row-scaled average gene expression level. (H) The heatmap of significantly altered metabolic pathways (p < 0.001) of tumor-infiltrating CD4+ T cells based on KRAS/TP53 mutation status. The bar depicted the row-scaled pathway enrichment level. (I, J) The boxplots showed the levels of Oxidative phosphorylation (left) and Citrate cycle (TCA cycle) activity score of tumor-infiltrating CD4+ T cells according to (I) KRAS/TP53 mutation status and (J) tumor sideness. (K) The heatmap of significantly altered metabolic pathways (p < 0.001) of tumor-infiltrating CD8+ T cells based on KRAS/TP53 mutation status. The bar represented the row-scaled pathway enrichment level. (L, M) The boxplots presented the levels of Oxidative phosphorylation (left) and Citrate cycle (TCA cycle) activity score of tumor-infiltrating CD4+ T cells based on (L) KRAS/TP53 mutation status and (M) tumor sideness. ns, not significant; *p < 0.05; ****p < 0.0001.
Figure 4
Figure 4
Trajectory analysis of intratumor CD4+ and CD8+ T lymphocytes cells in colorectal cancers with based on KRAS/TP53 mutation status. (A) The trajectory plot (monocle2) showed the dynamics of all tumor-infiltrating CD4+ T cell clusters and their pseudotime-associated cell state. (B) The proportion of CD4+ T cells based on tumor sideness and KRAS/TP53 mutation status. (C) According to the BEAM analysis, key genes were hierarchically categorized into four subclusters along the trajectory branching of CD4+ T cells. (D) The trajectory plot (monocle2) showed that the trajectory path of CD4+ T cells were distinct based on tumor KRAS/TP53 mutation status. (E) The enriched gene ontology (GO) terms in different BEAM trajectory clusters. (F) The trajectory plot (monocle2) showed the dynamics of all tumor-infiltrating CD8+ T cell clusters and their pseudotime-associated cell state. (G) The proportion of CD8+ T cells based on tumor sideness and KRAS/TP53 mutation status. (H) According to the BEAM analysis, key genes were hierarchically categorized into four subclusters along the trajectory branching of CD8+ T cells. (I) The trajectory plot (monocle2) showed that the trajectory path of CD8+ T cells were distinct based on tumor KRAS/TP53 mutation status. (J) The enriched gene ontology (GO) terms in different BEAM trajectory clusters.
Figure 5
Figure 5
Tumor-infiltrating myeloid cells exhibit molecular plasticity and metabolic heterogeneity according to tumor sideness and KRAS/TP53 mutation status. (A) UMAP dimension reduction of 14,680 myeloid cells (containing myeloid cells derived from normal mucosa, tumor adjacent and tumor tissue), and visualization of the features based on UMAP clusters. (B) The violin plot presented the expression levels of canonical myeloid cell markers across cell types. (C) Representative images of immunofluorescent-stained DAPI, CD11b, CD163, FOLR2 (upper) and SPP1 (lower) in human colorectal cancer. (D) The heatmap displayed spearman correlation between various myeloid cell subpopulations based on the top 500 genes with the highest standard deviation. (E) Visualization of the distribution of myeloid cell types across normal mucosa (left), tumor adjacent (middle) and tumor tissue (right). (F) The heatmap of significantly enriched metabolic pathways (p < 0.001) across tumor-infiltrating myeloid cell types. The bar represented the row-scaled pathway enrichment level. (G) The boxplots presented the levels of Oxidative phosphorylation (upper left), Citrate cycle (TCA cycle) (upper right) and Glycolysis/Gluconeogenesis (lower) activity score across distinct tumor-infiltrating myeloid cell types. (H, I) The average expression levels of immune checkpoint molecules among different subtypes of (H) all tumor-infiltrating myeloid cells, and (I) the expression according to KRAS/TP53 mutation status. (J) The GSEA analysis of DEGs of myeloid cells derived from KRAS/TP53 dual mutant colorectal cancers. (K) The boxplots showed the levels of Oxidative phosphorylation, Citrate cycle (TCA cycle) and Glycolysis/Gluconeogenesis activity score of tumor-infiltrating myeloid cells according to KRAS/TP53 mutation status in all myeloid cells (upper) and tumor-associated macrophages (lower). (L) The trajectory plot (monocle3) showed the dynamics of all tumor-infiltrating macrophages subclusters and their pseudotime-associated cell state based on KRAS/TP53 mutation status. ns, not significant; ***p < 0.001; ****p < 0.0001.
Figure 6
Figure 6
Identification of putative ICR–ICL interactions between cellular subtypes of the tumor microenvironment. (A) Heatmap depicted the comprehensive view of putative ICR–ICL connections pairs for each major cell subtypes (including cell derived from normal mucosa, tumor adjacent and tumor tissue). (B) CellphoneDB software detected the ligand-receptor connections involving tumor cells (left) and myeloid cells (middle), and T cells (right). The average interaction scores are presented by circle size, while the immune functions involved are indicated by circle color. (C) The circular plots depicted the global and functional molecular (immune checkpoints, growth factors, and cytokines) interactions in normal mucosa, tumor adjacent tissue, and tumor tissue. (D) The net plot depicted a view (global and cytokines) of the top 20 cell-cell interactions involving tumor cells, T cells and macrophages in colorectal cancers. (E) The net plot depicted a comprehensive view of the top 20 cell-cell interactions involving tumor cells, T cells and macrophages in left- and right- sided colorectal cancers. (F) The circular plots depicted the cell-to-cell interactions across malignant epithelial cells, myeloid cells and T cells in colorectal tumors tissue.
Figure 7
Figure 7
Validation the clinical relevance of the scRNA data using the TCGA-COAD dataset. (A) The Heatmap depicted the immune infiltration score in TCGA-COAD cohort (n = 478) based on a group of canonical immune cell markers and cell markers genes identified based on the scRNA-seq analysis. (B, C) The correlation between immune infiltration score determined by canonical markers and that identified using scRNA-seq identified marker genes. The spearman correlation rho- and p-value were presented in each figure. (D) Survival analyses showed that increased epithelial score and CD4+ unknown T cell score were associated with poorer prognosis, and increased B cell score and CD8+ CTSW+ Cytotoxic T cell score were associated with a better prognosis in the TCGA-COAD cohort. The optimal separation points of the continues immune infiltration indicators were identified using the R survminer algorithms. (E) In patients with KRAS/TP53 wildtype colorectal cancer, the fibroblast infiltration score predicted worse prognosis, whereas the CCL20+IL1B+ macrophages infiltration predicted better prognosis. (F) In patients with KRAS/TP53 dual mutant colorectal cancer, the CD4+ unknown T cell score indicated poorer prognosis, and the B-cell infiltration score indicated a favorable prognosis.

Similar articles

Cited by

References

    1. Siegel R, Miller K, Fuchs H, Jemal A. Cancer statistics, 2022. CA: Cancer J Clin (2022) 72(1):7–33. doi: 10.3322/caac.21708 - DOI - PubMed
    1. Friedlaender A, Subbiah V, Russo A, Banna G, Malapelle U, Rolfo C, et al. . EGFR and HER2 exon 20 insertions in solid tumours: From biology to treatment. Nat Rev Clin Oncol (2022) 19(1):51–69. doi: 10.1038/s41571-021-00558-1 - DOI - PubMed
    1. Bigness A, Imanirad I, Sahin I, Xie H, Frakes J, Hoffe S, et al. . Locally advanced rectal adenocarcinoma: Treatment sequences, intensification, and rectal organ preservation. CA: Cancer J Clin (2021) 71(3):198–208. doi: 10.3322/caac.21661 - DOI - PubMed
    1. Fokas E, Schlenska-Lange A, Polat B, Klautke G, Grabenbauer G, Fietkau R, et al. . Chemoradiotherapy plus induction or consolidation chemotherapy as total neoadjuvant therapy for patients with locally advanced rectal cancer: Long-term results of the CAO/ARO/AIO-12 randomized clinical trial. JAMA Oncol (2022) 8(1):e215445. doi: 10.1001/jamaoncol.2021.5445 - DOI - PMC - PubMed
    1. André T, Shiu K, Kim T, Jensen B, Jensen L, Punt C, et al. . Pembrolizumab in microsatellite-Instability-High advanced colorectal cancer. New Engl J Med (2020) 383(23):2207–18. doi: 10.1056/NEJMoa2017699 - DOI - PubMed

Publication types