

Immunoprofiling of monocytes in STAT1 gain-of-function chronic mucocutaneous candidiasis
- PMID: 36172362
- PMCID: PMC9510987
- DOI: 10.3389/fimmu.2022.983977
Immunoprofiling of monocytes in STAT1 gain-of-function chronic mucocutaneous candidiasis
Abstract
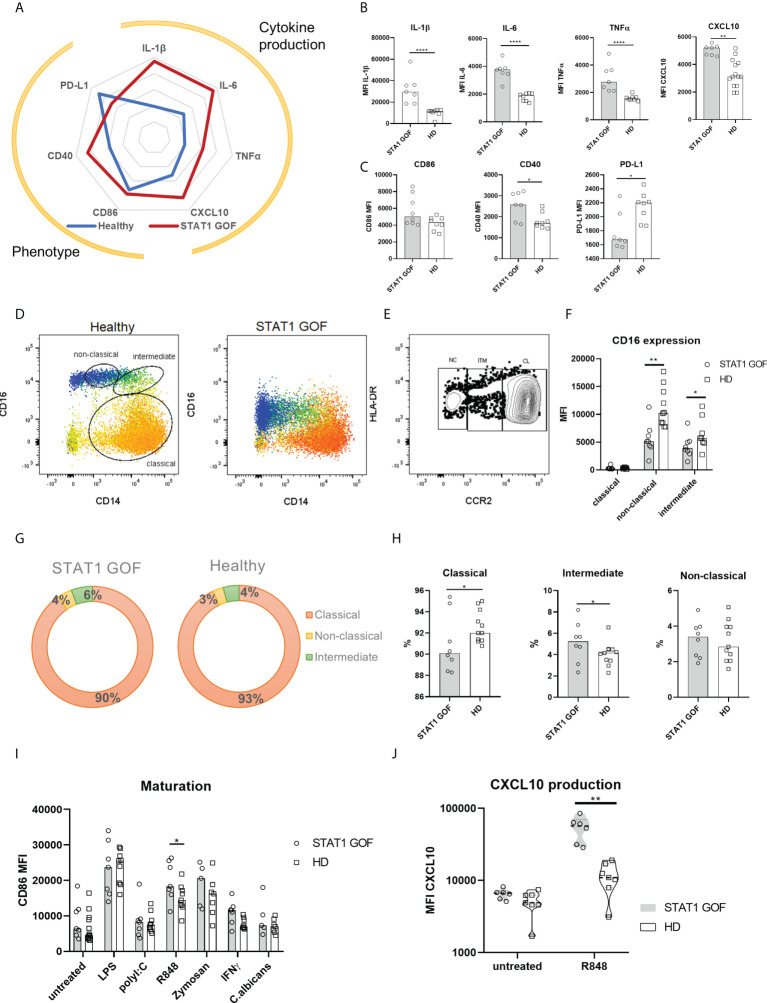
Patients with STAT1 gain-of-function (GOF) mutations suffer from an inborn error of immunity hallmarked by chronic mucocutaneous candidiasis (CMC). The pathogenesis behind this complex and heterogeneous disease is still incompletely understood. Beyond the well-recognized Th17 failure, linked to the STAT1/STAT3 dysbalance-driven abrogation of antifungal defense, only little is known about the consequences of augmented STAT1 signaling in other cells, including, interestingly, the innate immune cells. STAT1-mediated signaling was previously shown to be increased in STAT1 GOF CD14+ monocytes. Therefore, we hypothesized that monocytes might represent important co-orchestrators of antifungal defense failure, as well as various immunodysregulatory phenomena seen in patients with STAT1 GOF CMC, including autoimmunity. In this article, we demonstrate that human STAT1 GOF monocytes are characterized by proinflammatory phenotypes and a strong inflammatory skew of their secretory cytokine profile. Moreover, they exhibit diminished CD16 expression, and reduction of classical (CD14++C16-) and expansion of intermediate (CD14++16+) subpopulations. Amongst the functional aberrations, a selectively enhanced responsiveness to TLR7/8 stimulation, but not to other TLR ligands, was noted, which might represent a contributing mechanism in the pathogenesis of STAT1 GOF-associated autoimmunity. Importantly, some of these features extend to STAT1 GOF monocyte-derived dendritic cells and to STAT1 GOF peripheral myeloid dendritic cells, suggesting that the alterations observed in monocytes are, in fact, intrinsic due to STAT1 mutation, and not mere bystanders of chronic inflammatory environment. Lastly, we observe that the proinflammatory bias of STAT1 GOF monocytes may be ameliorated with JAK inhibition. Taken together, we show that monocytes likely play an active role in both the microbial susceptibility and autoimmunity in STAT1 GOF CMC.
Keywords: STAT1; candidiasis; cmc; dendritic cell; immunodeficiencies; monocytes; ruxolitinib.
Copyright © 2022 Bloomfield, Zentsova, Milota, Sediva and Parackova.
Conflict of interest statement
The authors declare that the research was conducted in the absence of any commercial or financial relationships that could be construed as a potential conflict of interest.
Figures


Similar articles
-
Neutrophils in STAT1 Gain-Of-Function Have a Pro-inflammatory Signature Which Is Not Rescued by JAK Inhibition.J Clin Immunol. 2023 Oct;43(7):1640-1659. doi: 10.1007/s10875-023-01528-1. Epub 2023 Jun 26. J Clin Immunol. 2023. PMID: 37358695 Free PMC article.
-
Aberrant tolerogenic functions and proinflammatory skew of dendritic cells in STAT1 gain-of-function patients may contribute to autoimmunity and fungal susceptibility.Clin Immunol. 2023 Jan;246:109174. doi: 10.1016/j.clim.2022.109174. Epub 2022 Nov 11. Clin Immunol. 2023. PMID: 36372319
-
Utility of Ruxolitinib in a Child with Chronic Mucocutaneous Candidiasis Caused by a Novel STAT1 Gain-of-Function Mutation.J Clin Immunol. 2018 Jul;38(5):589-601. doi: 10.1007/s10875-018-0519-6. Epub 2018 Jun 22. J Clin Immunol. 2018. PMID: 29934865
-
Human STAT1 Gain-of-Function Heterozygous Mutations: Chronic Mucocutaneous Candidiasis and Type I Interferonopathy.J Clin Immunol. 2020 Nov;40(8):1065-1081. doi: 10.1007/s10875-020-00847-x. Epub 2020 Aug 27. J Clin Immunol. 2020. PMID: 32852681 Free PMC article. Review.
-
STAT1 and STAT3 gain of function: clinically heterogenous immune regulatory disorders.Curr Opin Allergy Clin Immunol. 2024 Dec 1;24(6):440-447. doi: 10.1097/ACI.0000000000001039. Epub 2024 Oct 17. Curr Opin Allergy Clin Immunol. 2024. PMID: 39475850 Free PMC article. Review.
Cited by
-
Altered maturation and activation state of circulating monocytes is associated with their enhanced recruitment in pulmonary arterial hypertension.Respir Res. 2025 Apr 15;26(1):148. doi: 10.1186/s12931-025-03182-0. Respir Res. 2025. PMID: 40234964 Free PMC article.
-
Unusual Talaromyces marneffei and Pneumocystis jirovecii coinfection in a child with a STAT1 mutation: A case report and literature review.Front Immunol. 2023 Feb 20;14:1103184. doi: 10.3389/fimmu.2023.1103184. eCollection 2023. Front Immunol. 2023. PMID: 36891307 Free PMC article. Review.
-
Chronic Mucocutaneous Candidiasis: A Case Report.Clin Cosmet Investig Dermatol. 2023 Jan 25;16:231-236. doi: 10.2147/CCID.S396802. eCollection 2023. Clin Cosmet Investig Dermatol. 2023. PMID: 36721837 Free PMC article.
-
Immunophenotyping and Therapeutic Insights from Chronic Mucocutaneous Candidiasis Cases with STAT1 Gain-of-Function Mutations.J Clin Immunol. 2024 Aug 23;44(8):184. doi: 10.1007/s10875-024-01776-9. J Clin Immunol. 2024. PMID: 39177867
-
Oxidative phosphorylation is a key feature of neonatal monocyte immunometabolism promoting myeloid differentiation after birth.Nat Commun. 2025 Mar 6;16(1):2239. doi: 10.1038/s41467-025-57357-w. Nat Commun. 2025. PMID: 40050264 Free PMC article.
References
MeSH terms
Substances
LinkOut - more resources
Full Text Sources
Research Materials
Miscellaneous