. 2022 Sep 12:13:827786.
doi: 10.3389/fimmu.2022.827786. eCollection 2022.

T cell interaction with activated endothelial cells primes for tissue-residency

Affiliations

T cell interaction with activated endothelial cells primes for tissue-residency

Judith Wienke et al. Front Immunol. .

Abstract

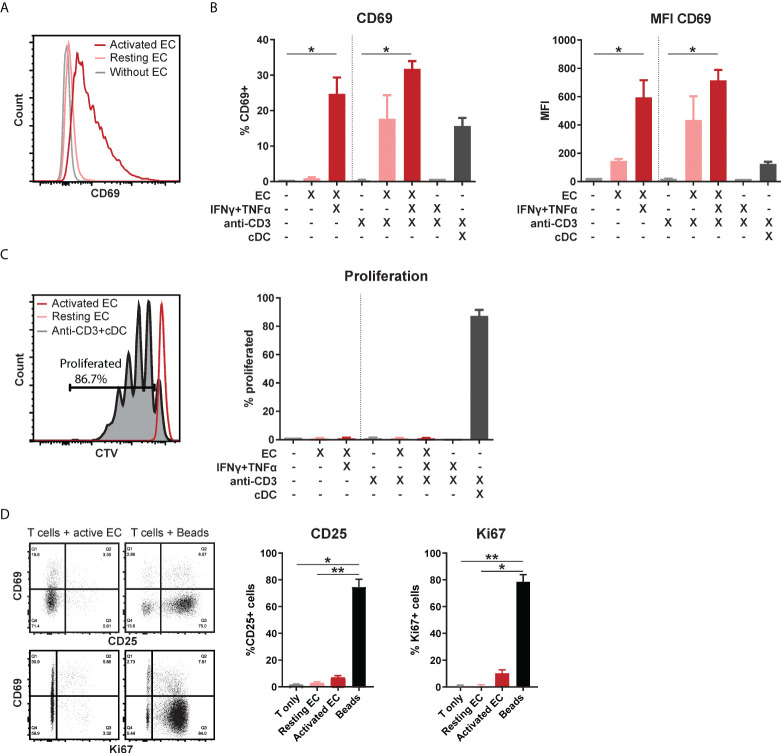
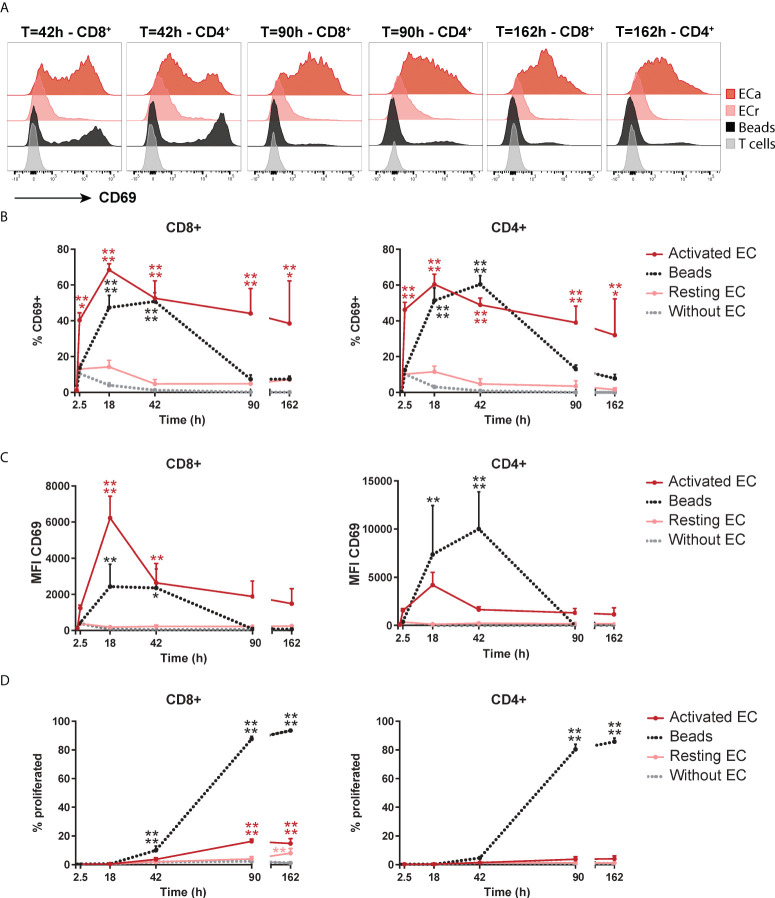
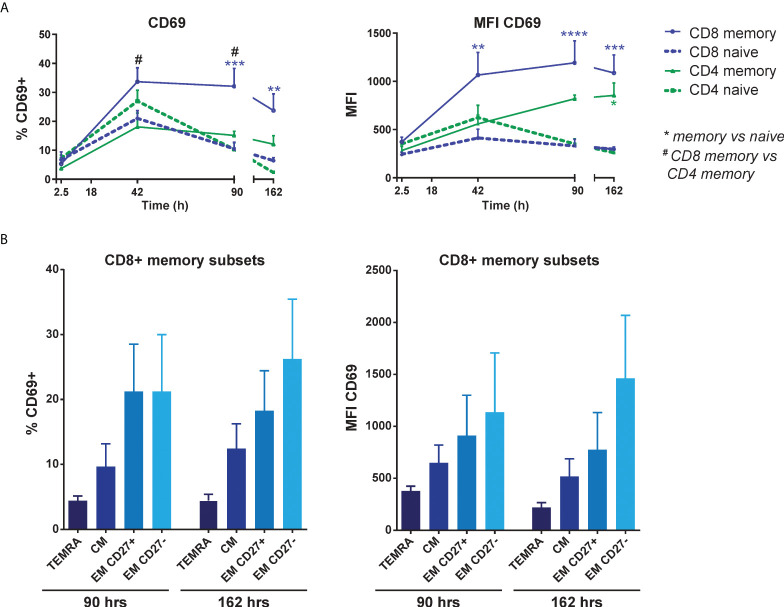
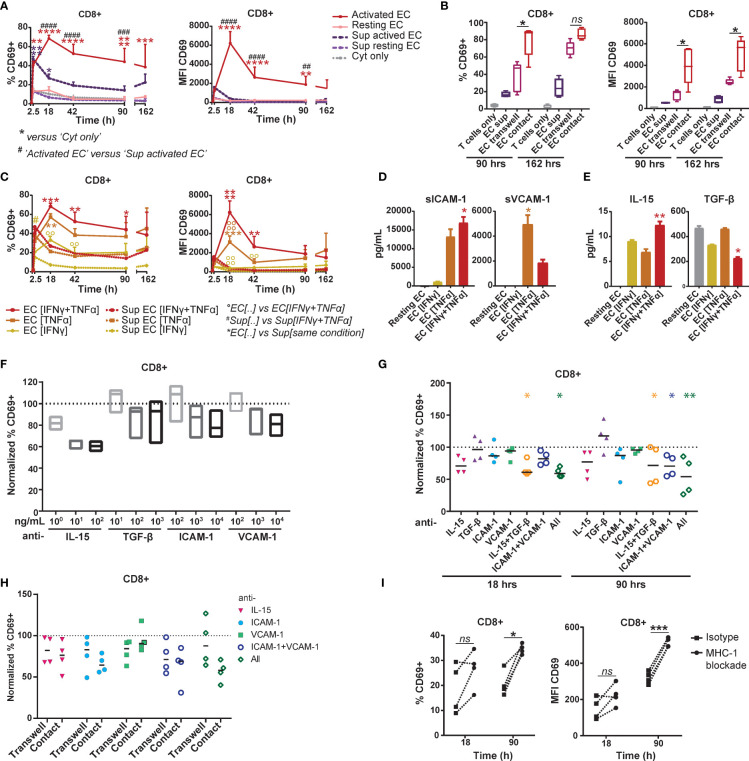
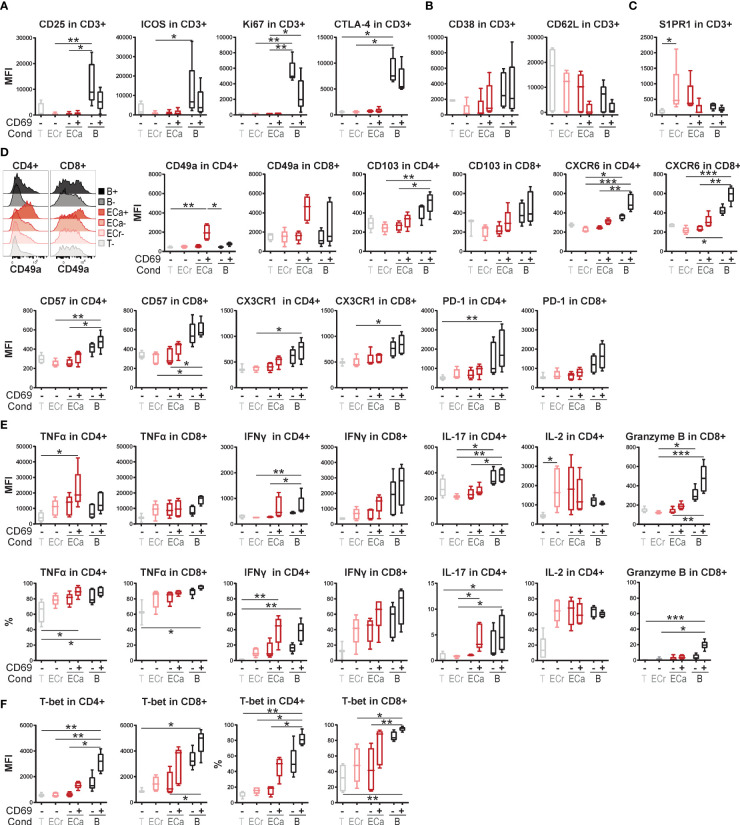
Tissue-resident memory T cells (TRM) are suspected drivers of chronic inflammation, but their induction remains unclear. Since endothelial cells (EC) are obligate interaction partners for T cells trafficking into inflamed tissues, they may play a role in TRM development. Here, we used an in vitro co-culture system of human cytokine-activated EC and FACS-sorted T cells to study the effect of EC on T(RM) cell differentiation. T cell phenotypes were assessed by flow cytometry, including proliferation measured by CellTrace Violet dilution assay. Soluble mediators were analyzed by multiplex immunoassay. Co-culture of T cells with cytokine-activated, but not resting EC induced CD69 expression without activation (CD25, Ki67) or proliferation. The dynamic of CD69 expression induced by EC was distinct from that induced by TCR triggering, with rapid induction and stable expression over 7 days. CD69 induction by activated EC was higher in memory than naive T cells, and most pronounced in CD8+ effector memory T cells. Early CD69 induction was mostly mediated by IL-15, whereas later effects were also mediated by interactions with ICAM-1 and/or VCAM-1. CD69+ T cells displayed a phenotype associated with tissue-residency, with increased CD49a, CD103, CXCR6, PD-1 and CD57 expression, and decreased CD62L and S1PR1. EC-induced CD69+ T cells were poised for high production of pro-inflammatory cytokines and showed increased expression of T-helper 1 transcription factor T-bet. Our findings demonstrate that activated EC can induce functional specialization in T cells with sustained CD69 expression, increased cytokine response and a phenotypic profile reminiscent of TRM. Interaction with activated EC during transmigration into (inflamed) tissues thus contributes to TRM-residency priming.

Keywords: CD69; T cell differentiation; endothelial cell; inflammation; tissue-resident memory T cells.


Conflict of interest statement

The authors declare that the research was conducted in the absence of any commercial or financial relationships that could be construed as a potential conflict of interest.

Figures

Figure 1
Figure 1
Activated EC induce CD69 expression in T cells, without proliferation or activation. HMEC were left unstimulated or stimulated with TNFα and IFNγ for 3 days before addition of FACS-sorted CD3+ T cells to the co-culture, in the presence or absence of soluble anti-CD3 stimulation. Conventional dendritic cells (cDC) were added as a positive control to induce T cell proliferation. CD69 expression was analyzed by flow cytometry after 4 days of co-culture. (A) Representative flow cytometry plot, (B) percentage of positive cells and median fluorescent intensity (MFI). Kruskal-Wallis with Dunn’s post-hoc test compared to unstimulated, c.q. only anti-CD3 stimulated T cells. *p < 0.05. (C) Proliferation was assessed by CellTrace Violet (CTV) dilution assay. Kruskal-Wallis with Dunn’s post-hoc test. (D) Expression of CD25 and Ki67 after 4 days of co-culture with unstimulated T cells, resting/activated HMEC or anti-CD3/CD28 beads. N = 3, mean+SEM. Kruskal-Wallis with Dunn’s post-hoc test. *p < 0.05, **p < 0.01.
Figure 2
Figure 2
Activated EC induce a distinct dynamic of CD69 expression on T cells. HMEC were left unstimulated (resting) or stimulated with 10 ng/mL TNFα and IFNγ for 3 days (activated) before addition of FACS-sorted CD3+ T cells to the co-culture. CD69 expression and proliferation were assessed at various time points of the co-culture. As a positive control, T cells were cultured with anti-CD3/CD28 beads. (A) Representative flow cytometry plots of CD69 expression in CD4+ and CD8+ T cells over time. (B) Percentage of CD69+ cells within CD4+ and CD8+ T cells. (C) Median fluorescent intensity (MFI) of CD69 expression on T cells. (D) Percentage of proliferated T cells assessed by CellTrace Violet dilution assay. N = 3, mean+SEM. 2-Way-ANOVA with Sidak post-hoc test. *P < 0.05, **P < 0.01, ***P < 0.001, ****P < 0.0001.
Figure 3
Figure 3
EC-induced CD69 expression is most pronounced in effector memory CD8+ T cells. HMEC were stimulated with 10 ng/mL TNFα and IFNγ for 3 days before addition of FACS-sorted naive CD3+ or memory CD3+ T cells to the co-culture. CD69 expression was assessed at various time points of the co-culture by flow cytometry. (A) Percentage of CD69+ cells (left panel) and median fluorescent intensity (MFI) of CD69 (right panel) on naive and memory CD4+ and CD8+ T cells. N = 4, mean+SEM. 2-Way-ANOVA with Sidak post-hoc test. */#P < 0.05, **P < 0.01, ***P < 0.001,****P < 0.0001. (B) Percentage of CD69+ cells (left panel) and median fluorescent intensity (MFI) of CD69 expression (right panel) on sorted CD8+ memory T cell subsets after co-culture with activated HMEC. TEMRA, terminally differentiated CD45RA+ effector memory T cells (CD45RA+CCR7-); CM, central memory T cells (CD45RA-CCR7+); EM, effector memory T cells (CD45RA-CCR7-). N = 6, mean+SEM. 2-Way-ANOVA with Sidak post-hoc test.
Figure 4
Figure 4
EC-induced CD69 expression on memory CD8+ T cells is partly mediated by synergistic action of IL-15, ICAM-1 and VCAM-1. (A+B+C) HMEC were left unstimulated (resting) or stimulated with 10 ng/mL TNFα and/or IFNγ for 3 days (activated) before addition of FACS-sorted memory CD3+ T cells to the co-culture or HMEC cultured medium. CD69 expression and proliferation were assessed at various time points of the co-culture. (A) Percentage of CD69+ cells (left panel) and median fluorescent intensity (MFI) of CD69 (right panel) within CD8+ T cells after co-culture with TNFα and IFNγ-stimulated HMEC, resting HMEC, their cultured medium (sup), or TNFα and IFNγ alone (cyt only). N=3, mean+SEM. 2-Way-ANOVA with Sidak post-hoc test. */#/0P < 0.05, **/##/00P < 0.01, ***/###/000P < 0.001,****/####/0000P < 0.0001. (B) Percentage of CD69+ cells (left panel) and median fluorescent intensity (MFI) of CD69 (right panel) within CD8+ T cells after culture with activated HMEC cultured medium (sup), transwell co-culture or direct co-culture with activated HMEC. N = 5, median. 2-Way ANOVA with Sidak’s multiple comparison test; *p < 0.05, ns = not significant. (C) Percentage of CD69+ cells (left panel) and median fluorescent intensity (MFI) of CD69 (right panel) within CD8+ T cells after co-culture with TNFα- and/or IFNγ-stimulated HMEC or their cultured medium (sup). N = 3, mean+SEM. 2-Way-ANOVA with Sidak post-hoc test. */#/0P < 0.05, **/##/00P < 0.01, ***/###/000P < 0.001,****/####/0000P < 0.0001. (D+E) Levels of soluble ICAM-1 and VCAM-1 (D) and IL-15 and TGF-β (E) measured in cultured medium of resting or TNFα- and/or IFNγ-stimulated HMEC after 3 days, by multiplex immunoassay. N = 3, mean+SEM. Kruskal-Wallis with Dunn’s post-hoc test versus resting EC. *P < 0.05, **P < 0.01. (F+G) Co-culture of TNFα and IFNγ-stimulated HMEC with FACS-sorted memory CD3+ T cells in the presence of (increasing concentrations) of monoclonal antibodies blocking IL-15, TGF-β, ICAM-1 and/or VCAM. (F) The percentage of CD69+ cells was measured by flow cytometry after 18 hours and normalized to the percentage of CD69+ cells in the condition with isotype control (set to 100). N = 3, median. Kruskal-Wallis with Dunn’s post-hoc test versus isotype. (G) The percentage of CD69+ cells was measured by flow cytometry after 18 and 90 hours and normalized to the condition with isotype control (set to 100). N = 4, median. 2-Way-ANOVA with Sidak post-hoc test versus isotype. *P < 0.05, **P < 0.01. (H) Transwell and direct co-culture of TNFα and IFNγ-stimulated HMEC with FACS-sorted memory CD3+ T cells in the presence of monoclonal antibodies blocking IL-15, ICAM-1 and/or VCAM. Percentage of CD69+ cells within CD8+ T cells was measured by flow cytometry after 90 hours and normalized to the condition with isotype control (set to 100). N = 4, median. 2-Way-ANOVA with Sidak post-hoc test versus isotype. (I) Co-culture of TNFα and IFNγ-stimulated HMEC with FACS-sorted memory CD3+ T cells in the presence of 35 μg/mL monoclonal antibody blocking HLA-ABC or isotype control. The percentage of CD69+ cells and median fluorescent intensity (MFI) of CD69 was measured by flow cytometry after 18 and 90 hours. N = 4. Dotted lines indicate paired measurements. 2-Way-ANOVA with Sidak post-hoc test versus isotype. *P < 0.05, ***P < 0.001.
Figure 5
Figure 5
Expression of tissue-resident memory T cell associated markers in EC-stimulated T cells. (A–F) Co-culture of resting or TNFα and IFNγ-stimulated HMEC or anti-CD3/CD28 beads with FACS-sorted memory CD3+ T cells. Expression of activation markers (A) and effector/memory markers (B) was assessed by flow cytometry after 4 days of co-culture. Expression of markers associated with tissue-residency (C+D), cytokines (E) and transcription factors (F) was assessed by flow cytometry after 7 days of co-culture. Cytokine expression was measured intracellularly after restimulation. N = 5, boxplots with median. Cond, condition; T, T cells only (CD69-); ECr, resting EC (CD69-); ECa, activated EC (CD69- and CD69+); B, anti-CD3/CD28 beads (CD69- and CD69+). Kruskal-Wallis with Dunn’s post-hoc test. *P < 0.05, **P < 0.01,***P < 0.0001.

References

    1. Pober JS, Sessa WC. Evolving functions of endothelial cells in inflammation. Nat Rev Immunol (2007) 7(10):803–15. doi: 10.1038/nri2171 - DOI - PubMed
    1. Mir E, Palomo M, Rovira M, Pereira A, Escolar G, Penack O, et al. . Endothelial damage is aggravated in acute GvHD and could predict its development. Bone Marrow Transplant (2017) 52(9):1317–25. doi: 10.1038/bmt.2017.121 - DOI - PubMed
    1. Shen N, Ffrench P, Guyotat D, Ffrench M, Fiere D, Bryon PA, et al. . Expression of adhesion molecules in endothelial cells during allogeneic bone marrow transplantation. Eur J Haematol (1994) 52(5):296–301. doi: 10.1111/j.1600-0609.1994.tb00099.x - DOI - PubMed
    1. Tyden H, Lood C, Gullstrand B, Nielsen CT, Heegaard NHH, Kahn R, et al. . Endothelial dysfunction is associated with activation of the type I interferon system and platelets in patients with systemic lupus erythematosus. RMD Open (2017) 3(2):e000508. doi: 10.1136/rmdopen-2017-000508 - DOI - PMC - PubMed
    1. Mostmans Y, Cutolo M, Giddelo C, Decuman S, Melsens K, Declercq H, et al. . The role of endothelial cells in the vasculopathy of systemic sclerosis: A systematic review. Autoimmun Rev (2017) 16(8):774–86. doi: 10.1016/j.autrev.2017.05.024 - DOI - PubMed

MeSH terms