. 2022 Nov;42(11):1355-1374.
doi: 10.1161/ATVBAHA.122.317953. Epub 2022 Sep 29.

Aortic Cellular Diversity and Quantitative Genome-Wide Association Study Trait Prioritization Through Single-Nuclear RNA Sequencing of the Aneurysmal Human Aorta

Affiliations

Aortic Cellular Diversity and Quantitative Genome-Wide Association Study Trait Prioritization Through Single-Nuclear RNA Sequencing of the Aneurysmal Human Aorta

Elizabeth L Chou et al. Arterioscler Thromb Vasc Biol. 2022 Nov.

Abstract

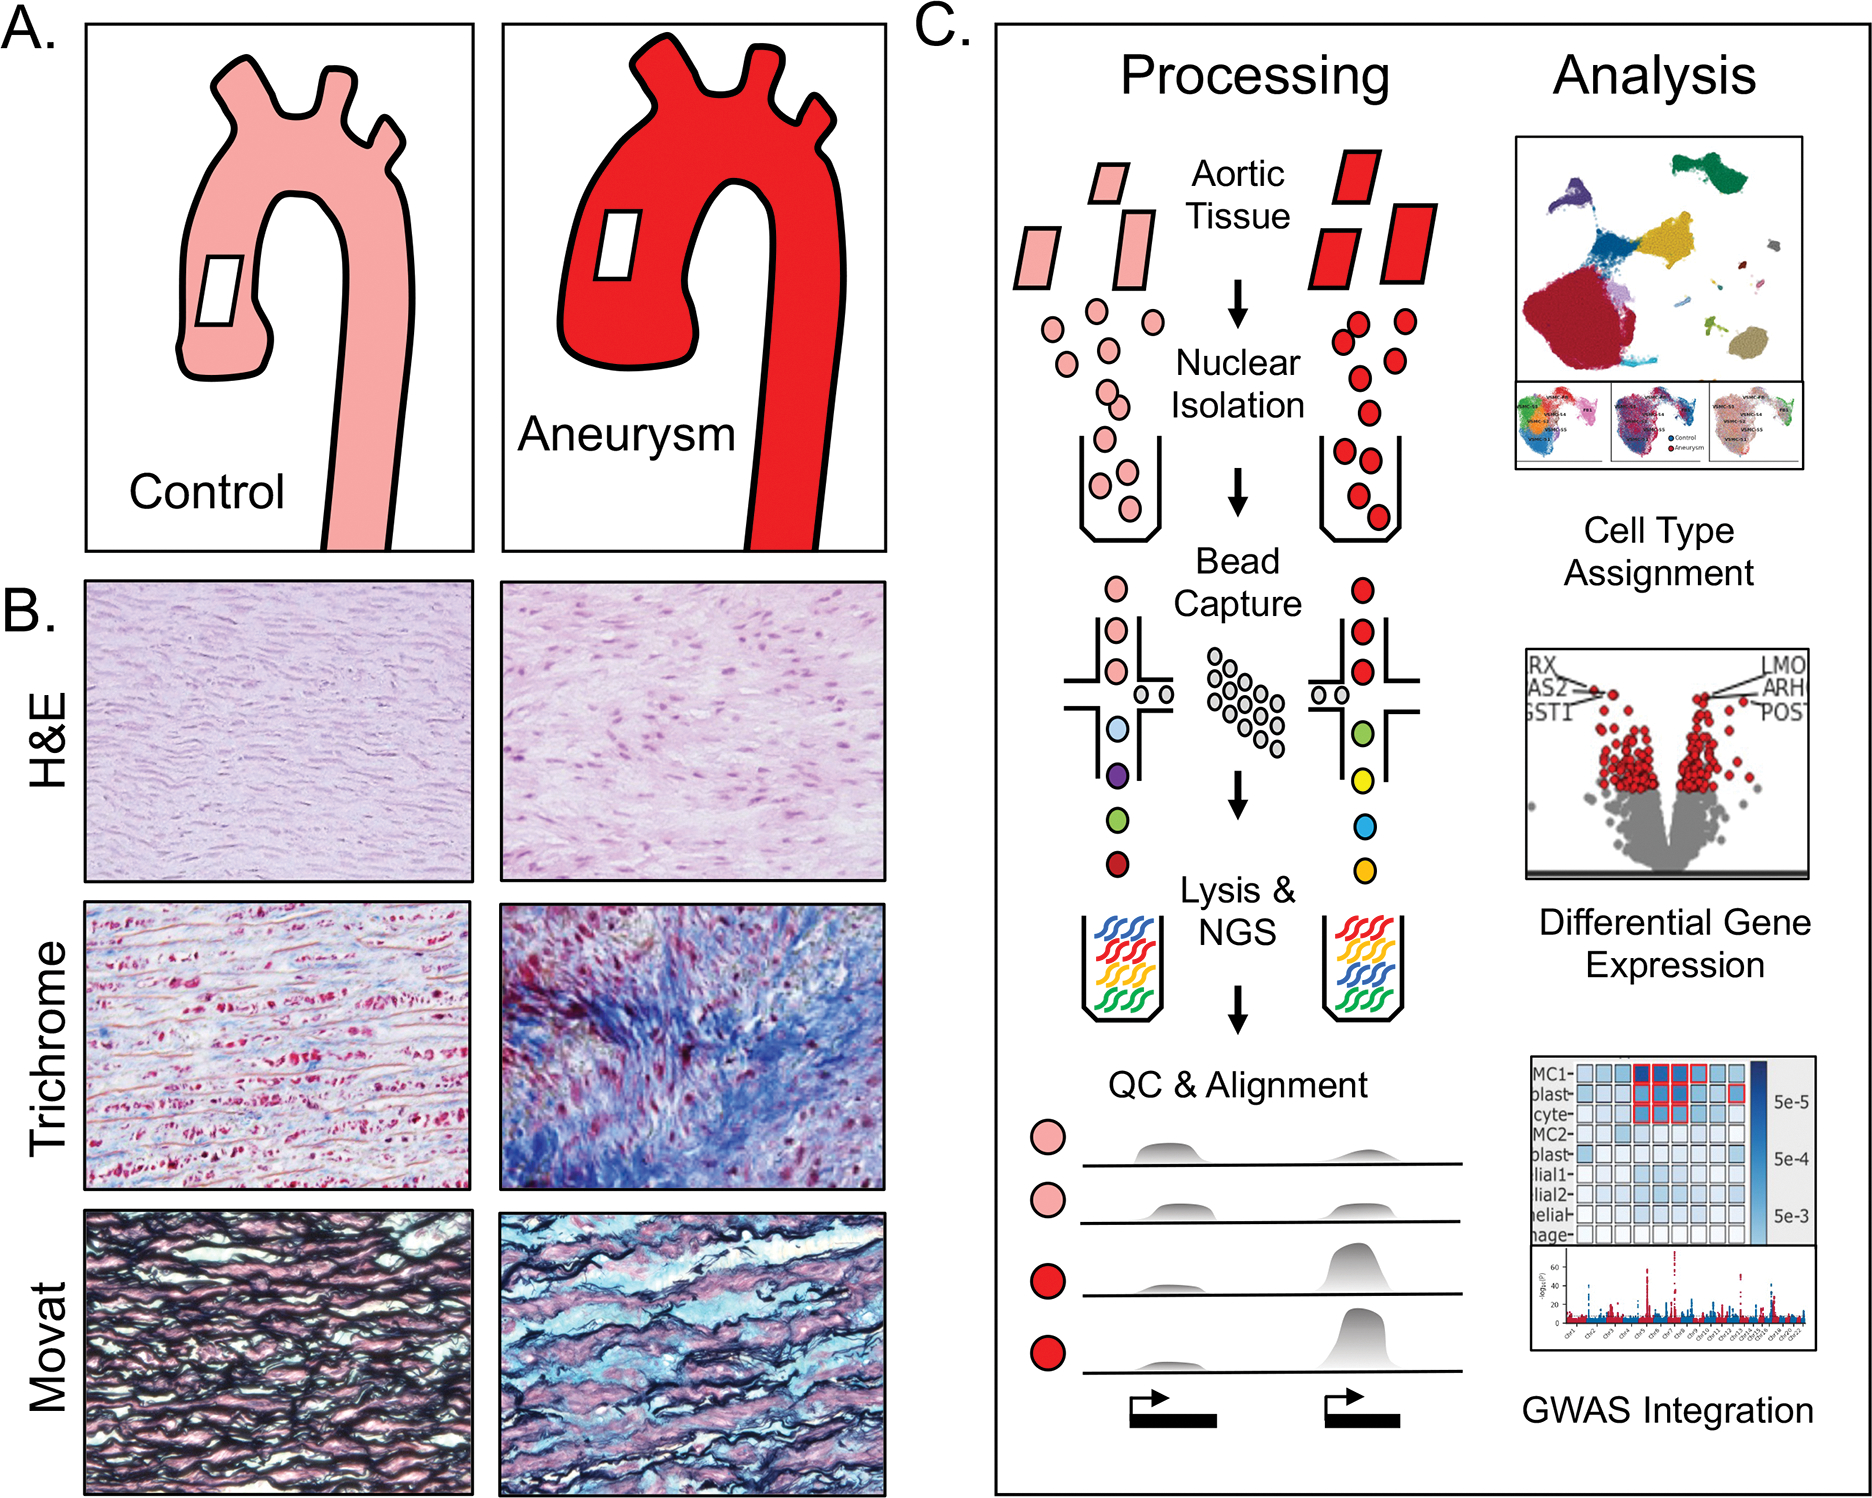
Background: Mural cells in ascending aortic aneurysms undergo phenotypic changes that promote extracellular matrix destruction and structural weakening. To explore this biology, we analyzed the transcriptional features of thoracic aortic tissue.

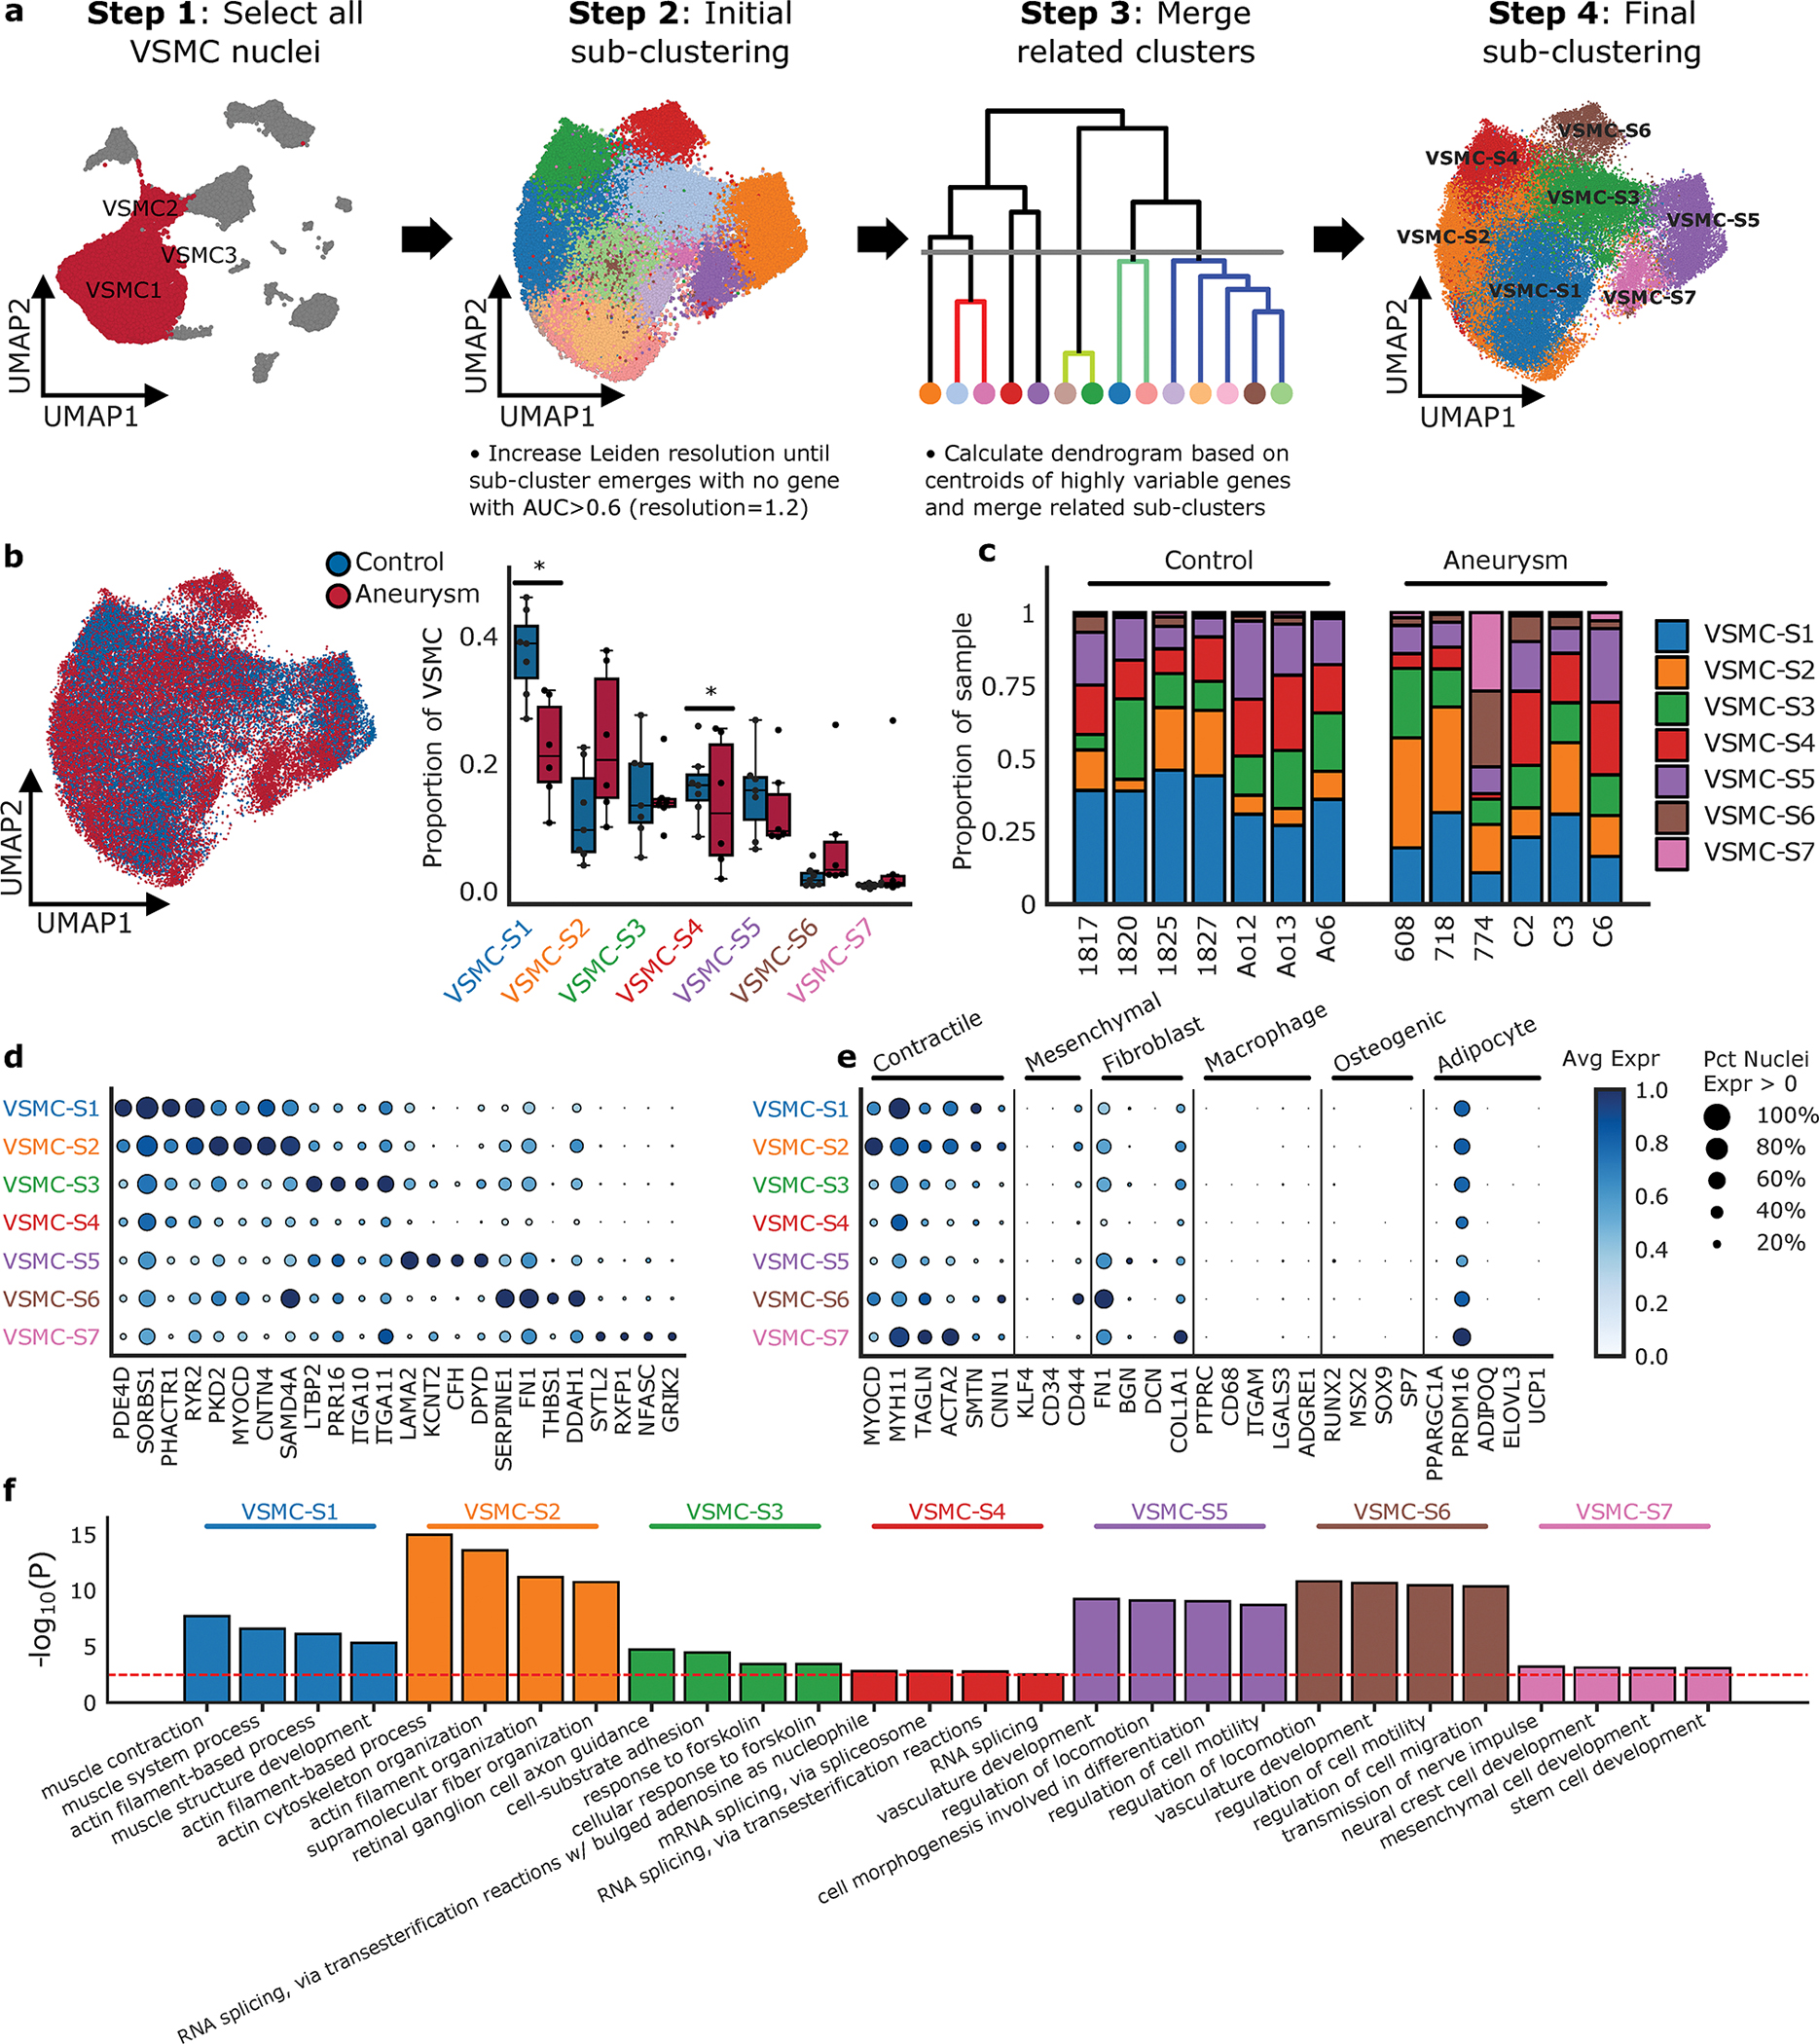
Methods: Single-nuclear RNA sequencing was performed on 13 samples from human donors, 6 with thoracic aortic aneurysm, and 7 without aneurysm. Individual transcriptomes were then clustered based on transcriptional profiles. Clusters were used for between-disease differential gene expression analyses, subcluster analysis, and analyzed for intersection with genetic aortic trait data.

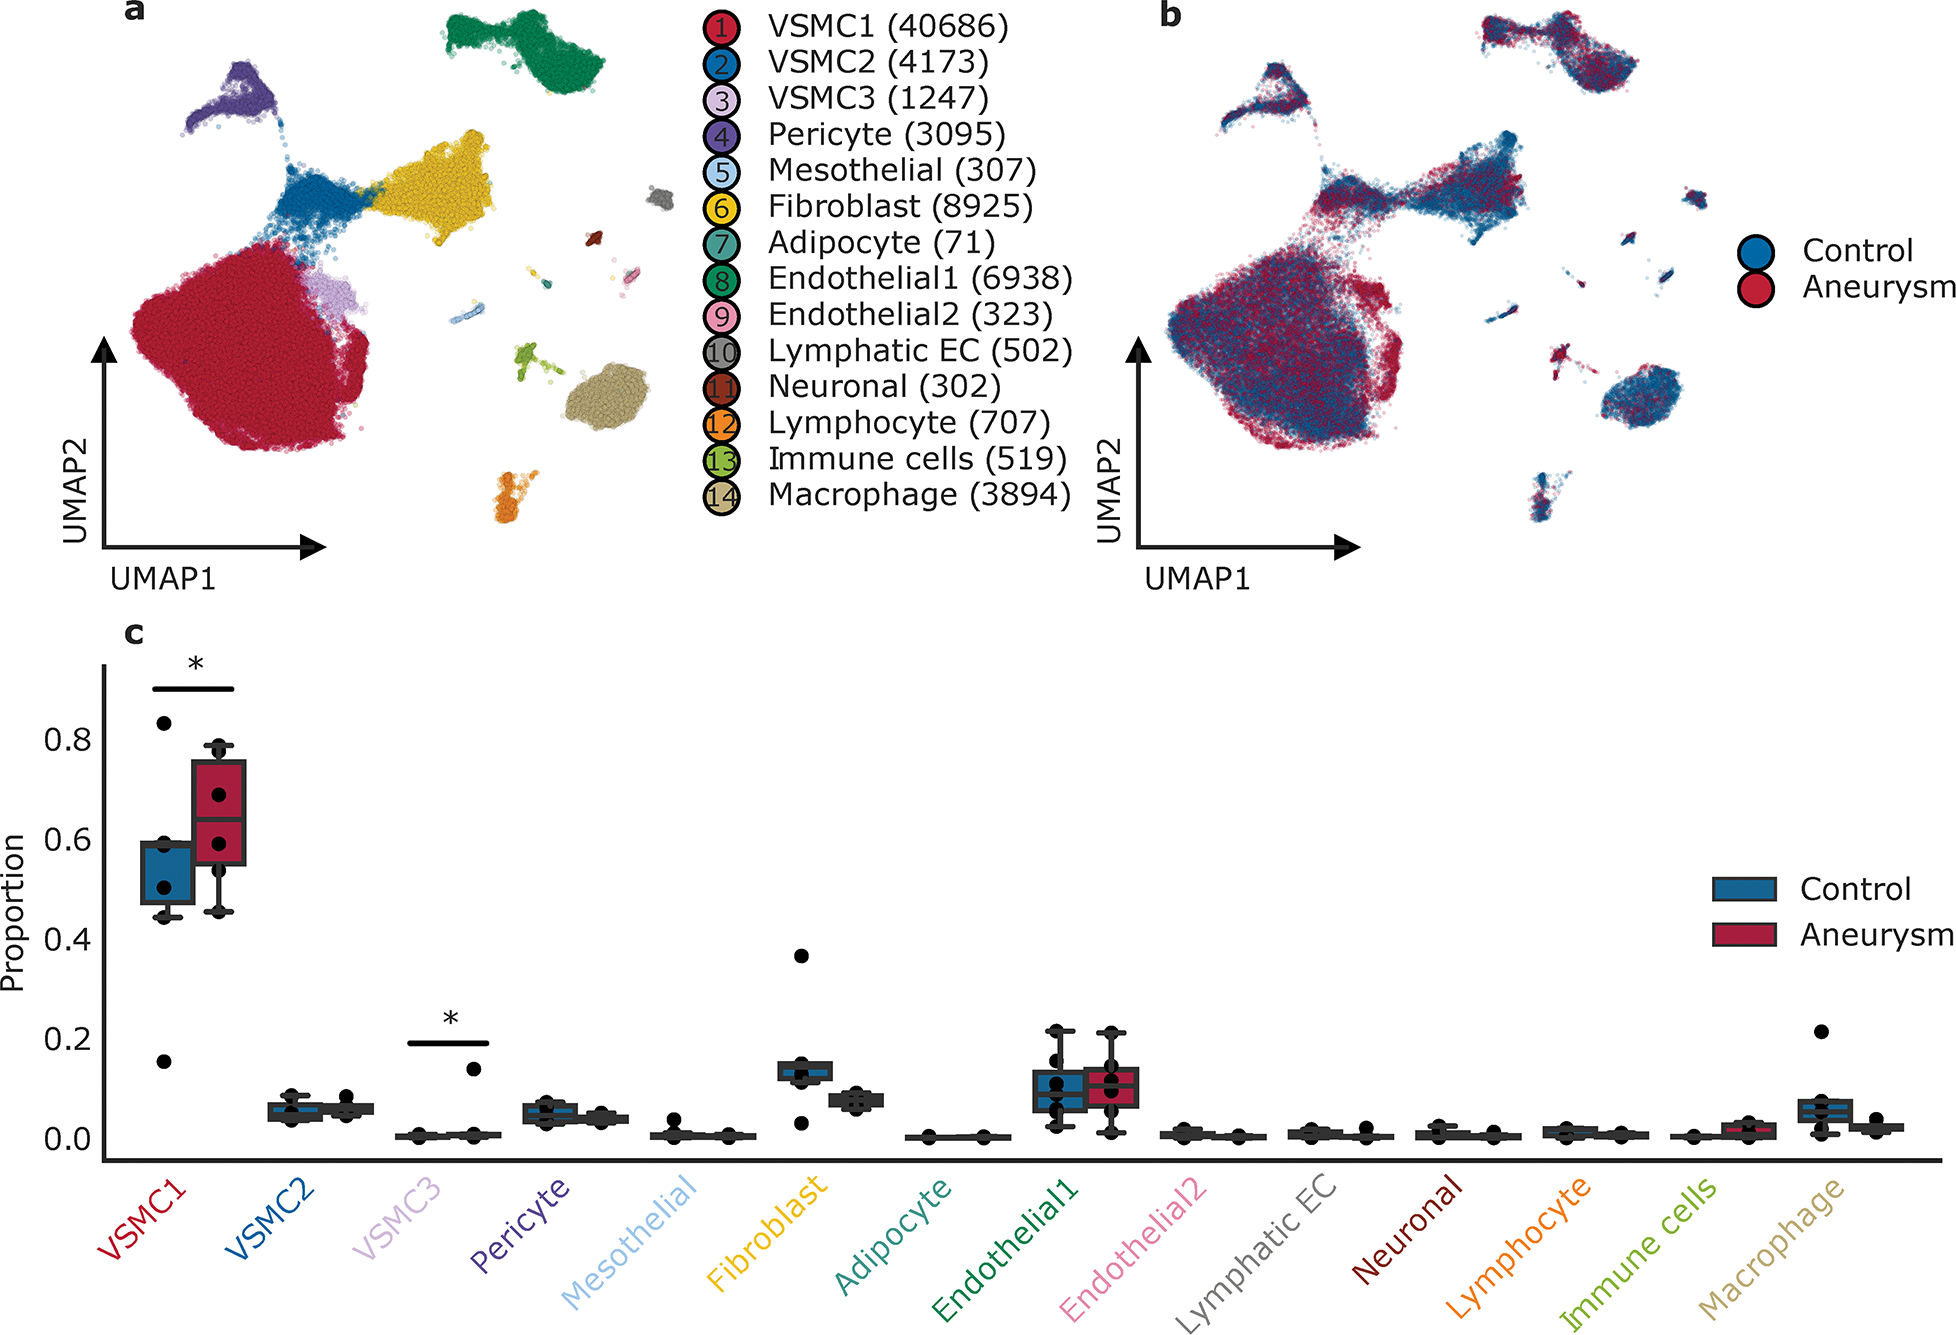
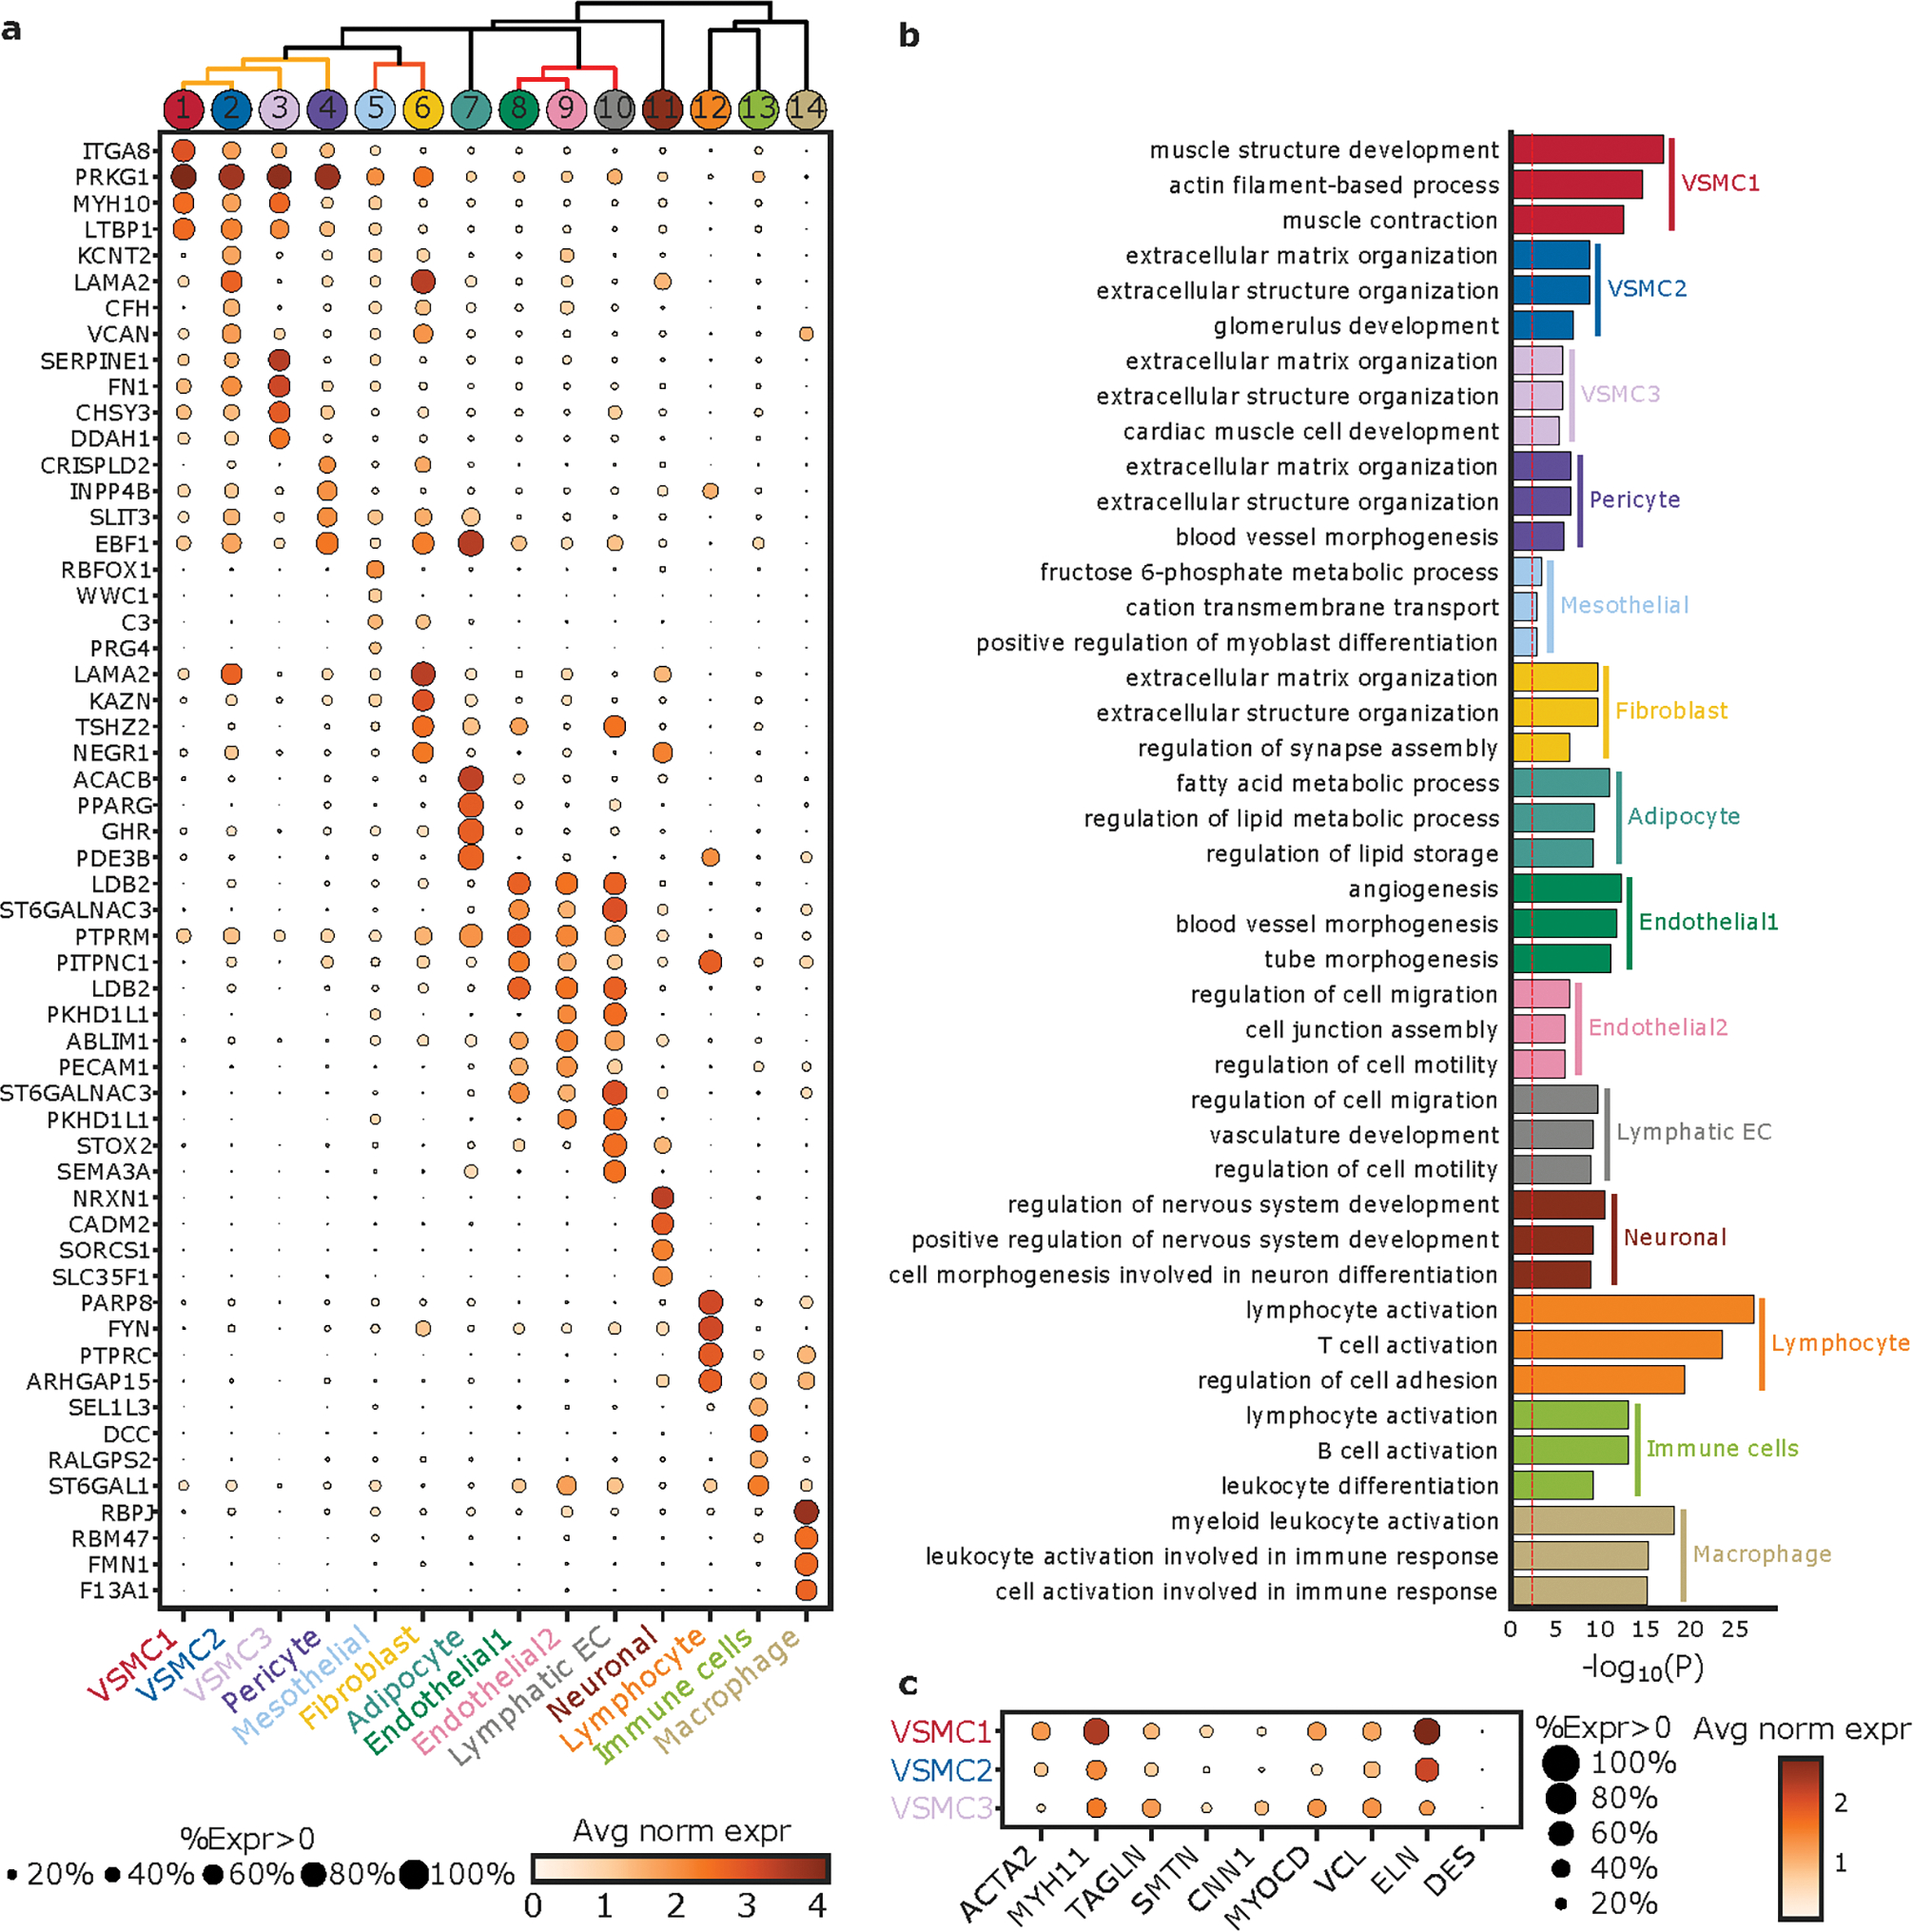
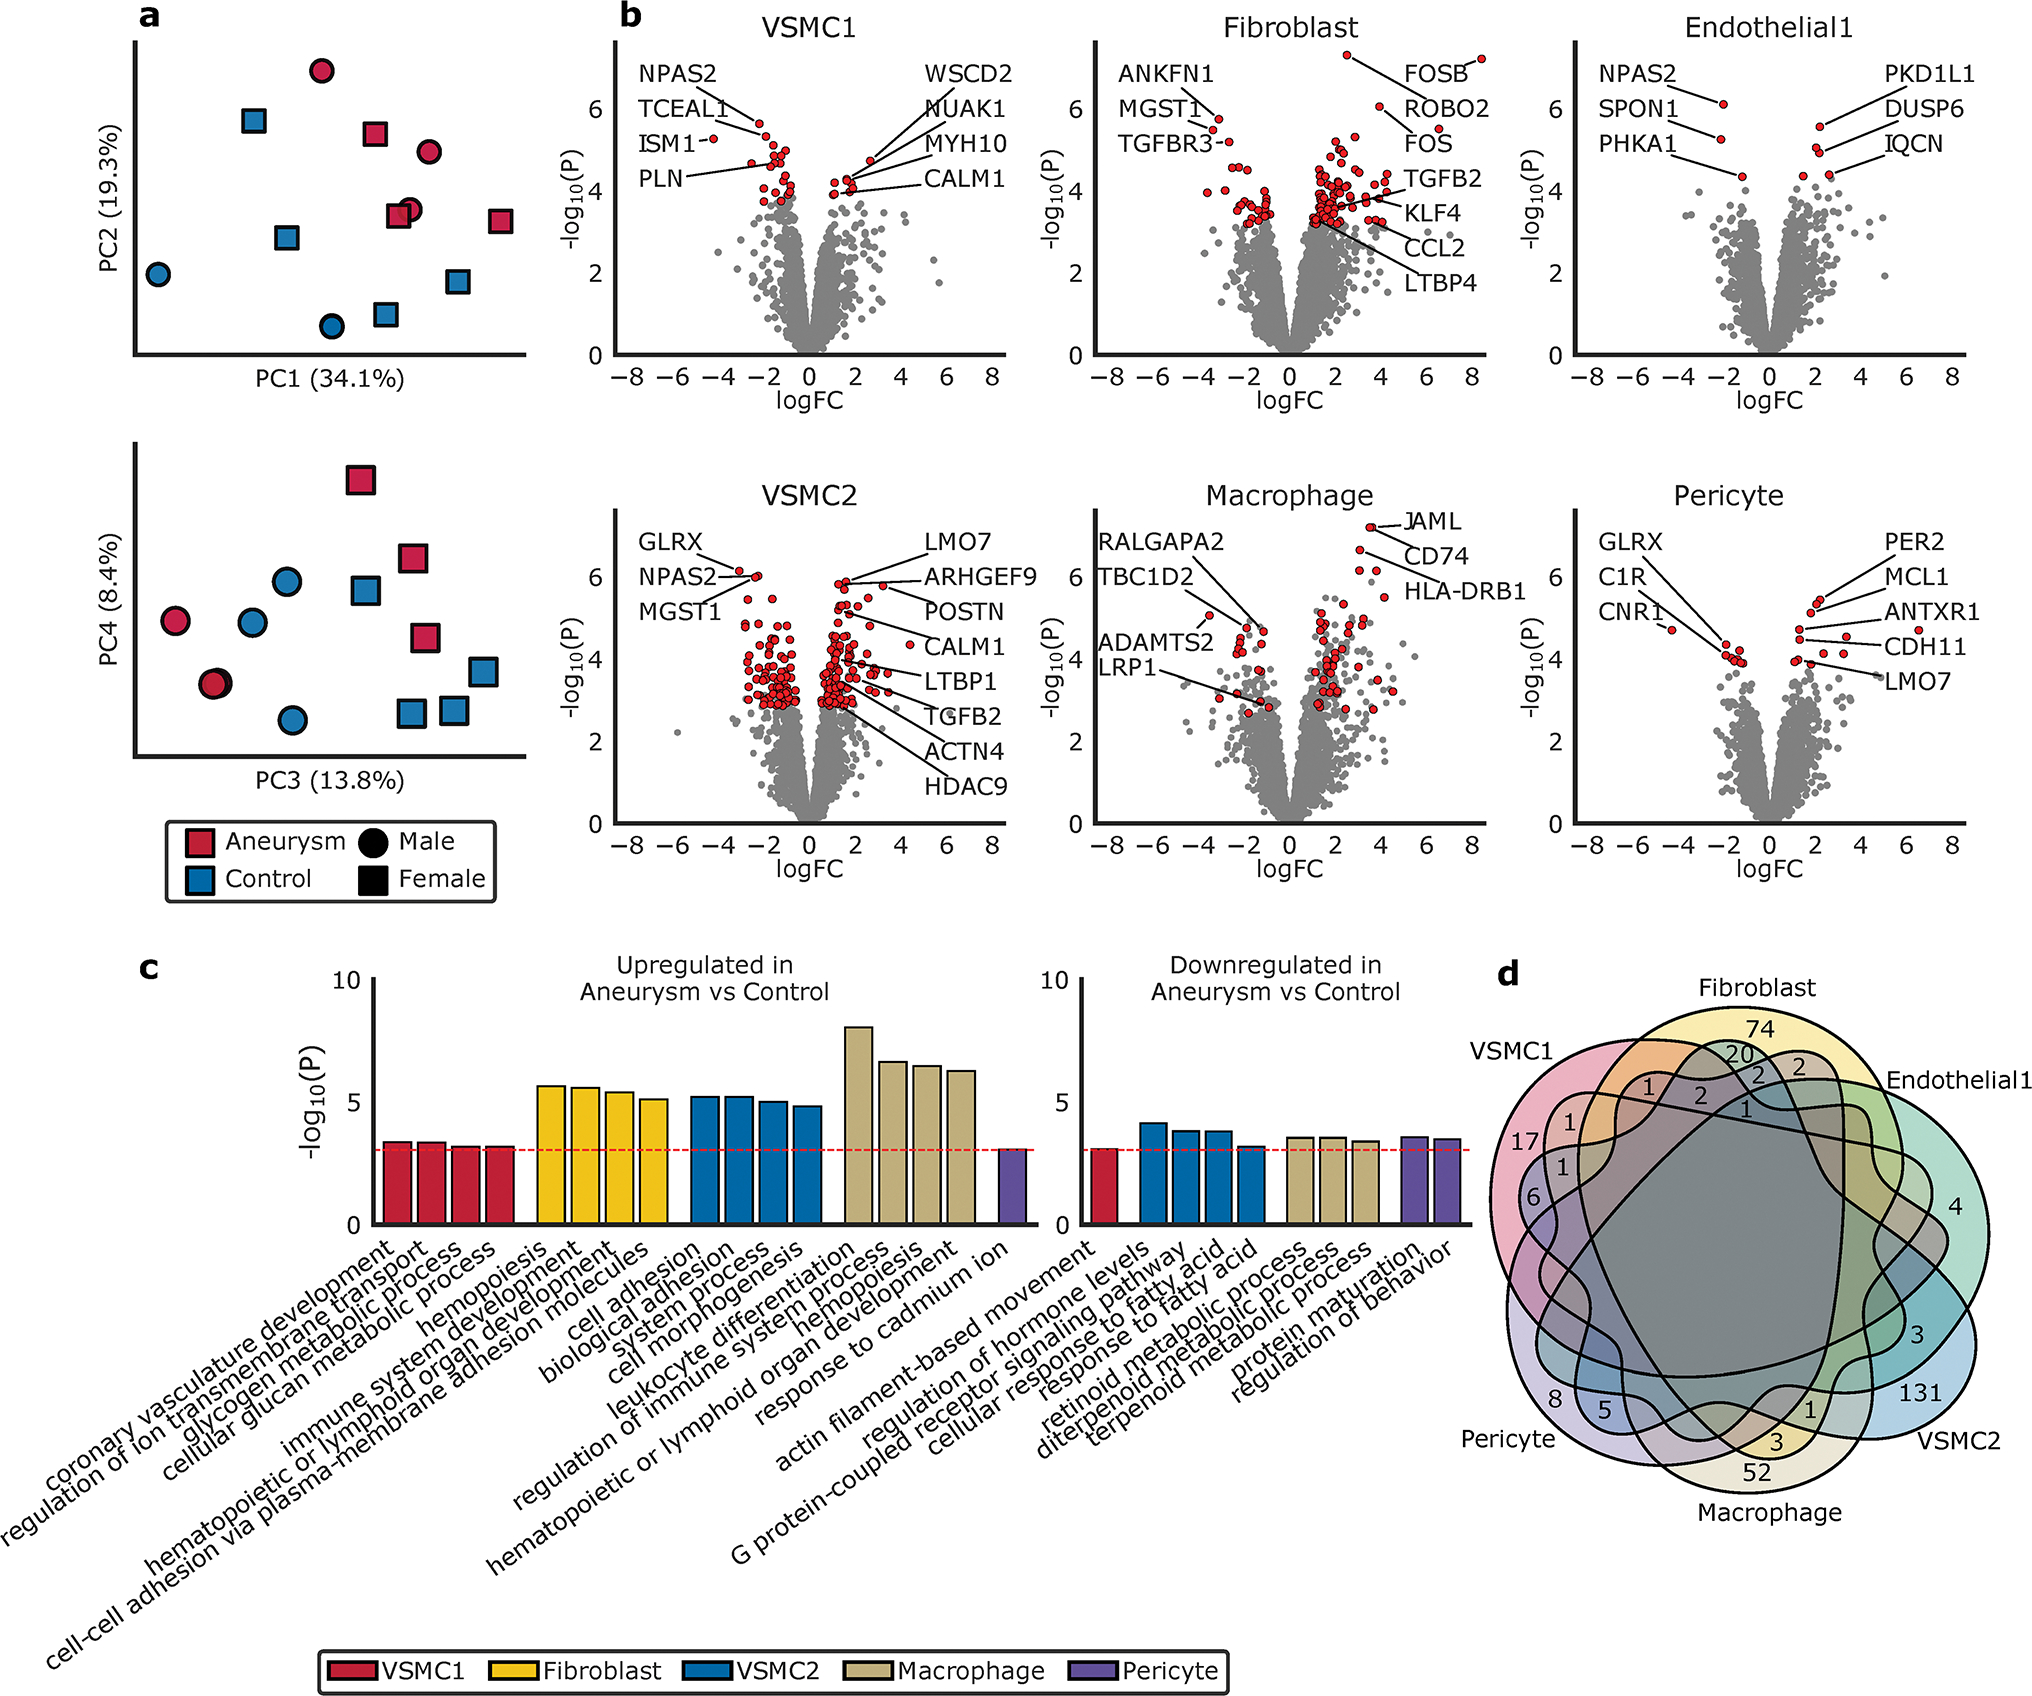
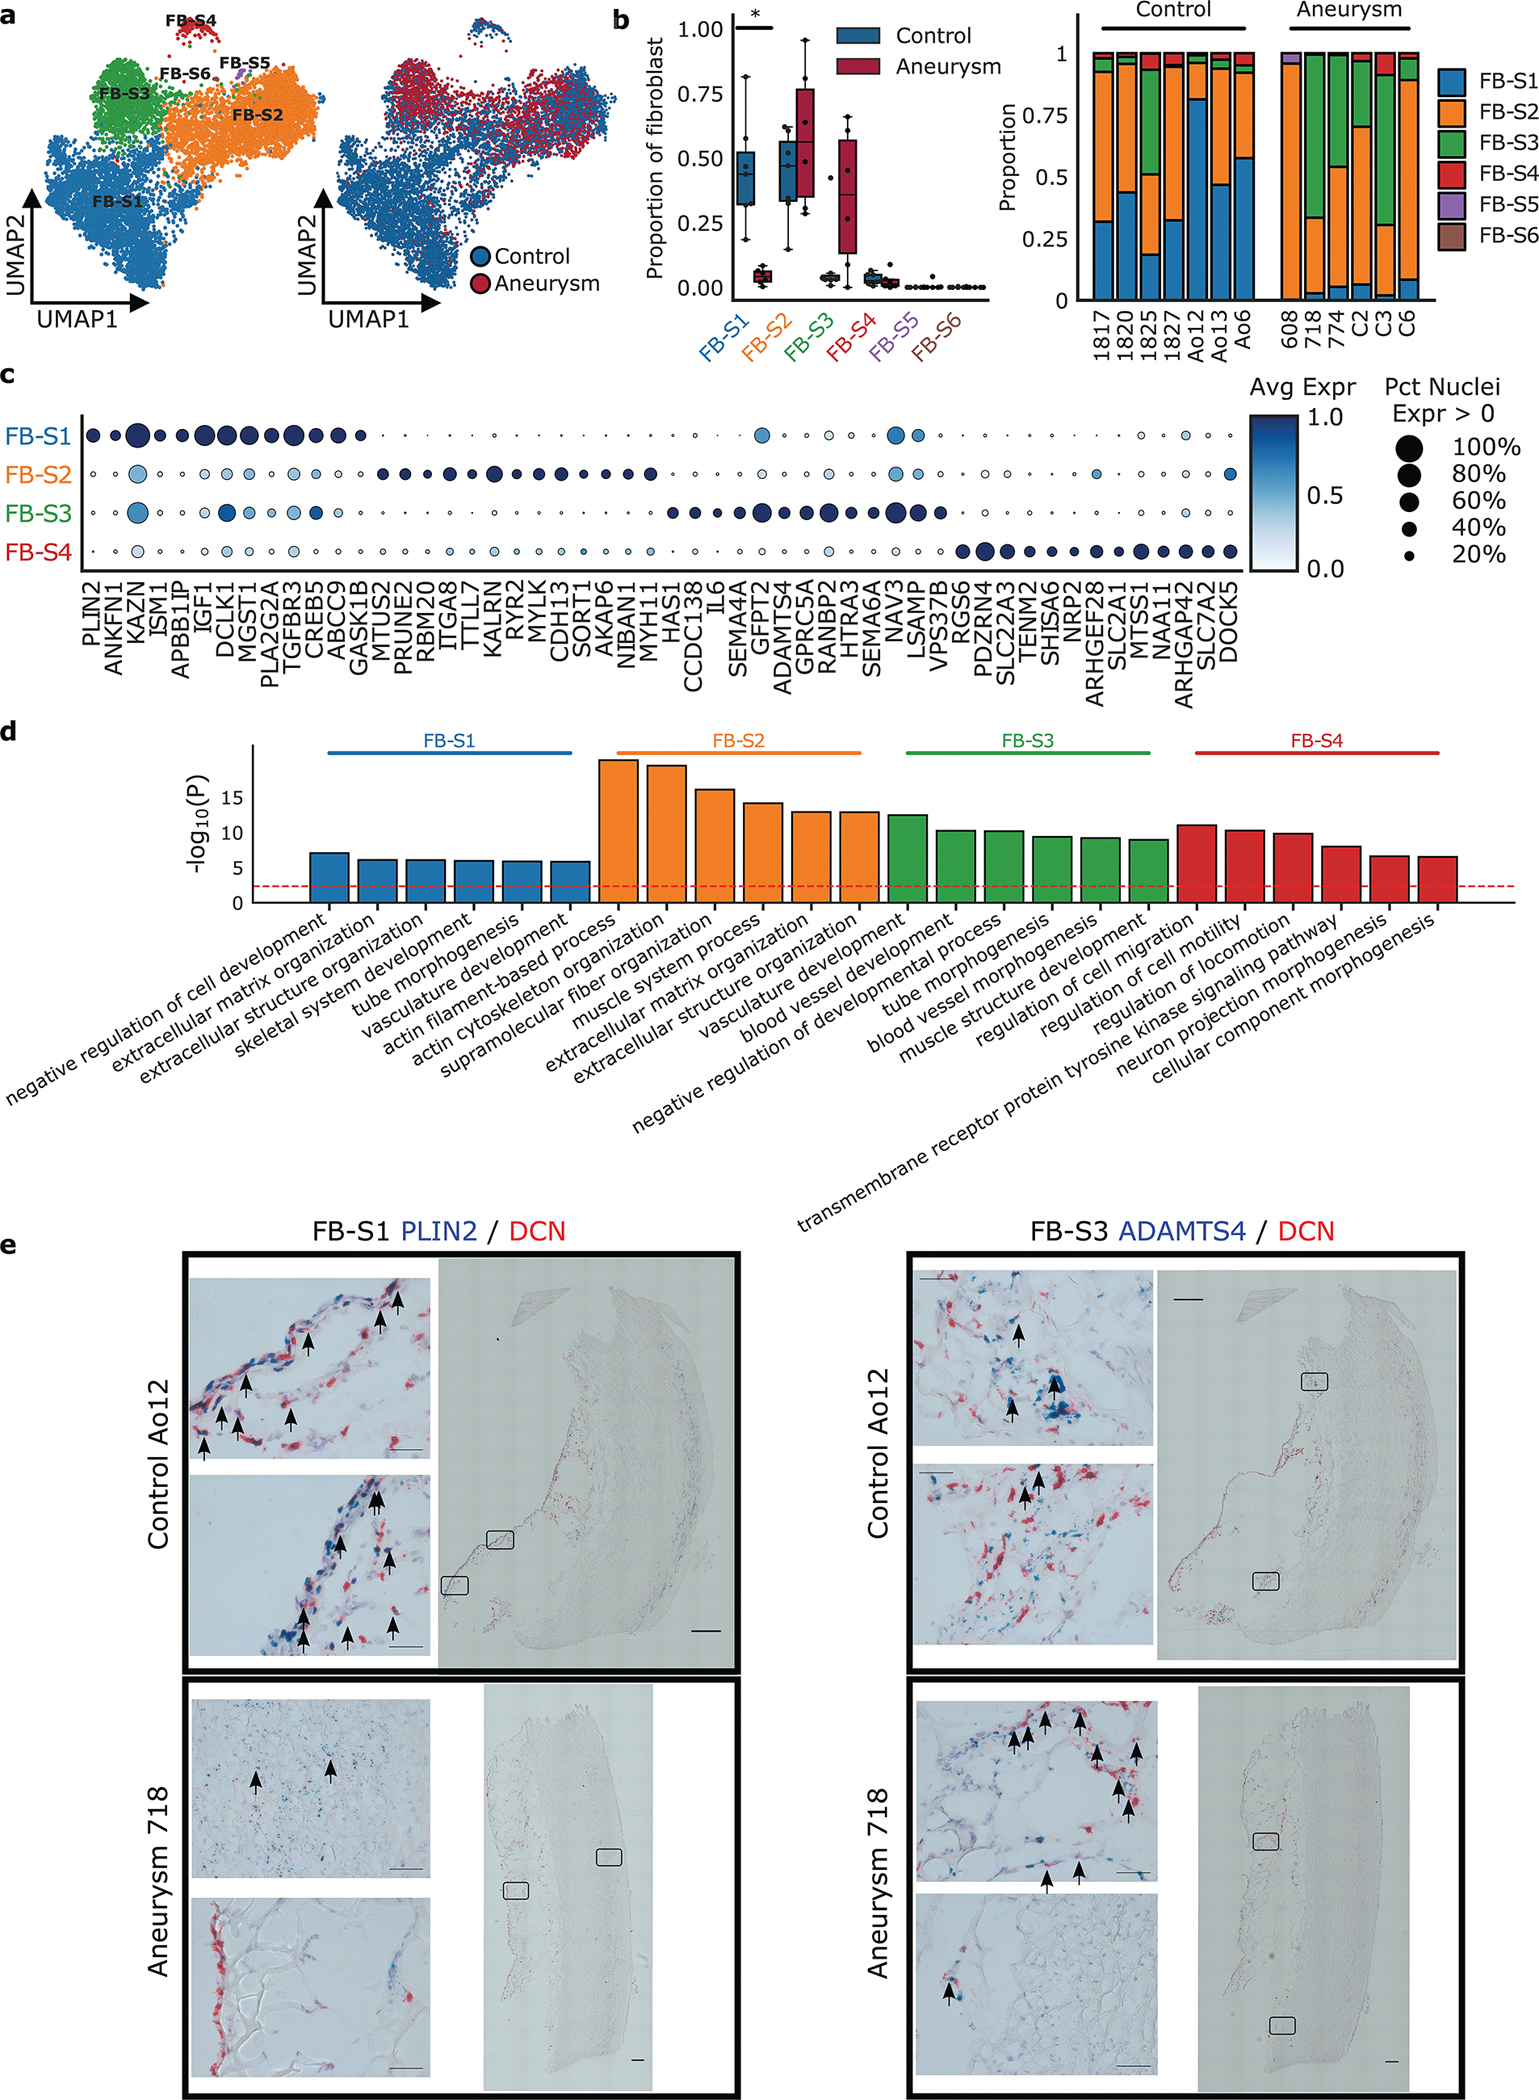
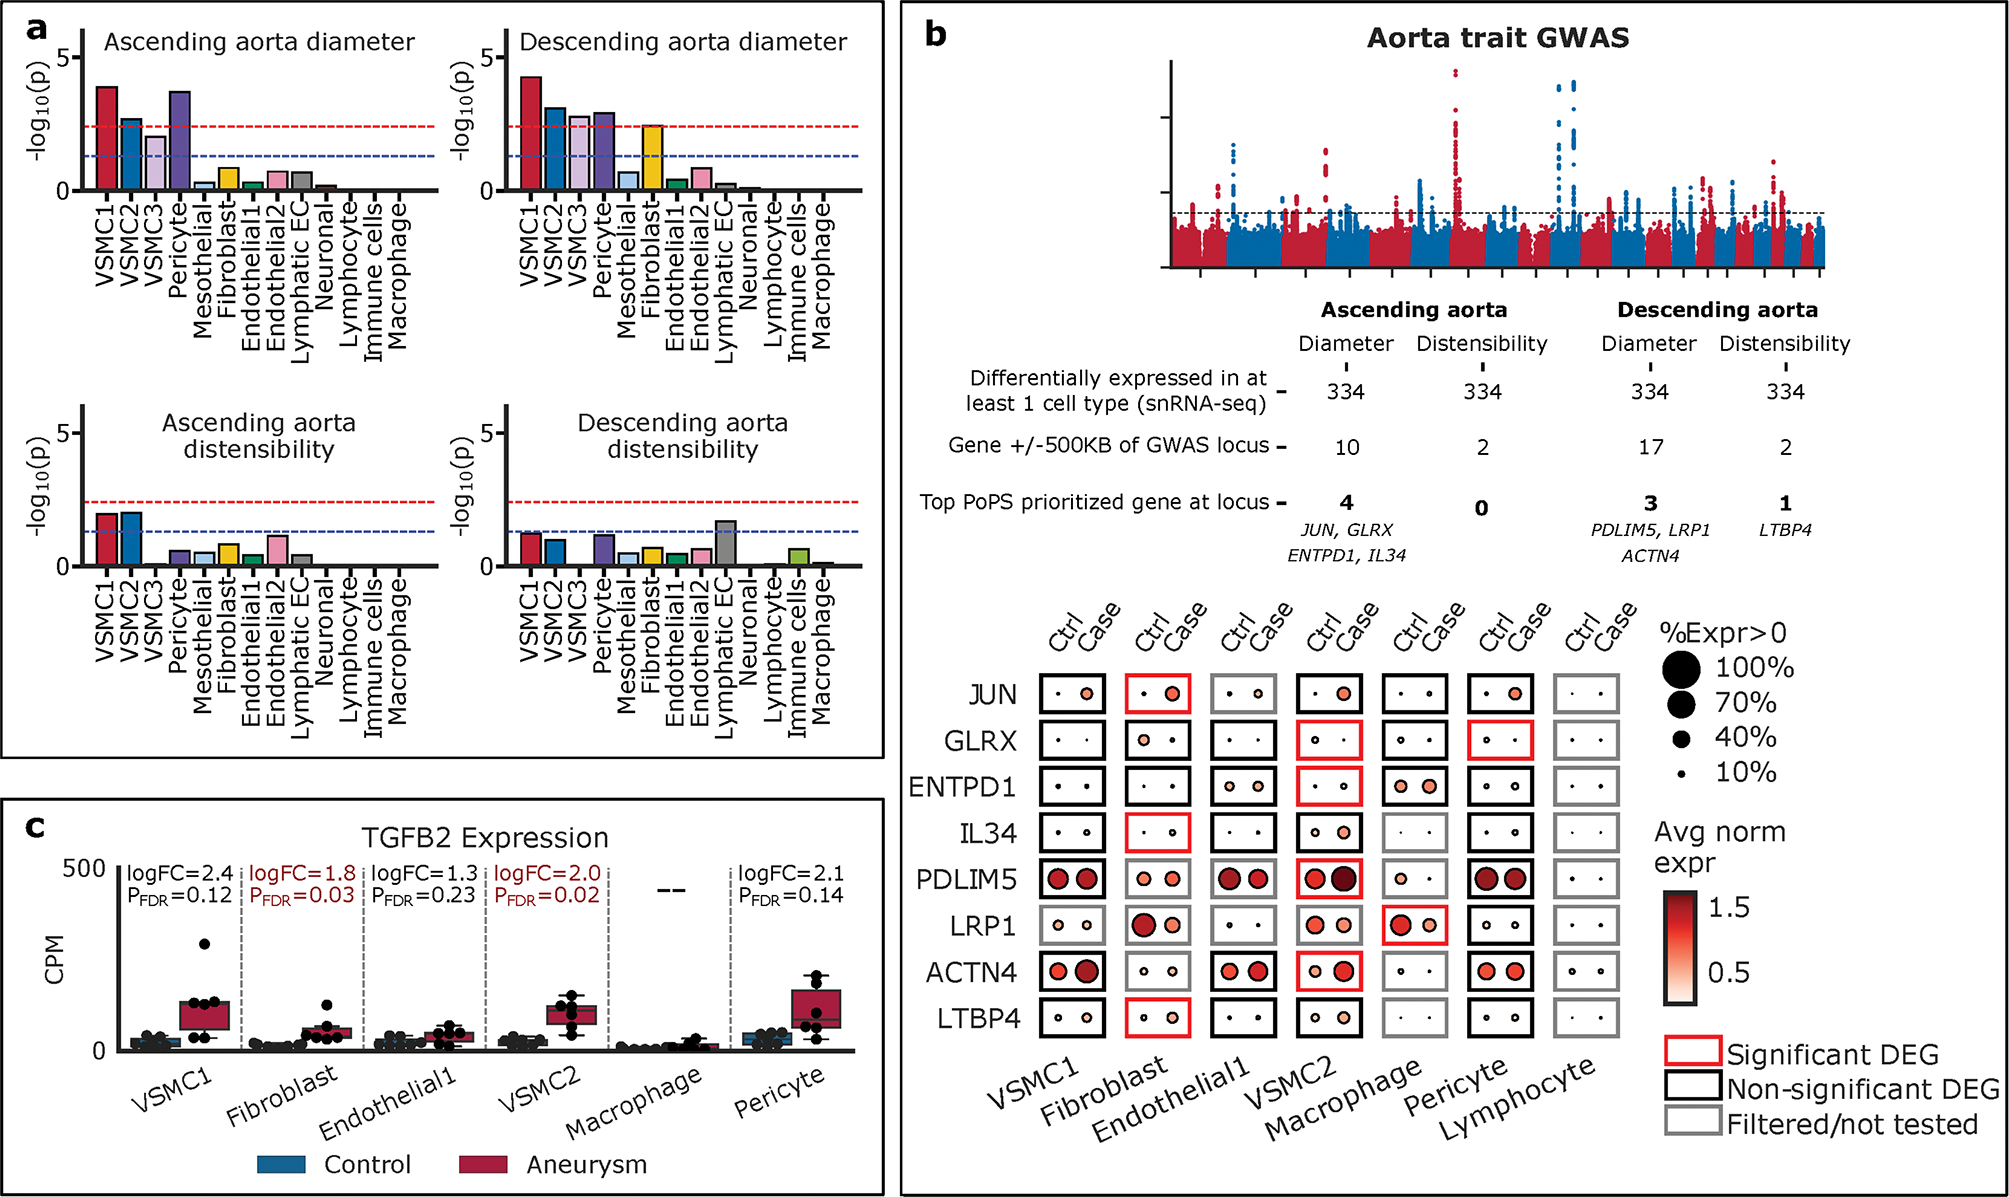
Results: We sequenced 71 689 nuclei from human thoracic aortas and identified 14 clusters, aligning with 11 cell types, predominantly vascular smooth muscle cells (VSMCs) consistent with aortic histology. With unbiased methodology, we found 7 vascular smooth muscle cell and 6 fibroblast subclusters. Differentially expressed genes analysis revealed a vascular smooth muscle cell group accounting for the majority of differential gene expression. Fibroblast populations in aneurysm exhibit distinct behavior with almost complete disappearance of quiescent fibroblasts. Differentially expressed genes were used to prioritize genes at aortic diameter and distensibility genome-wide association study loci highlighting the genes JUN, LTBP4 (latent transforming growth factor beta-binding protein 1), and IL34 (interleukin 34) in fibroblasts, ENTPD1, PDLIM5 (PDZ and LIM domain 5), ACTN4 (alpha-actinin-4), and GLRX in vascular smooth muscle cells, as well as LRP1 in macrophage populations.

Conclusions: Using nuclear RNA sequencing, we describe the cellular diversity of healthy and aneurysmal human ascending aorta. Sporadic aortic aneurysm is characterized by differential gene expression within known cellular classes rather than by the appearance of novel cellular forms. Single-nuclear RNA sequencing of aortic tissue can be used to prioritize genes at aortic trait loci.

Keywords: aortic aneurysms; extracellular matrix; fibroblast; genome-wide association study; thoracic; transcriptomes.


Figures

Figure 1.
Figure 1.. Study overview
a. Aortic aneurysm tissue is characterized by smooth muscle cell disorganization (H&E), deposition of collagen (Trichrome), and elastin fiber breaks with deposition of glycosoaminoglycans (Movat’s pentachrome). b. Aortic samples from patients with and without ascending aortic aneurysm were subjected to mechanical disruption and collection of cellular nuclei.
Figure 2.
Figure 2.. Aortic cell type assignment
Observed cell types in the ascending aorta. a. Uniform manifold approximation and projection plot displaying cellular diversity across 71,689 nuclei from the ascending aorta of aneurysm and control patients. Each dot represents an individual nucleus. Colors correspond to the cell cluster labels. b. Combined uniform manifold approximation and projection plot contrasting 6 individuals with aneurysm and 7 control aortic samples. Aneurysm nuclei represented in magenta, control aortic nuclei are colored in blue. c. Distribution of cell clusters across individuals, stratified by disease status (aneurysm=6, control=7). Statistically credible shifts in proportions as tested using scCODA (see Methods) are denoted with a *. Center line, median; box limits, upper and lower quartiles; whiskers, 1.5x interquartile range.
Figure 3.
Figure 3.. Definitions of observed cell clusters
a. Top 6 marker genes for each cluster listed in the left panel. Size of the dot represents the percentage of cells within the cluster where the marker gene is detected. Gradation corresponds to the mean log2 of the counts normalized by total counts per cell ×10 000. b. The top 3 gene ontologies for each cell cluster as determined by gene ontology enrichment analysis by GOStats of marker genes (see Methods). The red dotted line indicates a Bonferroni statistical significance threshold. c. Expression of marker genes typically used to characterize VSMCs amongst the three subgroups of VSMCs identified through unbiased cell clustering. %Expr > 0, Percent of nuclei in a given sub-cluster that express the gene at non-zero levels; Avg norm expr, Average log-normalized expression.
Figure 4.
Figure 4.. Differentially Expressed Genes
a. Principal components demonstrate clustering differences dependent on aneurysm status and genetic sex. b. Volcano plot highlighting the top differentially expressed genes in aneurysm compared to normal aorta, based on cellular groups, as tested using limma-voom. The X-axis represents the log fold-change (logFC) and the Y-axis represents the −log10 (P value). Genes colored red are significantly differentially expressed whereas genes colored grey are not significant (see Methods). c. The top gene ontologies for significantly differentially expressed genes between aneurysm and control in each cell type based on gene ontology enrichment analysis by GOStats (see Methods). The red dotted line indicates a Bonferroni statistical significance threshold. d. Venn diagram depicting the overlap of significantly differentially expressed genes by cell cluster.
Figure 5.
Figure 5.. VSMC Cell Subclustering
a. Subclustering technologic approach; Nuclei clustered as VSMC1, VSMC2, VSMC3 were selected to identify clusters enriched for marker genes of other global cell types. Subcluster methodology includes re-estimation of the top 2000 most highly variable genes and recalculation of the top principal components using log-normalized and scaled expression. Harmonizing the principal components, UMAP construction and Leiden clustering at increasing resolutions until subclusters with no marker genes (AUC > 0.6) compared to all other clusters emerge. Transcriptional similar subclusters are merged to get final sub-clustering results. b. Overlap of aneurysm and control nuclei on VSMC sub-clustering and the relative proportion of each subcluster between control and aneurysmal aortic tissue. Statistically credible shifts in proportions as tested using scCODA (see Methods) are denoted with a *. Center line, median; box limits, upper and lower quartiles; whiskers, 1.5x interquartile range. c. The relative proportion of each subcluster type by sample. d. Selected marker genes that define each subcluster. e. Classic VSMC markers grouped by VSMC phenotype and the expression of each marker in each VSMC subcluster. f. Enrichment analysis of the VSMC subclusters identified significant pathways of interest based on marker genes of the subclusters. The red dotted line represents a Benjamini-Hochberg FDR corrected threshold of 0.05. Avg Expr, Average log-normalized expression scaled to the maximum expression in any sub-cluster; Pct Nuclei Expr > 0, Percent of nuclei in a given sub-cluster that express the gene at non-zero levels.
Figure 6.
Figure 6.. Fibroblast Subclustering
a. Nuclei clustered as fibroblast were selected to identify clusters enriched for marker genes of other global cell types. Results of subcluster analysis showing six fibroblast sub-clusters. b. The relative proportion of each subcluster between control and aneurysmal aortic tissue, and the relative proportion of each subcluster by sample. Statistically credible shifts in proportions as tested using scCODA (see Methods) are denoted with a *. Center line, median; box limits, upper and lower quartiles; whiskers, 1.5x interquartile range. c. Selected marker genes that define each subcluster. d. Gene ontology pathway enrichment based on marker genes for each fibroblast sub-cluster. The red line indicates FDR < 0.05. Avg Expr, Average log-normalized expression scaled to the maximum expression in any sub-cluster; Pct Nuclei Expr > 0, Percent of nuclei in a given sub-cluster that express the gene at non-zero levels. e. RNA labeling of aortic tissue using RNAscope in situ hybridization. Control and aneurysm aortic tissue section labeled with DCN (red, global fibroblast marker), PLIN2 (blue, FB-S1 marker) and ADAMTS4 (blue, FB-S3 marker). Identified FB-S1 and FB-S3 populations appear blue and are indicated by arrows. Images show lack of FB-S1 in the aneurysm tissue, presence of FB-S3 in the aneurysm tissue, both in the adventitial layer. 40x single images = 200 um20x tiled images = 1000 um
Figure 7.
Figure 7.. Transcriptomic Intersection with Aortic Genetic Traits
a. Cell-type specific LD-score regression. The blue line represents nominal significance (P<0.05) and the red line represents Bonferroni significance (P<0.05/13=0.0038). VSMC1, VSMC2, and pericyte groups were enriched at Bonferroni significance for ascending and descending aortic diameter. b. 334 differentially expressed genes were intersected with GWAS of ascending and descending aortic diameter and distensibility and eight genes were prioritized. The identified genes were displayed by their expression in each cell-type and by control compared to aneurysm tissue. c. Examination of TGFB2 showed differential expression in VSMC1, VSMC2, and fibroblast cellular groups. PFDR, Benjamini-Hochberg adjusted P-value.

Comment in

Similar articles

Cited by

References

    1. Bossone E, Eagle KA. Epidemiology and management of aortic disease: aortic aneurysms and acute aortic syndromes. Nat Rev Cardiol. 2021;18(5):331–348. doi: 10.1038/s41569-020-00472-6 - DOI - PubMed
    1. Vilacosta I, San Román JA, di Bartolomeo R, Eagle K, Estrera AL, Ferrera C, Kaji S, Nienaber CA, Riambau V, Schäfers HJ, Serrano FJ, Song JK, Maroto L. Acute Aortic Syndrome Revisited: JACC State-of-the-Art Review. J Am Coll Cardiol. 2021;78(21):2106–2125. doi: 10.1016/j.jacc.2021.09.022 - DOI - PubMed
    1. Erbel R, Aboyans V, Boileau C, Bossone E, Bartolomeo RD, Eggebrecht H, Evangelista A, Falk V, Frank H, Gaemperli O, Grabenwöger M, Haverich A, Iung B, Manolis AJ, Meijboom F, Nienaber CA, Roffi M, Rousseau H, Sechtem U, Sirnes PA, Allmen RS von, Vrints CJM, ESC Committee for Practice Guidelines. 2014 ESC Guidelines on the diagnosis and treatment of aortic diseases: Document covering acute and chronic aortic diseases of the thoracic and abdominal aorta of the adult. The Task Force for the Diagnosis and Treatment of Aortic Diseases of the European Society of Cardiology (ESC). Eur Heart J. 2014;35(41):2873–2926. doi: 10.1093/eurheartj/ehu281 - DOI - PubMed
    1. Kim JB, Spotnitz M, Lindsay ME, MacGillivray TE, Isselbacher EM, Sundt TM. Risk of Aortic Dissection in the Moderately Dilated Ascending Aorta. J Am Coll Cardiol. 2016;68(11):1209–1219. doi: 10.1016/j.jacc.2016.06.025 - DOI - PubMed
    1. Jana S, Hu M, Shen M, Kassiri Z. Extracellular matrix, regional heterogeneity of the aorta, and aortic aneurysm. Exp Mol Med. 2019;51(12):160. doi: 10.1038/s12276-019-0286-3 - DOI - PMC - PubMed

Publication types

MeSH terms