. 2022 Nov;15(11):2597-2612.
doi: 10.1111/cts.13372. Epub 2022 Sep 29.

Liquid biopsy-based targeted gene screening highlights tumor cell subtypes in patients with advanced prostate cancer

Affiliations

Liquid biopsy-based targeted gene screening highlights tumor cell subtypes in patients with advanced prostate cancer

Seta Derderian et al. Clin Transl Sci. 2022 Nov.

Abstract

Prostate cancer (PCa) clinical heterogeneity underscores tumor heterogeneity, which may be best defined by cell subtypes. To test if cell subtypes contributing to progression can be assessed noninvasively, we investigated whether 14 genes representing luminal, neuroendocrine, and stem cells are detectable in whole blood RNA of patients with advanced PCa. For each gene, reverse transcription quantitative polymerase chain reaction assays were first validated using RNA from PCa cell lines, and their traceability in blood was assessed in cell spiking experiments. These were next tested in blood RNA of 40 advanced PCa cases and 40 healthy controls. Expression in controls, which was low or negative, was used to define stringent thresholds for gene overexpression in patients to account for normal variation in white blood cells. Thirty-five of 40 patients overexpressed at least one gene. Patients with more genes overexpressed had a higher risk of death (hazard ratio 1.42, range 1.12-1.77). Progression on androgen receptor inhibitors was associated with overexpression of stem (odds ratio [OR] 7.74, range 1.68-35.61) and neuroendocrine (OR 13.10, range 1.24-142.34) genes, while luminal genes were associated with taxanes (OR 2.7, range 1.07-6.82). Analyses in PCa transcriptomic datasets revealed that this gene panel was most prominent in metastases of advanced disease, with diversity among patients. Collectively, these findings support the contribution of the prostate cell subtypes to disease progression. Cell-subtype specific genes are traceable in blood RNA of patients with advanced PCa and are associated with clinically relevant end points. This opens the door to minimally invasive liquid biopsies for better management of this deadly disease.


Conflict of interest statement

The authors declared no competing interests for this work.

Figures
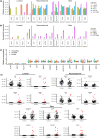
FIGURE 1
FIGURE 1
Genes representing prostatic cell subtypes are differentially expressed in prostate cancer (PCa) cell lines and are traceable in blood. Gene expression assays were optimized in PCa cell lines and tested in control blood spiked with PCa cells before testing in 40 patients and 40 controls. (a) RNA was extracted from five human PCa cell lines (LNCaP, 22Rv1, PC‐3, DU145, and NCI‐H660) and reverse transcribed to test our panel of genes by reverse transcription quantitative polymerase chain reaction. Results were expressed for each gene as mean normalized relative quantities on a logarithmic scale. (b) Blood drawn from a healthy male in PAXgene tubes (2.5 ml) was spiked with LNCaP, 22Rv1, or NCI‐H660 cells. For LNCaP and 22Rv1, 10 cells were added to the blood (equivalent of 4 circulating tumor cells per ml of blood). NCI‐H660 cells grow as clumps in suspension, therefore we estimated that ~50 cells were added to the control blood. Genes were tested in control versus spiked blood. Results are presented on a linear scale. (c) Genes were tested in control blood and compared by age and sex. Relative normalized gene expression is shown in box plots for each gene in male controls by age (<50 vs. >50 years old) and female controls (25–70 years old; no difference by age). Wilcoxon rank‐sum test is significant (p < 0.05) for CD44 between young versus older men (*). No significant differences were detected by sex. Similar analysis of gene expression with age of patients also showed no correlation (data not shown). (d) Box plots of results in controls and patients for luminal, neuroendocrine, and stem cell genes. Red dots for patients represent overexpression, as defined by values greater than means of controls +2.58 SD (Table S3). Black dots in patients represent expression below cutoff values for each gene (dashed line). Some genes (KLK3, ARV7, and FOLH1) are not detected in controls and in subsets of patients. Wilcoxon rank‐sum test p values comparing patients and controls are denoted by * for p < 0.05; ** for p < 0.01; *** for p < 0.001 (under gene names).
FIGURE 2
FIGURE 2
Cell‐subtype genes are not related to WBCs but to clinical features of patients with prostate cancer (PCa). In (a) are bioinformatic analyses of the 14 genes in normal WBC lineages in consensus data from the Human Protein Atlas (v20.proteinatlas.org), as described in the Methods section. Normalized expression from 0 (white) to 70 (red) is shown. (b) Spearman correlation matrix between gene expression in the 40 patients with mCRPC and their WBC counts at the time of blood draw. Blue represents a negative association, red a positive association. The p values are entered when correlations were significant (p < 0.05), and at least >0.4 or <−0.4. (c) Heatmap depicting associations between patients and treatment characteristics and overexpression of individual genes. Blue represents a negative association, and red a positive correlation. The darker the color, the stronger the association between gene overexpression and patients’ characteristics. The p values are entered when the patient’s characteristic was significantly associated with overexpression of that gene (p < 0.05). (d) Association between the detection of the KLK3 transcript in the blood of patients and PSA levels (logarithmic scale) at time of blood draw. The p value was calculated using a Wilcoxon rank‐sum test. AR, androgen receptor; ECOG, Eastern Cooperative Oncology Group; mCRPC, metastatic castration‐resistant; T‐reg, regulatory T cells; WBC, white blood cell.
FIGURE 3
FIGURE 3
Cell‐subtype genes in liquid biopsies support phenotypic diversity. (a) Heatmap of gene expression in 40 patients, with black squares representing no signal, blue squares for baseline expression, and white to red squares for overexpression. For KLK3, FOLH1, and ARV7 which are completely negative in control samples, results are presented as log2 fold change from the average expression in positive patients. For the remaining genes, results are presented as log2 fold change from the overexpression thresholds calculated from 40 controls, except for CD44, whose threshold was established from older male controls. (b) Spearman correlation matrix between the 14 genes in patients with metastatic castration‐resistant (mCRPC). Blue and red represent negative and positive associations, respectively. The p values are entered when the correlation was significant (p < 0.05). (c) Pie chart representing phenotypic diversity by cell subtypes (L: luminal, NE: neuroendocrine, and SC: stem cell) and combinations thereof, as indicated on the right.
FIGURE 4
FIGURE 4
Prostate cell‐subtype specific genes are overexpressed in PCa tissues of patients at different stages of disease. Stacked bar graphs representing the number of genes overexpressed (color‐coded) overall or by cell subtype in different categories of patients from the (a) TCGA, (b) Stanford, (c) Cambridge, (d) MSKCC, and (e) SU2C datasets. Overexpression was defined as +2.58 SDs over the mean expression in benign samples from the same cohort, as indicated in the Methods section. For the SU2C dataset, gene expression was compared to benign samples from the TCGA dataset. (a–e) Denoted above each graph are the Fisher’s exact test results comparing the number of genes overexpressed by categories of cases (0 vs. ≥1 gene overexpressed for individual subtypes, or 0–1 versus ≥2 genes overexpressed overall, up to 6 genes). (a–d) Significant differences are shown between benign versus RP (denoted by *), benign versus advanced cases from the same cohort (LN, TURP, metastases; denoted by +), or RP versus advanced cases (#), as well as the Cochrane‐Armitage test for trends comparing RP cases by Gleason score (×). (e) In the SU2C dataset, Fisher’s exact test results denote difference between LNs versus bones (*), LNs versus liver (×), and bones versus liver metastases (+). (a–e) The level of significance is denoted as: * +/ # / × for p < 0.05; ** for p < 0.01; *** for p < 0.001. Bn, benign; L, luminal; LN, lymph node; Met, metastasis; MSKCC, Memorial Sloan Kettering Cancer Center; NE, neuroendocrine; PCa, prostate cancer; RP, radical prostatectomy; SC, stem cell; TCGA, The Cancer Genome Atlas; TURP, primary tumors removed by transurethral resection from hormone‐treated patients.
FIGURE 5
FIGURE 5
Cell subtype patterns in PCa tissues and metastases evolve with disease progression. Stacked bar graphs of cell‐subtypes (L: luminal, NE: neuroendocrine, SC: stem cell) and combinations thereof (color‐coded on the right) for different categories of patients in the TCGA, Stanford, Cambridge, MSKCC, and SU2C datasets. The number of cell subtypes represented in different categories of patients are compared by Fisher’s exact test. Significance levels are represented by * for p < 0.05; ** for p < 0.01; *** for p < 0.001 for benign versus primary (TCGA), primary versus advanced (LN/TURP/Metastases in Stanford/Cambridge/MSKCC), and between metastatic sites (SU2C). The results in blood RNA from our pilot study were added on the right for comparison purposes, mostly resembling metastases and differing from primary and benign prostate tissues. LN, lymph node; MSKCC, Memorial Sloan Kettering Cancer Center; PCa, prostate cancer; RP, radical prostatectomy; TCGA, The Cancer Genome Atlas; TURP, primary tumors removed by transurethral resection from hormone‐treated patients.

References

    1. Sung H, Ferlay J, Siegel RL, et al. Global cancer statistics 2020: GLOBOCAN estimates of incidence and mortality worldwide for 36 cancers in 185 countries. CA Cancer J Clin. 2021;71(3):209‐249. doi:10.3322/caac.21660 - DOI - PubMed
    1. Crona DJ, Whang YE. Androgen receptor‐dependent and ‐independent mechanisms involved in prostate cancer therapy resistance. Cancer. 2017;9(6):67. doi:10.3390/cancers9060067 - DOI - PMC - PubMed
    1. Ojo D, Lin X, Wong N, Gu Y, Tang D. Prostate cancer stem‐like cells contribute to the development of castration‐resistant prostate cancer. Cancer. 2015;7(4):2290‐2308. doi:10.3390/cancers7040890 - DOI - PMC - PubMed
    1. Li Q, Zhang CS, Zhang Y. Molecular aspects of prostate cancer with neuroendocrine differentiation. Chin J Cancer Res. 2016;28(1):122‐129. doi:10.3978/j.issn.1000-9604.2016.01.02 - DOI - PMC - PubMed
    1. Patel GK, Chugh N, Tripathi M. Neuroendocrine differentiation of prostate cancer‐an intriguing example of tumor evolution at play. Cancer. 2019;11(10):1405. doi:10.3390/cancers11101405 - DOI - PMC - PubMed

Publication types

Grants and funding