. 2022 Oct 4;11(19):e026581.
doi: 10.1161/JAHA.122.026581. Epub 2022 Sep 29.

Cell-Specific Actions of the Prostaglandin E-Prostanoid Receptor 4 Attenuating Hypertension: A Dominant Role for Kidney Epithelial Cells Compared With Macrophages

Affiliations

Cell-Specific Actions of the Prostaglandin E-Prostanoid Receptor 4 Attenuating Hypertension: A Dominant Role for Kidney Epithelial Cells Compared With Macrophages

Ting Yang et al. J Am Heart Assoc. .

Abstract

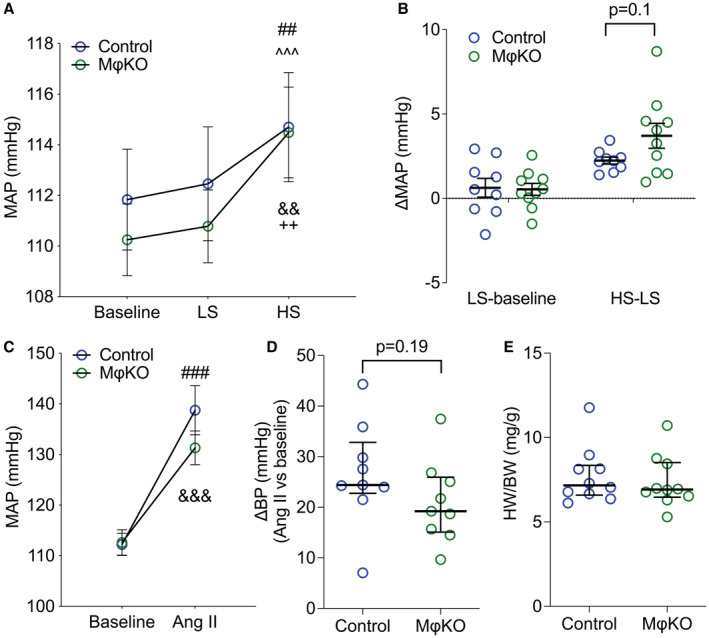
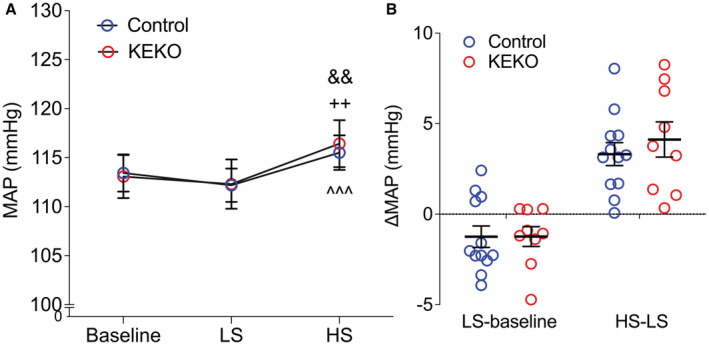
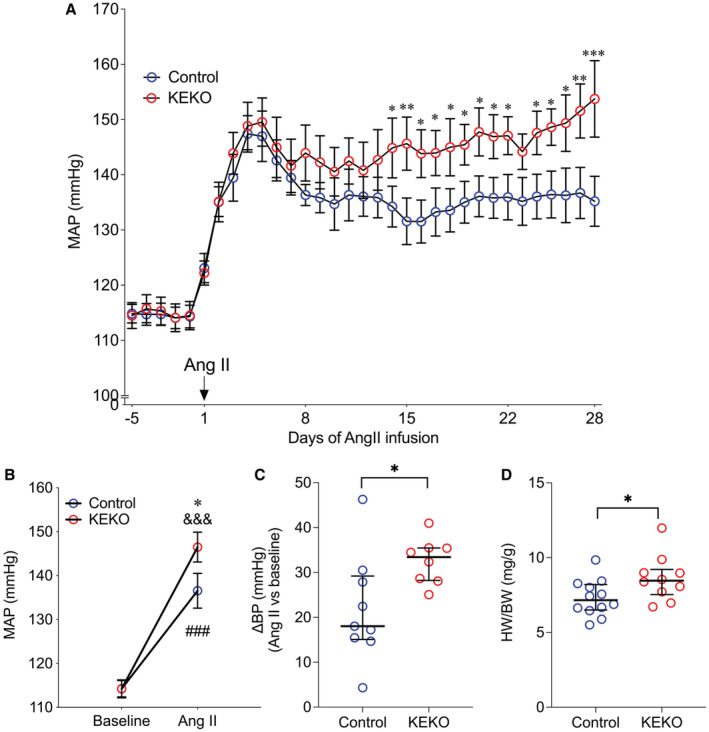
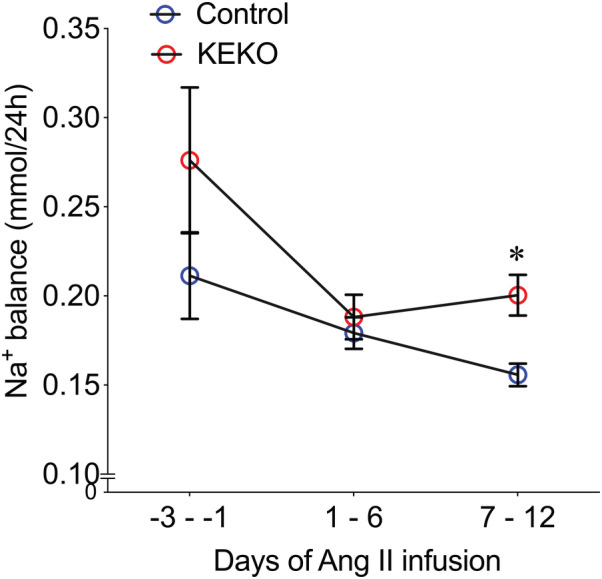
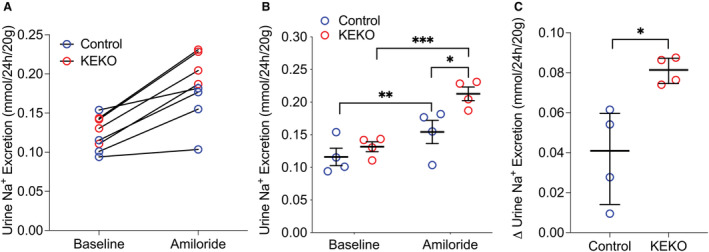
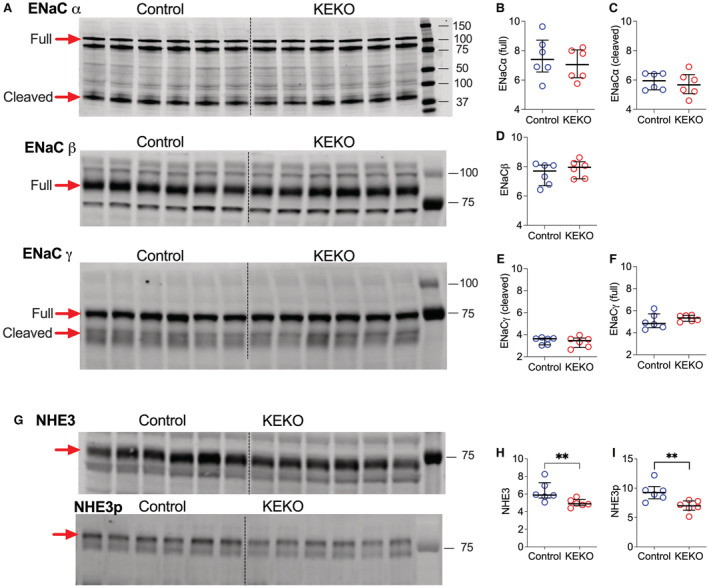
Background A beneficial role for prostanoids in hypertension is suggested by clinical studies showing nonsteroidal anti-inflammatory drugs, which block the production of all prostanoids, cause sodium retention and exacerbate hypertension. Among prostanoids, prostaglandin E2 and its E-prostanoid receptor 4 receptor (EP4R) have been implicated in blood pressure control. Our previous study found that conditional deletion of EP4R from all tissues in adult mice exacerbates angiotensin II-dependent hypertension, suggesting a powerful effect of EP4R to resist blood pressure elevation. We also found that elimination of EP4R from vascular smooth muscle cells did not affect the severity of hypertension, suggesting nonvascular targets of prostaglandin E mediate this antihypertensive effect. Methods and Results Here we generated mice with cell-specific deletion of EP4R from macrophage-specific EP4 receptor knockouts or kidney epithelial cells (KEKO) to assess the contributions of EP4R in these cells to hypertension pathogenesis. Macrophage-specific EP4 receptor knockouts showed similar blood pressure responses to alterations in dietary sodium or chronic angiotensin II infusion as Controls. By contrast, angiotensin II-dependent hypertension was significantly augmented in KEKOs (mean arterial pressure: 146±3 mm Hg) compared with Controls (137±4 mm Hg; P=0.02), which was accompanied by impaired natriuresis in KEKOs. Because EP4R expression in the kidney is enriched in the collecting duct, we compared responses to amiloride in angiotensin II-infused KEKOs and Controls. Blockade of the epithelial sodium channel with amiloride caused exaggerated natriuresis in KEKOs compared with Controls (0.21±0.01 versus 0.15±0.02 mmol/24 hour per 20 g; P=0.015). Conclusions Our data suggest EP4R in kidney epithelia attenuates hypertension. This antihypertension effect of EP4R may be mediated by reducing the activity of the epithelial sodium channel, thereby promoting natriuresis.

Keywords: EP4 receptor; hypertension; kidney epithelial cells; prostaglandin E2.


Figures

Figure 1
Figure 1. Mice lack EP4R in macrophages maintained normal salt sensitivity and BP response to Ang II.
(A) The MϕKOs have similar MAP measured by telemetry at baseline and during low‐ or high‐salt feeding (1 week respectively) compared with Controls. (B) The BP changes from normal to low‐salt feeding and low‐ to high‐salt feeding periods were also similar between genotypes. (C) The mice received Ang II infusion for 3 weeks, and the averaged MAP during the week 2 to 3 of the Ang II infusion period was similar between Control and MϕKO mice. (D) The Ang II‐induced MAP increase tends to be higher in MϕKOs than in Control mice; however, the difference was not statistically significant. (E) The heart weight/body weight ratio was at the same level in Controls and MϕKOs following Ang II infusion. Data in (A through C) are expressed as mean±SEM and analyzed by 2‐way ANOVA (factors: genotype and treatment) with Sidak multiple comparisons tests; data in (D and E) are expressed as median and interquartile range and analyzed by Mann–Whitney test; n=9 to 10/group; ## P<0.01, ### P<0.001 vs Control baseline; ^^^ P<0.001 vs Control LS; && P<0.01, &&& P<0.001 vs KEKO baseline; ++ P<0.01 vs KEKO LS; effect size: trivial for (A), large for (C). Ang II indicates angiotensin II; BP, blood pressure; HS, high salt; HW/BW, heart weight/body weight ratio; KEKO, kidney epithelial cell‐specific EP4 receptor knockout; LS, low salt; MAP, mean arterial pressure; and MϕKO, macrophage‐specific EP4 receptor knockout.
Figure 2
Figure 2. Mice lacking EP4R in kidney tubular epithelial cells maintain normal baseline BP and salt sensitivity.
The KEKOs have similar MAP measured by telemetry at baseline and during low‐ or high‐salt feeding (1 week respectively) compared with Controls (A). The BP changes from normal to low‐salt feeding and low‐ to high‐salt feeding periods were also similar between genotypes (B). Data are expressed as mean±SEM and analyzed by 2‐way ANOVA (factors: genotype and treatment) with Sidak multiple comparisons tests; n=9‐12/group; ^^^ P<0.001 vs Control LS (effect size: trivial); && P<0.01 vs KEKO baseline (effect size: trivial); ++ P<0.01 vs KEKO LS (effect size: trivial); BP indicates blood pressure; EP4R, E‐prostanoid receptor 4; HS, high salt; KEKO, kidney epithelial cell‐specific EP4 receptor knockout; LS, low salt; MAP, mean arterial pressure; and NS, normal salt.
Figure 3
Figure 3. Eliminating EP4R from kidney tubular epithelial cells leads to exaggerated BP response to Ang II.
(A) KEKO mice have significantly higher MAP after day 14 of Ang II infusion than Controls. (B) The averaged MAP of week 3 to 4 of Ang II infusion was significantly higher in KEKO mice than Controls. (C) The Ang II‐induced MAP increase was exacerbated significantly in KEKO mice. (D) The heart weight/body weight ratio was significantly higher in KEKO mice than Controls following Ang II infusion. Data in (A and B) are expressed as mean±SEM and analyzed by 2‐way ANOVA (factors: genotype and days for A; genotype and treatment for B) with Sidak multiple comparisons tests; data in (C and D) are expressed as median and interquartile range and analyzed by Mann–Whitney test; *P<0.05, **P<0.01, ***P<0.001 vs Control at the same time point or the same treatment (effect size: medium—large for (A), large for (Bfollowing Ang II infusion through D); ### P<0.001 vs Control baseline (effect size: large); &&& P<0.001 vs KEKO baseline (effect size: large); n=9 to 12/group in (A and B); n=8 to 10/group in (C and D); Ang II indicates angiotensin II; BP, blood pressure; EP4R, E‐prostanoid receptor 4; HW/BW, heart weight/body weight ratio; KEKO, kidney epithelial cell‐specific EP4 receptor knockout; and MAP, mean arterial pressure.
Figure 4
Figure 4. Kidney epithelial cells‐specific EP4R contributes to the regulation of sodium balance during Ang II infusion.
The sodium balance was calculated in Control and KEKO mice before and during the first 12 days of Ang II infusion. From day 7 to 12 of Ang II infusion, sodium balance was significantly higher in KEKOs. Data are expressed as mean±SEM and analyzed by 2‐way ANOVA (factors: genotype and days) with Sidak multiple comparisons tests; *P<0.05 vs Control at the same time point (effect size: large); n=7 to 8/group. Ang II indicates angiotensin II; EP4R, E‐prostanoid receptor 4; and KEKO, kidney epithelial cell‐specific EP4 receptor knockout.
Figure 5
Figure 5. Kidney epithelial cells‐specific EP4 deletion leads to augmented natriuretic response to amiloride during Ang II‐HTN.
Mice received Ang II infusion at 1000 ng/kg per min. On day 11 of Ang II infusion, 24 hours of urine was collected, and on day 12 of Ang II infusion, mice were given amiloride 4 mg/kg (intraperitoneal.) and 24 hours of urine was collected immediately after the amiloride injection. Following amiloride treatment, the urine sodium excretion significantly increased in both Control and KEKO mice (A and B). However, the total urine sodium excretion (A and B) and the change in urine sodium excretion compared with baseline (C) were significantly higher in KEKOs. Data are expressed as raw value (A), mean±SEM (B), or median with interquartile range (C); (B) is analyzed by 2‐way ANOVA (factors: genotype and treatment) with Sidak multiple comparisons tests; (C) is analyzed by Mann–Whitney test; *P<0.05, **P<0.01; ***P<0.001; effect size: medium for (B) Control baseline vs KEKO baseline, large for all other significant comparisons; n=4/group. Ang II‐HTN indicates angiotensin II‐dependent hypertension; BP, blood pressure; EP4, E‐prostanoid receptor 4; and KEKO, kidney epithelial cell‐specific EP4 receptor knockout.
Figure 6
Figure 6. The protein abundance of ENaC and NHE3 during Ang II‐HTN.
The proteins were extracted after 14 days of Ang II infusion. (A) Gel images of Western blotting for ENaC subtypes. (B through F) Quantification of the western blotting for ENaC subtypes. The full length or cleaved ENaCα, ENaCβ, or ENaCγ proteins in the kidney were similar in Control and KEKO mice. (G) Gel images of western blotting for NHE3 and phosphorylated NHE3 (NHE3pS552). Both NHE3 (H) and NHE3pS552 (I) protein levels were significantly reduced in KEKOs. Data are expressed as median with interquartile range and analyzed by Mann–Whitney test; **P<0.05 (effect size: large); n=6/group; ENaC indicates epithelial sodium channel; KEKO, kidney epithelial cell‐specific EP4 receptor knockout; and NHE3, sodium‐hydrogen antiporter 3.

Similar articles

Cited by

References

    1. Chobanian A. The hypertension paradox: more uncontrolled disease despite improving therapy. New Engl J Med. 2009;361:991–994. doi: 10.1056/NEJMsa0903829 - DOI - PubMed
    1. Lawes C, Vander Hoorn S, Rodgers A, Hypertension ISo . Global burden of blood pressure related disease. Lancet. 2008;371:1513–1518. doi: 10.1016/S0140-6736(08)60655-8 - DOI - PubMed
    1. Burnier M, Egan BM. Adherence in hypertension. Circ Res. 2019;124:1124–1140. doi: 10.1161/CIRCRESAHA.118.313220 - DOI - PubMed
    1. Sparks MA, Crowley SD, Gurley SB, Mirotsou M, Coffman TM. Classical renin‐angiotensin system in kidney physiology. Compr Physiol. 2014;4:1201–1228. doi: 10.1002/cphy.c130040 - DOI - PMC - PubMed
    1. Smyth EM, Grosser T, Wang M, Yu Y, FitzGerald GA. Prostanoids in health and disease. J Lipid Res. 2009;50(Suppl):S423–S428. doi: 10.1194/jlr.R800094-JLR200 - DOI - PMC - PubMed

Publication types

MeSH terms

LinkOut - more resources