

Randomised controlled trial: effects of gluten-free diet on symptoms and the gut microenvironment in irritable bowel syndrome
- PMID: 36173041
- PMCID: PMC9828804
- DOI: 10.1111/apt.17239
Randomised controlled trial: effects of gluten-free diet on symptoms and the gut microenvironment in irritable bowel syndrome
Abstract
Background: A gluten-free diet reduces symptoms in some patients with irritable bowel syndrome (IBS) through unclear mechanisms.
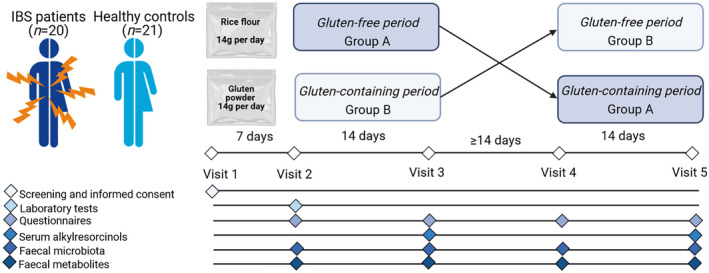
Aims: To assess the effects of gluten-free versus gluten-containing diet on symptoms and the gut microenvironment, and to identify predictors of response to the gluten-free diet in IBS METHODS: Twenty patients with IBS and 18 healthy controls (HC) followed a gluten-free diet during two 14-day intervention periods where they sprinkled either gluten (14 g/day) or rice flour powder over their meals. Primary outcomes included effects of the interventions on IBS symptoms (IBS-SSS) and bowel habits. Secondary outcomes included effects of gluten-free diet on faecal microbiota and metabolite profile.
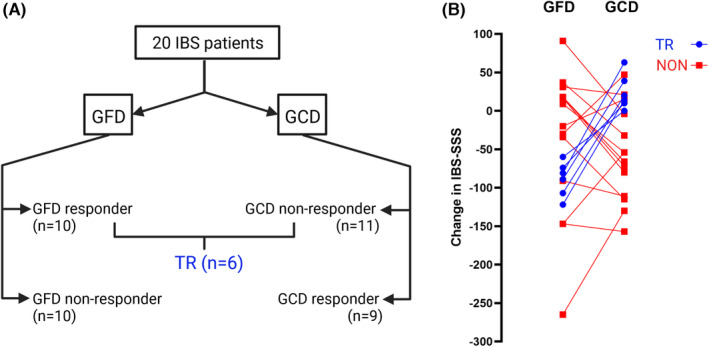
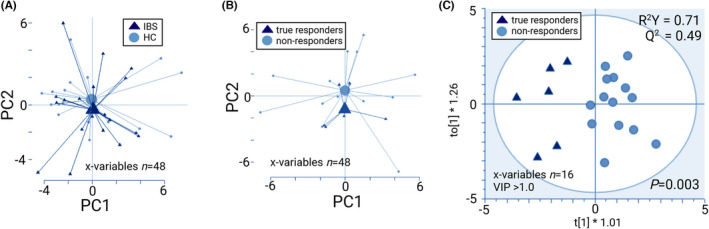
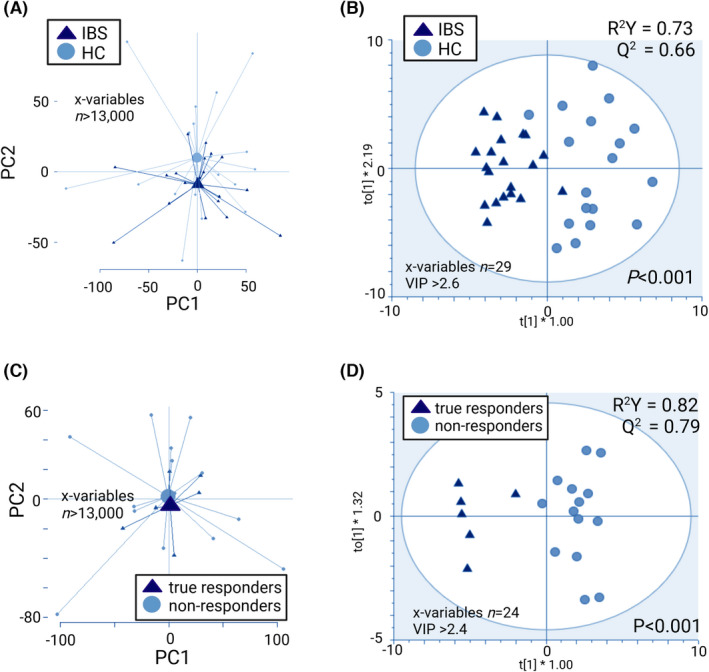
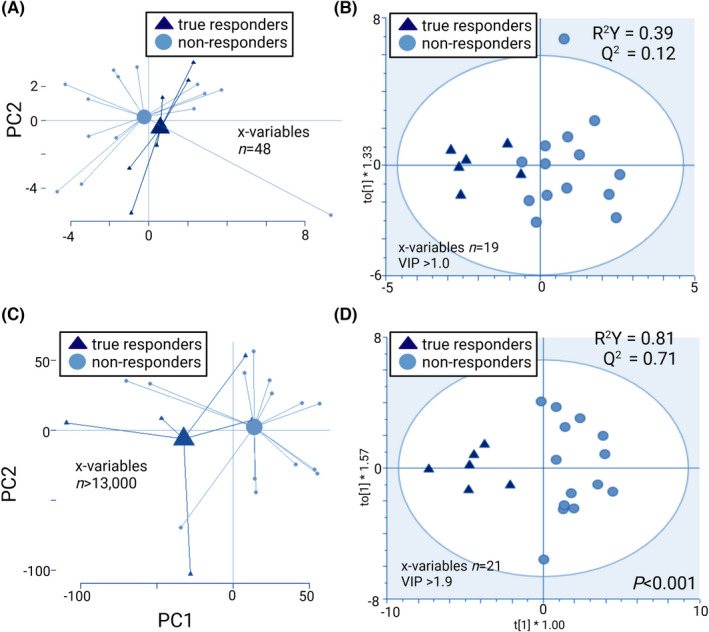
Results: IBS symptoms improved during the gluten-free (p = 0.02), but not the gluten-containing period, with no difference between the interventions. IBS patients reported fewer loose stools during the gluten-free intervention (p = 0.01). Patients with IBS and HC presented distinct metabolite profiles based on the effects of the gluten-free diet (p < 0.001). True responders (reduced IBS-SSS by ≥50 solely after gluten-free period) and non-responders were discriminated based on the effects of the gluten-free diet on the microbiota (p < 0.01) and metabolite profiles (p < 0.001). The response to the gluten-free diet could be predicted by the metabolite profile before the intervention (p < 0.001).
Conclusions: A gluten-free diet may influence symptoms in a subset of patients with IBS, with a particular effect on bowel habits. A gluten-free diet seems to impact the gut microenvironment. Responsiveness to the gluten-free diet may be predicted by the metabolite profile.
Clinicaltrials: gov: NCT03869359.
© 2022 The Authors. Alimentary Pharmacology & Therapeutics published by John Wiley & Sons Ltd.
Figures
Comment in
-
Editorial: gluten-free but not pain-free in IBS-authors' reply.Aliment Pharmacol Ther. 2022 Dec;56(11-12):1623-1624. doi: 10.1111/apt.17279. Aliment Pharmacol Ther. 2022. PMID: 36352744 No abstract available.
-
Editorial: gluten-free but not pain-free in IBS.Aliment Pharmacol Ther. 2022 Dec;56(11-12):1621-1622. doi: 10.1111/apt.17253. Aliment Pharmacol Ther. 2022. PMID: 36352748 No abstract available.
References
-
- Böhn L, Störsrud S, Törnblom H, Bengtsson U, Simrén M. Self‐reported food‐related gastrointestinal symptoms in IBS are common and associated with more severe symptoms and reduced quality of life. Am J Gastroenterol. 2013;108:634–41. - PubMed
-
- Öhman L, Törnblom H, Simrén M. Crosstalk at the mucosal border: importance of the gut microenvironment in IBS. Nat Rev Gastroenterol Hepatol. 2015;12:36–49. - PubMed
-
- Barbara G, Feinle‐Bisset C, Ghoshal UC, Santos J, Vanner S, Vergnolle N, et al. The intestinal microenvironment and functional gastrointestinal disorders. Gastroenterology. 2016;150:1305–1318.e8. - PubMed
Publication types
MeSH terms
Substances
Associated data
LinkOut - more resources
Full Text Sources
Medical