

Trends in characteristics, management, and outcomes of patients presenting with gastrointestinal bleeding to emergency departments in the United States from 2006 to 2019
- PMID: 36173090
- PMCID: PMC9669230
- DOI: 10.1111/apt.17238
Trends in characteristics, management, and outcomes of patients presenting with gastrointestinal bleeding to emergency departments in the United States from 2006 to 2019
Abstract
Background: Recent epidemiologic studies of trends in gastrointestinal bleeding (GIB) provided results through 2014 or earlier and assessed only hospitalised patients, excluding patients presenting to emergency departments (EDs) who are not hospitalised.
Aims: To provide the first U.S. nationwide epidemiological evaluation of all patients presenting to EDs with GIB METHODS: We used the Nationwide Emergency Department Sample for 2006-2019 to calculate yearly projected incidence of patients presenting to EDs with primary diagnoses of GIB, categorised by location and aetiology. Outcomes were assessed with multivariable analyses.
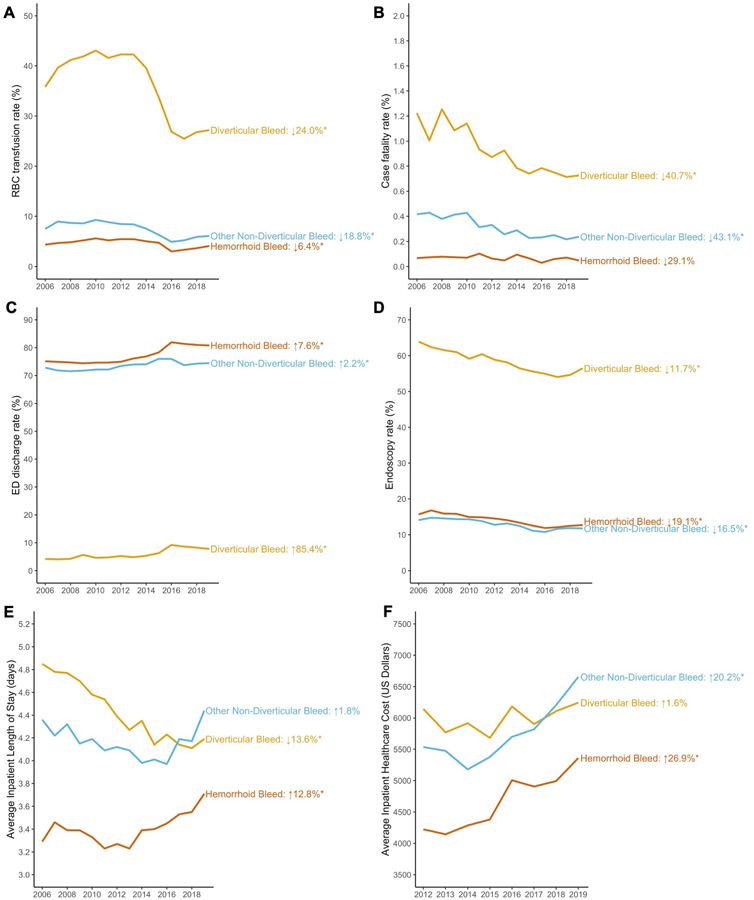
Results: The age/sex-adjusted incidence for GIB increased from 378.4 to 397.5/100,000 population from 2006 to 2019. Upper gastrointestinal bleeding (UGIB) incidence decreased from 2006 to 2014 (112.3-94.4/100,000) before increasing to 116.2/100,000 by 2019. Lower gastrointestinal bleeding (LGIB) incidence increased from 2006 to 2015 (146.0 to 161.0/100,000) before declining to 150.2/100,000 by 2019. The proportion of cases with one or more comorbidities increased from 27.4% to 35.9% from 2006 to 2019. Multivariable analyses comparing 2019 to 2006 showed increases in ED discharges (odds ratio [OR] = 1.45; 95% confidence interval [CI] = 1.43-1.48) and decreases in red blood cell (RBC) transfusions (OR = 0.62; 0.61-0.63), endoscopies (OR = 0.60; 0.59-0.61), death (OR = 0.51; 0.48-0.54) and length of stay (relative ratio [RR] = 0.81; 0.80-0.82). Inpatient cost decreased from 2012 to 2019 (RR = 0.92; 0.91-0.93).
Conclusions: The incidence of GIB in the U.S. is increasing. UGIB incidence has been increasing since 2014 while LGIB incidence has been decreasing since 2015. Despite a more comorbid population in 2019, case fatality rate, length of stay and costs have decreased. More patients are discharged from the ED and the rate of RBC transfusions has decreased, possibly reflecting changing clinical practice in response to updated guidelines.
© 2022 John Wiley & Sons Ltd.
Conflict of interest statement
Figures


References
-
- Laine L, Yang H, Chang SC, et al. Trends for incidence of hospitalization and death due to GI complications in the United States from 2001 to 2009. Am J Gastroenterol 2012;107:1190–5; quiz 1196. - PubMed
-
- Abougergi MS, Travis AC, Saltzman JR. The in-hospital mortality rate for upper GI hemorrhage has decreased over 2 decades in the United States: a nationwide analysis. Gastrointest Endosc 2015;81:882–8 e1. - PubMed
-
- Wuerth BA, Rockey DC. Changing Epidemiology of Upper Gastrointestinal Hemorrhage in the Last Decade: A Nationwide Analysis. Dig Dis Sci 2018;63:1286–1293. - PubMed
Publication types
MeSH terms
Grants and funding
LinkOut - more resources
Full Text Sources
Medical