. 2022 Oct;31(10):e4437.
doi: 10.1002/pro.4437.

Structural basis for the interaction between the first SURP domain of the SF3A1 subunit in U2 snRNP and the human splicing factor SF1

Affiliations

Structural basis for the interaction between the first SURP domain of the SF3A1 subunit in U2 snRNP and the human splicing factor SF1

Nobukazu Nameki et al. Protein Sci. 2022 Oct.

Abstract

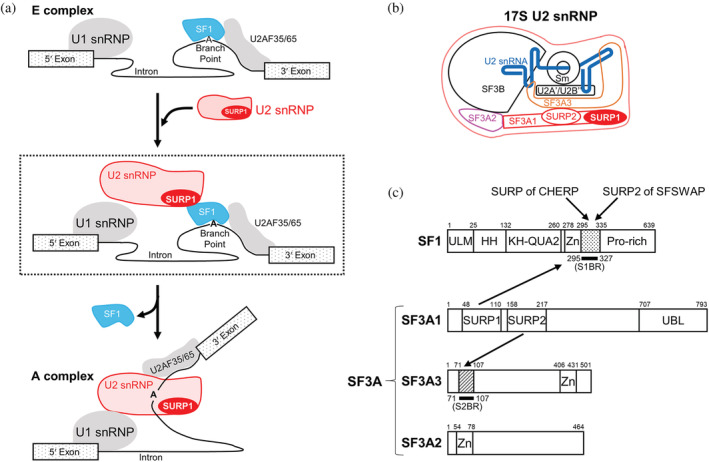
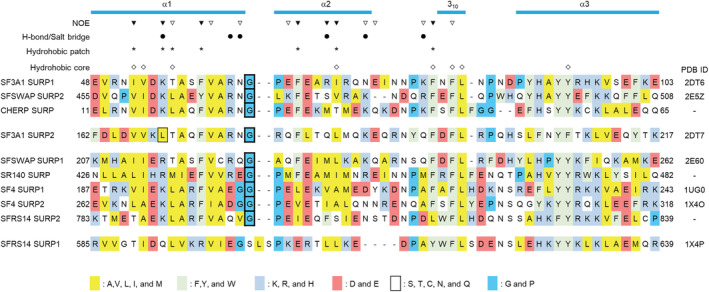
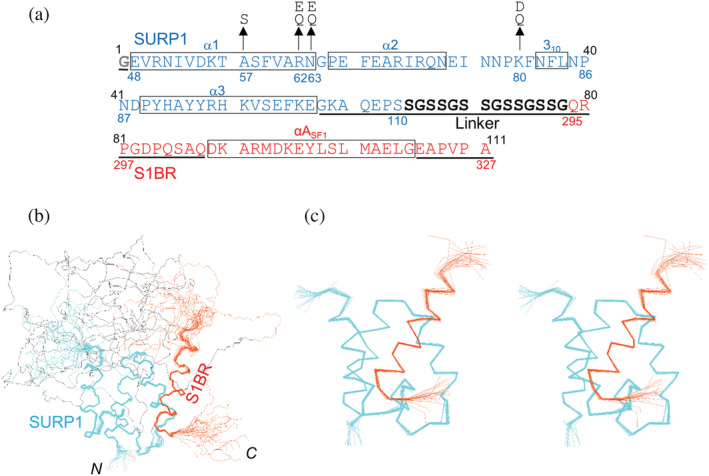
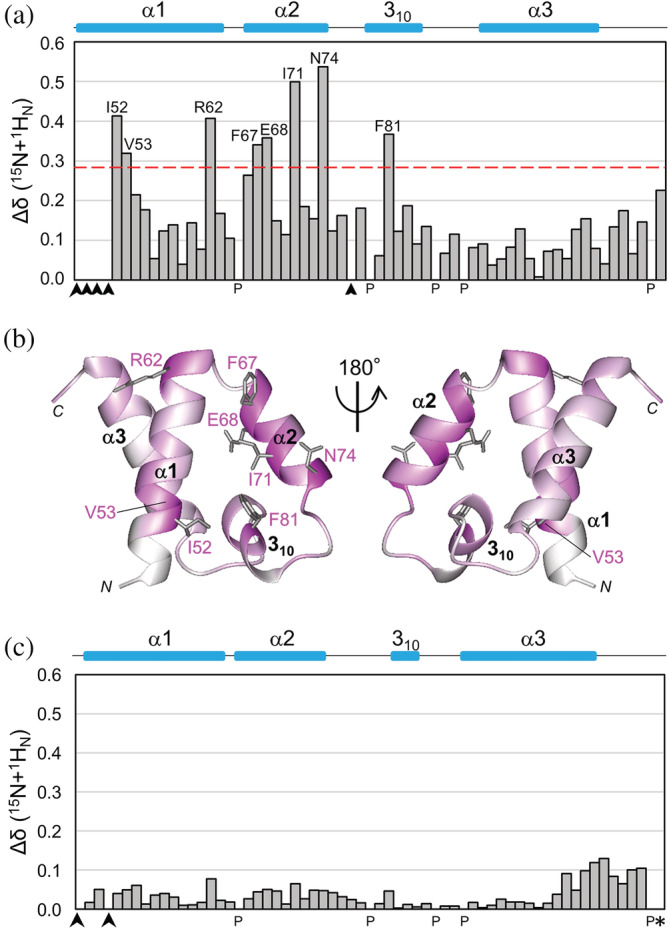
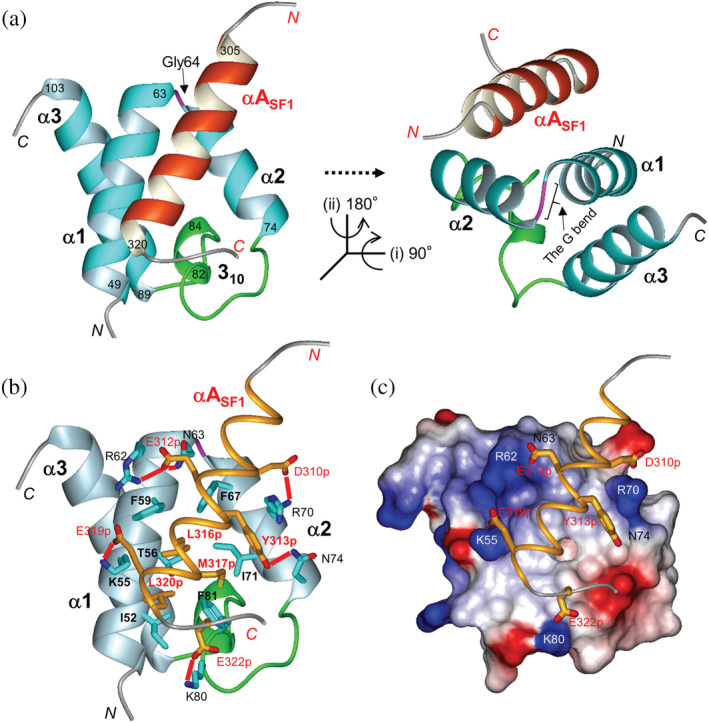
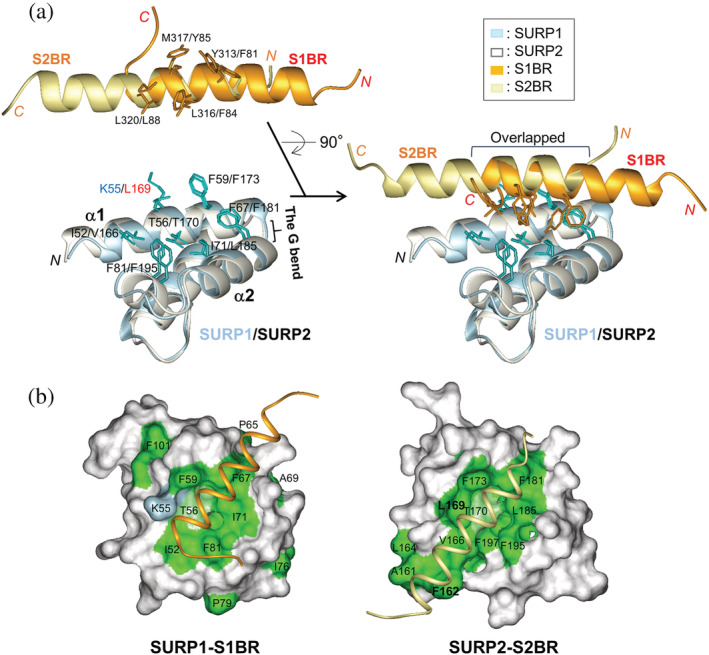
SURP domains are exclusively found in splicing-related proteins in all eukaryotes. SF3A1, a component of the U2 snRNP, has two tandem SURP domains, SURP1, and SURP2. SURP2 is permanently associated with a specific short region of SF3A3 within the SF3A protein complex whereas, SURP1 binds to the splicing factor SF1 for recruitment of U2 snRNP to the early spliceosomal complex, from which SF1 is dissociated during complex conversion. Here, we determined the solution structure of the complex of SURP1 and the human SF1 fragment using nuclear magnetic resonance (NMR) methods. SURP1 adopts the canonical topology of α1-α2-310 -α3, in which α1 and α2 are connected by a single glycine residue in a particular backbone conformation, allowing the two α-helices to be fixed at an acute angle. A hydrophobic patch, which is part of the characteristic surface formed by α1 and α2, specifically contacts a hydrophobic cluster on a 16-residue α-helix of the SF1 fragment. Furthermore, whereas only hydrophobic interactions occurred between SURP2 and the SF3A3 fragment, several salt bridges and hydrogen bonds were found between the residues of SURP1 and the SF1 fragment. This finding was confirmed through mutational studies using bio-layer interferometry. The study also revealed that the dissociation constant between SURP1 and the SF1 fragment peptide was approximately 20 μM, indicating a weak or transient interaction. Collectively, these results indicate that the interplay between U2 snRNP and SF1 involves a transient interaction of SURP1, and this transient interaction appears to be common to most SURP domains, except for SURP2.

Keywords: NMR; SF1; SF3A1; SF3a120; SURP; SWAP; U2 snRNP; bio-layer interferometry; complex structure; splicing.


Conflict of interest statement

The authors declare no conflict of interests.

Figures

FIGURE 1
FIGURE 1
Splicing factors involved in early spliceosome assembly. (a) Schematic diagram of the process of transition from the E to A complex. U2 snRNP binds to SF1 via SURP1 for the recruitment of U2 snRNP to the E complex, shown in the dashed box. During the E to A conversion process, which occurs in an ATP‐dependent manner, SF1 is displaced by U2 snRNP and released from the spliceosome. (b) Schematic diagram of 17S U2 snRNP. U2 snRNA is represented by a blue bold line. SF3A1, SF3A2, and SF3A3 proteins, which are components of the SF3A protein complex, are depicted in red, magenta, and orange, respectively. Two tandem SURP domains, SURP1, and SURP2, in SF3A1 are represented by red oval shapes. (c) Schematic diagrams of the domain architecture of SF1, SF3A1, SF3A2, and SF3A3 from humans. SF1 has five structural domains, namely, the UHM ligand motif (ULM), helix hairpin (HH), K homology and Quaking homology 2 domain (KH‐QUA2), and zinc‐finger domain (Zn). In addition, SF1 has a proline‐rich region (Pro‐rich) in the C terminus. Regarding the SF3A complex, SF3A1 has three structural domains, SURP1, SURP2, and a Ubiquitin‐like domain (UBL) whilst SF3A2 and SF3A3 have a single structural domain, a zinc‐finger domain (Zn). No other known motifs have been found in the three components of SF3A. Bold black lines indicate a “SURP1‐binding site”‐containing region (S1BR, dotted) and the SURP2 counterpart (S2BR, hatted). A peptide corresponding to each region was used to determine the structures of the SURP1 and SURP2 complexes. Each of the binding partners of the four SURP domains is indicated by an arrow; SURP1 of SF3A1 and the SURP domains of CHERP and SFSWAP bind to S1BR in SF1, while SURP2 binds to S2BR in SF3A3.
FIGURE 2
FIGURE 2
Structure‐based sequence alignment of SURP domains from humans. Amino acid sequence alignments of SURP domains from humans were performed using the ClustalW program and then manually modified based on the structures of the SURP domains. The accession codes used in the sequence alignment were as follows: SF3A1 (UniProt accession No. Q15459), SFSWAP (Q12872), CHERP (Q8IWX8), SR140 (O15042), SF4 (Q8IWZ8), and SFRS14 (Q8IX01). All structures were previously published by our group, and each protein data bank (PDB) code is shown. The secondary structure elements are shown in cyan at the top. The alignments are colored according to the amino acid type shown in the alignment legend. Each box with thick black lines indicates a Gly residue connecting α1 and α2, which forms the G bend. The single box with thin black lines indicates Leu169 in α1 of SURP2, which is the determinant of the SURP2 complex formation. The inverted triangles indicate SURP1 residues for which intermolecular NOEs from S1BR were observed (open inverted triangle: less than 10 NOEs, filled inverted triangle: 10 or more NOEs). Filled round marks indicate SURP1 residues that participate in hydrogen bonds or salt bridges with S1BR. Asterisks indicate SURP1 residues that form a hydrophobic patch that interacts with S1BR. Diamonds indicate residues that form a hydrophobic core common to SURP domains.
FIGURE 3
FIGURE 3
Amino acid sequence and solution structure of the chimera. (a) Amino acid sequence of the chimera used in this study. The numbers above the sequence indicate the residue numbers of the chimera. Blue and red residues/numbers correspond to SURP1 of SF3A1 and S1BR of SF1, respectively. Residues of the linker are indicated in black, and the first residue, Gly, which is derived from the TEV protease cleavage site is indicated in gray. Boxes indicate secondary structural elements according to the determined structure. Residues in the disordered region in the chimera structure are underlined. Substituted residues are indicated by arrows. (b) A trace of the backbone atoms for the 20 superimposed lowest‐energy conformers of the whole chimera composed of SURP1 (res. 48–110), the 14‐residue linker, and S1BR (res. 295–327). Backbone atoms of residues 48–103 of SURP1 and residues 305–322 of S1BR were fitted by a least‐square method. Cyan, black, and orange lines represent the Cα traces of SURP1, the linker, and S1BR, respectively. (c) Stereoview showing a trace of the backbone atoms for an ensemble of the 20 lowest energy conformers for SURP1 (res. 48–105) and S1BR (res. 302–324) in the chimera. Most of the disordered regions, including the linker, are omitted from the trace in (b) and the rest has been zoomed in.
FIGURE 4
FIGURE 4
NMR chemical shift perturbations of labeled SURP1 upon binding of non‐labeled S1BRp, and comparison of chemical shift values between complex structure SURP1 and SURP1 of the chimera. (a) Quantification of the chemical shift perturbation values of labeled SURP1 upon S1BRp binding. Perturbation values were obtained from [1H,15N]‐HSQC spectra in the absence and presence of S1BRp (Figure S4a). The absolute values of the chemical shift change Δδ(15 N + 1 H N) are shown. The value for each residue was calculated as follows: Δδ(15 N + 1 H N) = [(δ 15N/6.5)2 + δ 1H 2]1/2. Perturbation values greater than the average (0.16 ppm) plus the standard deviation (0.12 ppm) were defined as significant perturbations (i.e., the significance level of 0.28 ppm is indicated by a red dotted line). Residues with resonances that were not assigned are indicated by arrowheads, and proline is indicated by P. Only residues with significant chemical shift changes are shown. (b) Mapping of residues with chemical shift changes on the ribbon representation of individual SURP1 in its free form [PDB ID 2DT7]. Residues are colored based on the magnitude of the chemical shift change upon S1BRp binding, ranging from white (not assigned or measured) to magenta (largest chemical shift change). Only the side chains of the residues with significant chemical shift changes are represented in gray. (c) Differences of the chemical shift values between the S1BRp‐bound form of SURP1 and the chimeric form of SURP1 in the chimera. The values were obtained from [1H,15N]‐HSQC spectrum of labeled SURP1 in the presence of S1BRp and from that of the labeled chimera (Figure S4b). The absolute values of the chemical shift difference between the two forms Δδ(15 N + 1 H N) are shown. The value for each residue was calculated, as described above. The average and standard deviation among residues in SURP1 are 0.04 ppm and 0.03 ppm, respectively, except for Gly110, which is the last residue of SURP1 (indicated by an asterisk). The absolute value of the chemical shift change of Gly110 is 6.19 ppm; the corresponding bar is not indicated in this graph. Because, in the chimera, Gly110 is directly connected with the linker, the chemical shift value cannot be simply compared with that of the last residue, Gly, of individual SURP1.
FIGURE 5
FIGURE 5
The structure of SURP1 in complex with S1BR. (a) Ribbon representation of SURP1 (res. 48–105) in complex with S1BR (res. 302–324) in different views. The structure in the left panel is in the same orientation as that of Figure 3c. The structure in the right panel is rotated as directed. The α‐helices in SURP1 and S1BR are depicted in cyan and orange, respectively. The G bend, connecting α1 and α2, and the 310 loop, connecting α2 and α3, are depicted in magenta and green, respectively. (b) Interaction between SURP1 and S1BR. Structures of SURP1 and S1BR are shown in ribbon (light blue) and thin ribbon (orange) models, respectively. Residues involved in the complex formation are shown, as described in the text. Side chains of the residues are represented as follows: carbon, cyan (SURP1), or orange (S1BR); oxygen, red; nitrogen, blue; and sulfur, yellow. Salt bridges and hydrogen bonds between SURP1 and S1BR are represented by red lines. (c) The electrostatic potential surface of SURP1 in complex with S1BR. Red and blue indicate negative and positive charges, respectively. The representation code in S1BR is the same as that in (b). The view is in the same orientation as that in (b).
FIGURE 6
FIGURE 6
Comparison between SURP1‐S1BR and the SURP2–S2BR complexes. (a) Superposition of the structures of SURP1 (res. 48–105, light blue) in complex with S1BR (res. 302–324, orange) and of SURP2 (res. 160–217, white) in complex with S2BR (res. 77–99, light yellow) (PDB ID 2DT7). The left panels show the separation of complexes into the SURP domains and bound peptides for the clarification of residues involved in the hydrophobic interaction network. The side chains of the SURP domains and ligand peptides involved are colored cyan and orange, respectively. (b) Molecular surface representations showing hydrophobic residues of SURP1 (res. 48–105) (left panel) and SURP2 (res. 160–217) (right panel) with stick representations used for the ligand. Hydrophobic residues (Ala, Ile, Leu, Met, Phe, Pro, Trp, and Val) are colored green. In addition, a threonine residue containing a methyl group and lysine residues containing methylene groups are colored light green and light blue, respectively. The views are in the same orientation as that in Figure 5.

References

    1. Wahl MC, Will CL, Lührmann R. The spliceosome: Design principles of a dynamic RNP machine. Cell. 2009;136:701–718. - PubMed
    1. Plaschka C, Lin PC, Charenton C, Nagai K. Prespliceosome structure provides insights into spliceosome assembly and regulation. Nature. 2018;559:419–422. - PMC - PubMed
    1. Liu Z, Luyten I, Bottomley MJ, et al. Structural basis for recognition of the intron branch site RNA by splicing factor 1. Science. 2001;294:1098–1102. - PubMed
    1. Yoshida H, Park SY, Sakashita G, et al. Elucidation of the aberrant 3′ splice site selection by cancer‐associated mutations on the U2AF1. Nat Commun. 2020;11:4744. - PMC - PubMed
    1. Das R, Zhou Z, Reed R. Functional association of U2 snRNP with the ATP‐independent spliceosomal complex E. Mol Cell. 2000;5:779–787. - PubMed

Publication types