

Demographic and Selection Histories of Populations Across the Sahel/Savannah Belt
- PMID: 36173804
- PMCID: PMC9582163
- DOI: 10.1093/molbev/msac209
Demographic and Selection Histories of Populations Across the Sahel/Savannah Belt
Abstract
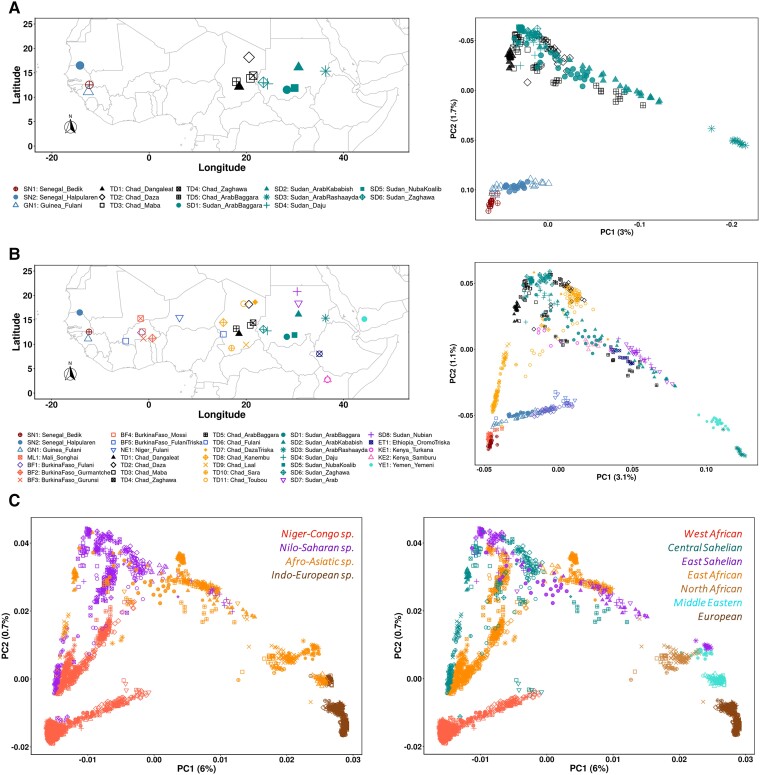
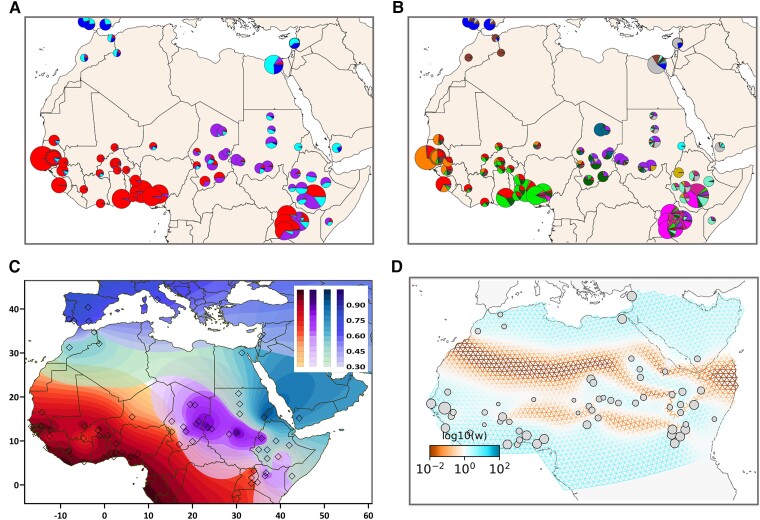
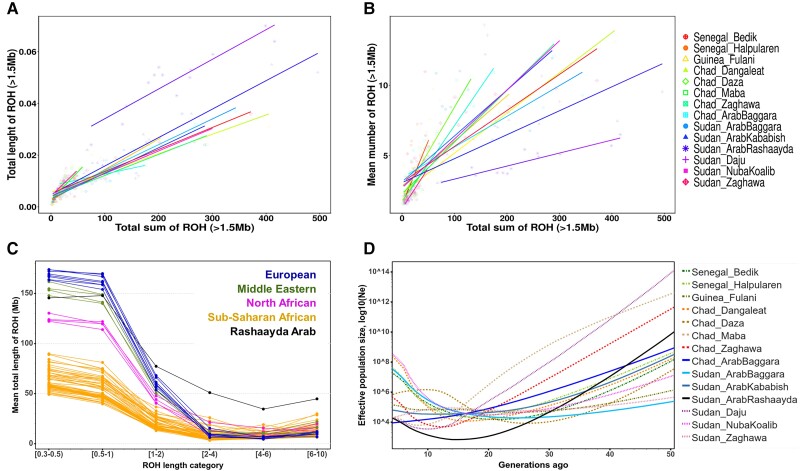
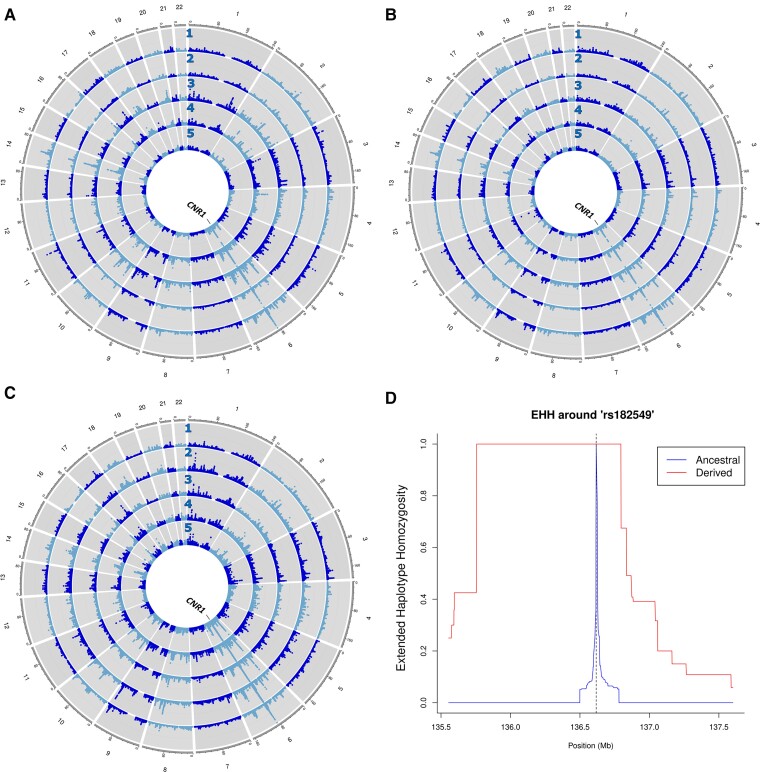
The Sahel/Savannah belt harbors diverse populations with different demographic histories and different subsistence patterns. However, populations from this large African region are notably under-represented in genomic research. To investigate the population structure and adaptation history of populations from the Sahel/Savannah space, we generated dense genome-wide genotype data of 327 individuals-comprising 14 ethnolinguistic groups, including 10 previously unsampled populations. Our results highlight fine-scale population structure and complex patterns of admixture, particularly in Fulani groups and Arabic-speaking populations. Among all studied Sahelian populations, only the Rashaayda Arabic-speaking population from eastern Sudan shows a lack of gene flow from African groups, which is consistent with the short history of this population in the African continent. They are recent migrants from Saudi Arabia with evidence of strong genetic isolation during the last few generations and a strong demographic bottleneck. This population also presents a strong selection signal in a genomic region around the CNR1 gene associated with substance dependence and chronic stress. In Western Sahelian populations, signatures of selection were detected in several other genetic regions, including pathways associated with lactase persistence, immune response, and malaria resistance. Taken together, these findings refine our current knowledge of genetic diversity, population structure, migration, admixture and adaptation of human populations in the Sahel/Savannah belt and contribute to our understanding of human history and health.
Keywords: CNR1 gene; Africa; admixture; camel herders; pastoralists; population structure; selection.
© The Author(s) 2022. Published by Oxford University Press on behalf of Society for Molecular Biology and Evolution.
Figures
Similar articles
-
Genetic Structure of the Western and Eastern African Sahel/Savannah Belt and the Role of Nomadic Pastoralists as Inferred from the Variation of D-Loop Mitochondrial DNA Sequences.Hum Biol. 2017 Oct;89(4):281-302. Hum Biol. 2017. PMID: 30047317
-
Demographic history and admixture dynamics in African Sahelian populations.Hum Mol Genet. 2021 Apr 26;30(R1):R29-R36. doi: 10.1093/hmg/ddaa239. Hum Mol Genet. 2021. PMID: 33105478 Review.
-
Genetic history of the African Sahelian populations.HLA. 2018 Mar;91(3):153-166. doi: 10.1111/tan.13189. Epub 2018 Jan 16. HLA. 2018. PMID: 29215793 Review.
-
Sahelian pastoralism from the perspective of variants associated with lactase persistence.Am J Phys Anthropol. 2020 Nov;173(3):423-436. doi: 10.1002/ajpa.24116. Epub 2020 Aug 19. Am J Phys Anthropol. 2020. PMID: 32812238
-
Population history and genetic adaptation of the Fulani nomads: inferences from genome-wide data and the lactase persistence trait.BMC Genomics. 2019 Dec 2;20(1):915. doi: 10.1186/s12864-019-6296-7. BMC Genomics. 2019. PMID: 31791255 Free PMC article.
Cited by
-
Forensic autosomal and gonosomal short tandem repeat marker reference database for populations in Burkina Faso.Sci Rep. 2024 Mar 28;14(1):7369. doi: 10.1038/s41598-024-58179-4. Sci Rep. 2024. PMID: 38548827 Free PMC article.
-
A Population Genetic Perspective on Subsistence Systems in the Sahel/Savannah Belt of Africa and the Historical Role of Pastoralism.Genes (Basel). 2023 Mar 20;14(3):758. doi: 10.3390/genes14030758. Genes (Basel). 2023. PMID: 36981029 Free PMC article. Review.
-
Evolutionary Genetics and Admixture in African Populations.Genome Biol Evol. 2023 Apr 6;15(4):evad054. doi: 10.1093/gbe/evad054. Genome Biol Evol. 2023. PMID: 36987563 Free PMC article. Review.
-
Evidence for Pathogen-Driven Selection Acting on HLA-DPB1 in Response to Plasmodium falciparum Malaria in West Africa.Ecol Evol. 2025 Feb 24;15(2):e70933. doi: 10.1002/ece3.70933. eCollection 2025 Feb. Ecol Evol. 2025. PMID: 40008064 Free PMC article.
-
Population history and admixture of the Fulani people from the Sahel.Am J Hum Genet. 2025 Feb 6;112(2):261-275. doi: 10.1016/j.ajhg.2024.12.015. Am J Hum Genet. 2025. PMID: 39919708 Free PMC article.
References
Publication types
MeSH terms
Substances
LinkOut - more resources
Full Text Sources
Molecular Biology Databases
