. 2022 Sep 30;377(6614):1519-1529.
doi: 10.1126/science.abj5104. Epub 2022 Sep 29.

Oncometabolite d-2HG alters T cell metabolism to impair CD8+ T cell function

Affiliations

Oncometabolite d-2HG alters T cell metabolism to impair CD8+ T cell function

Giulia Notarangelo et al. Science. .

Abstract

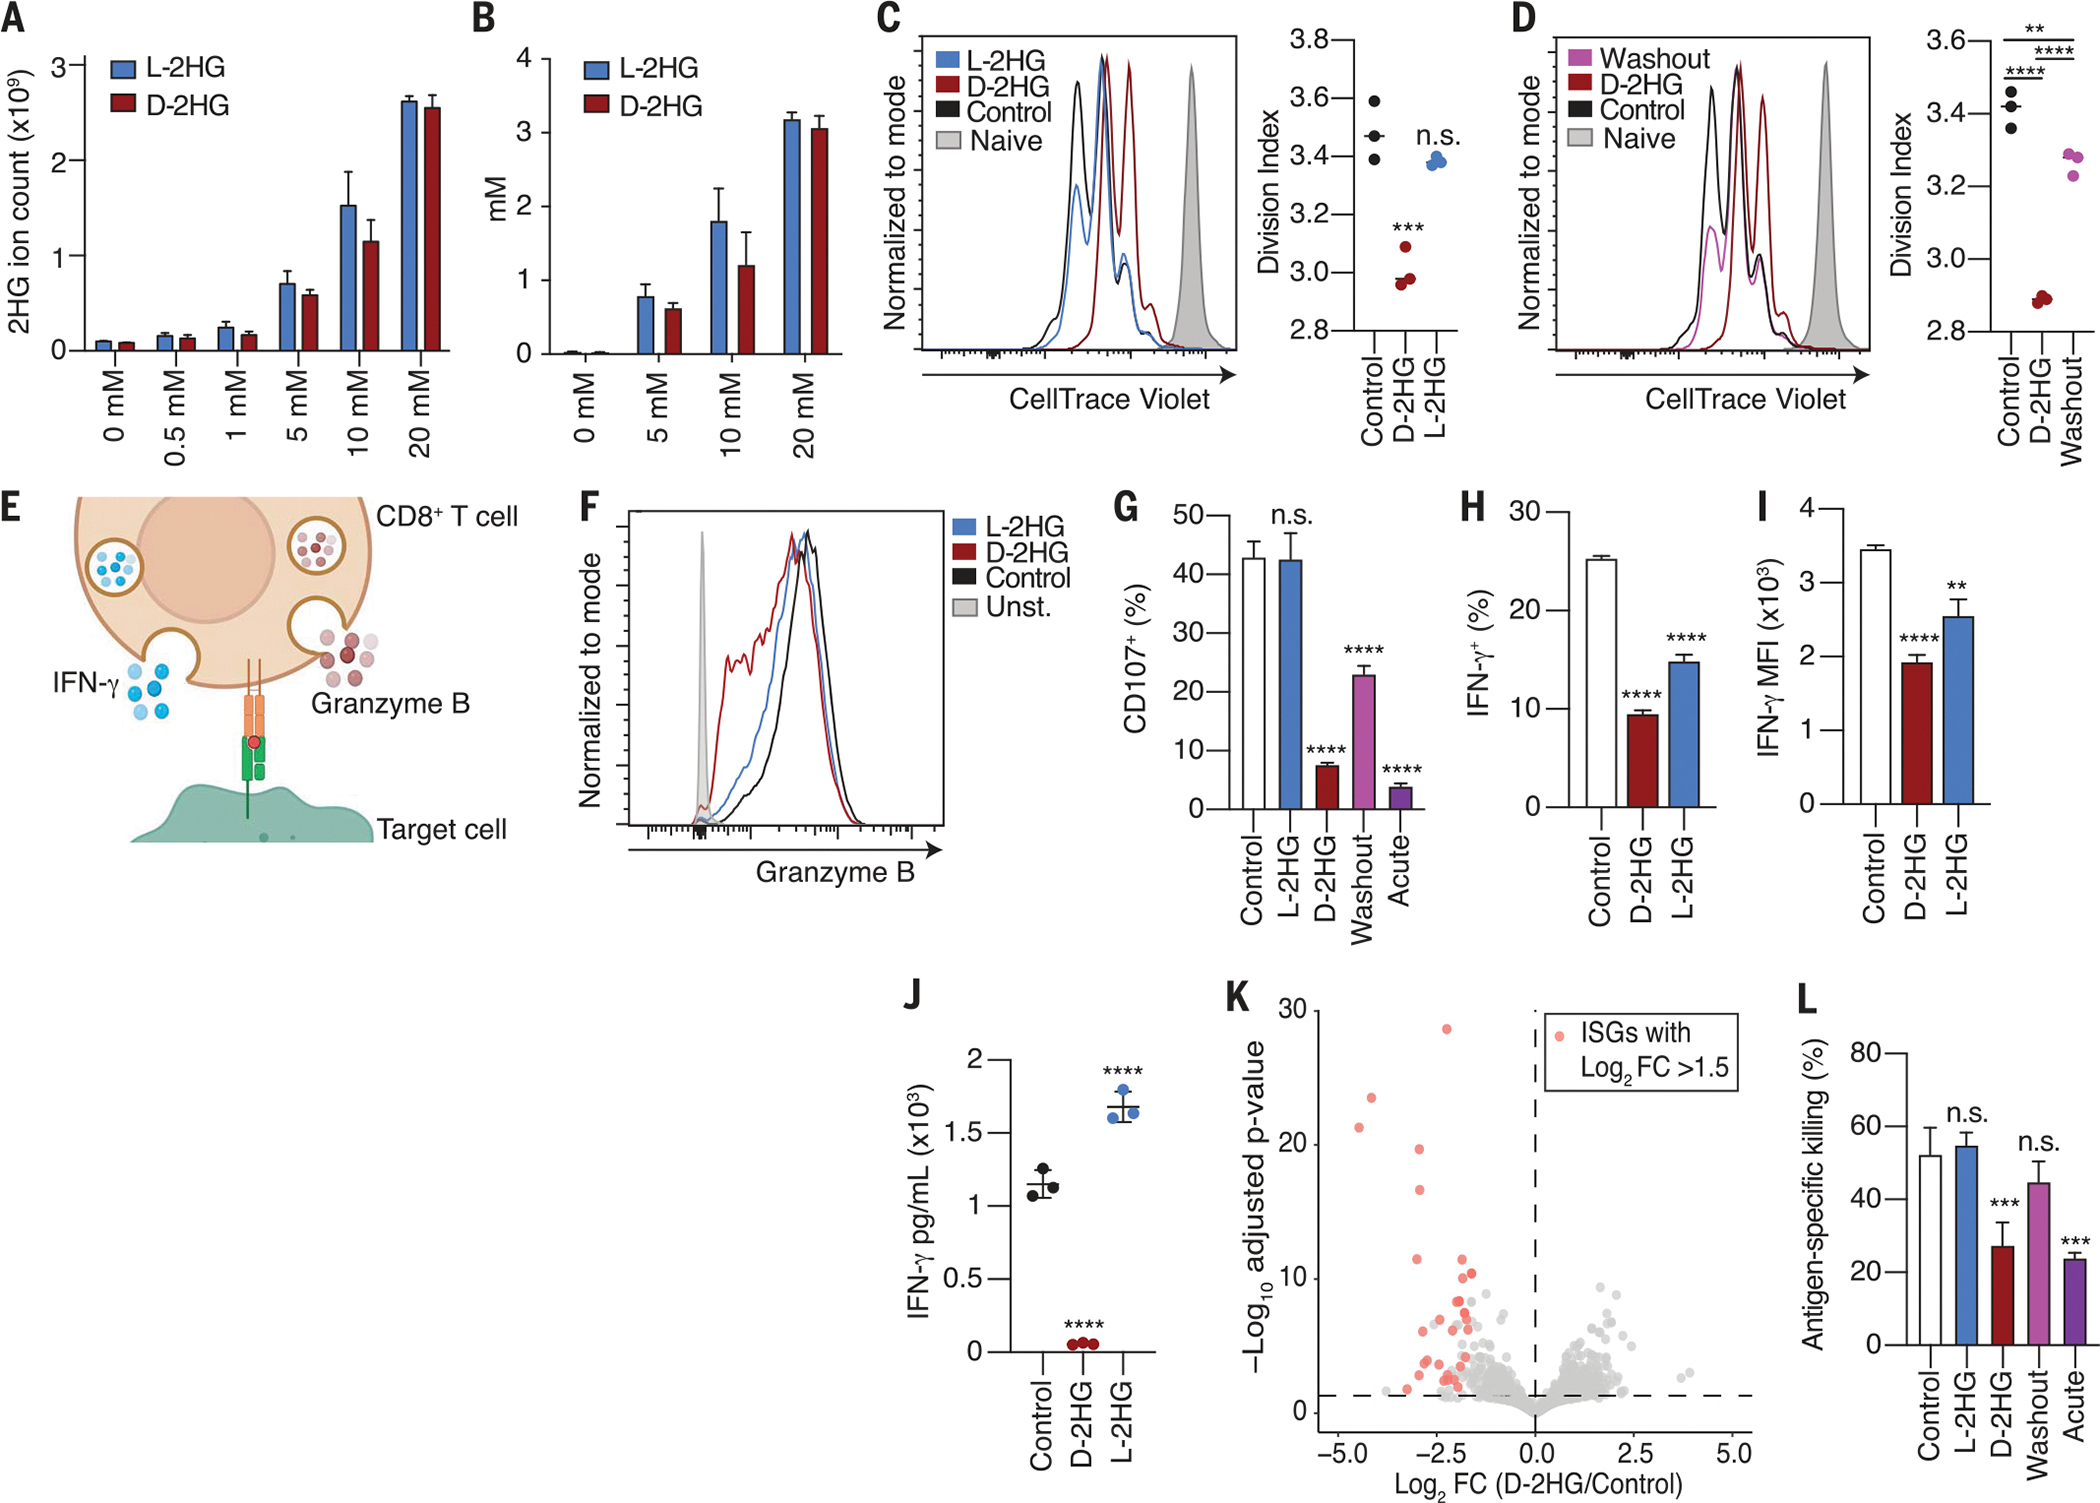
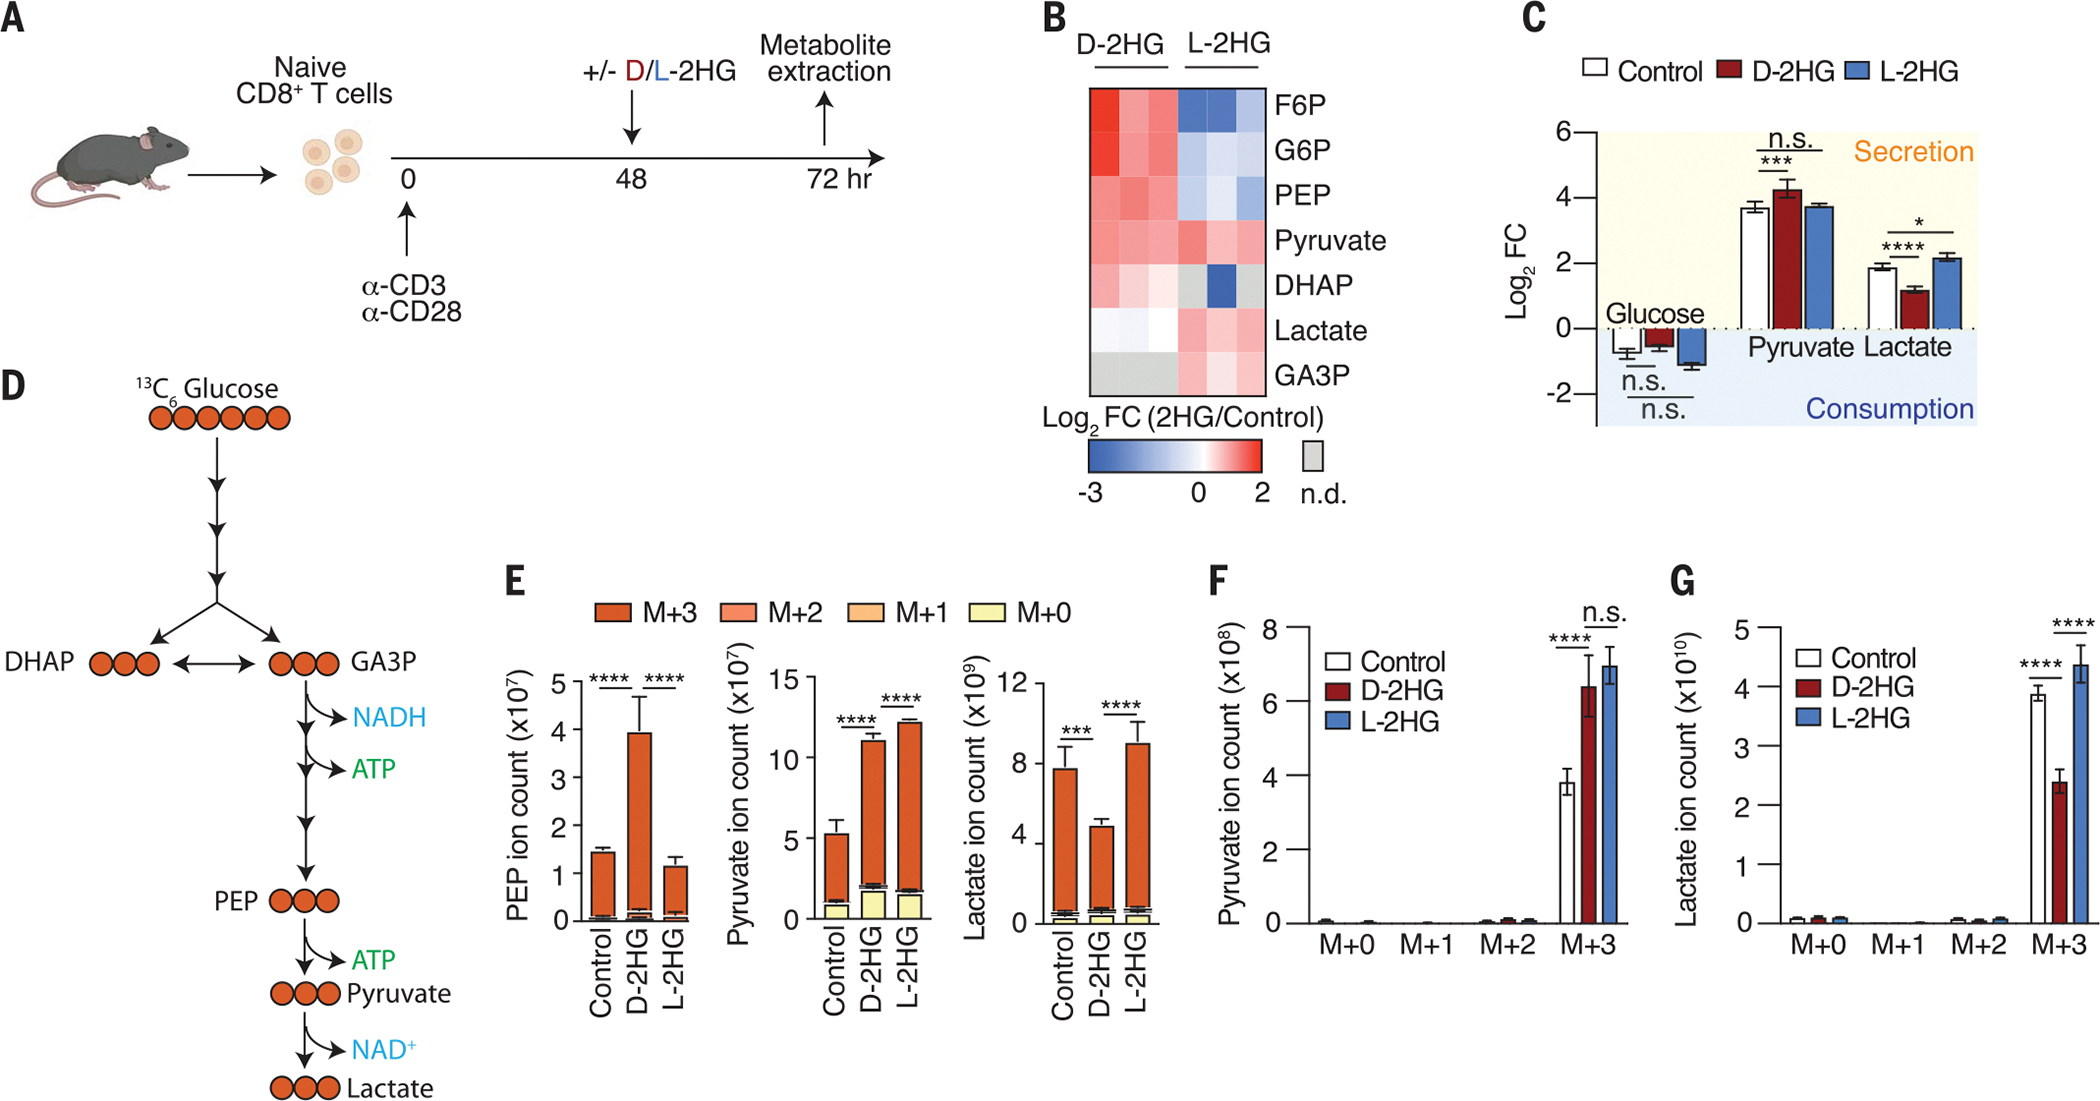
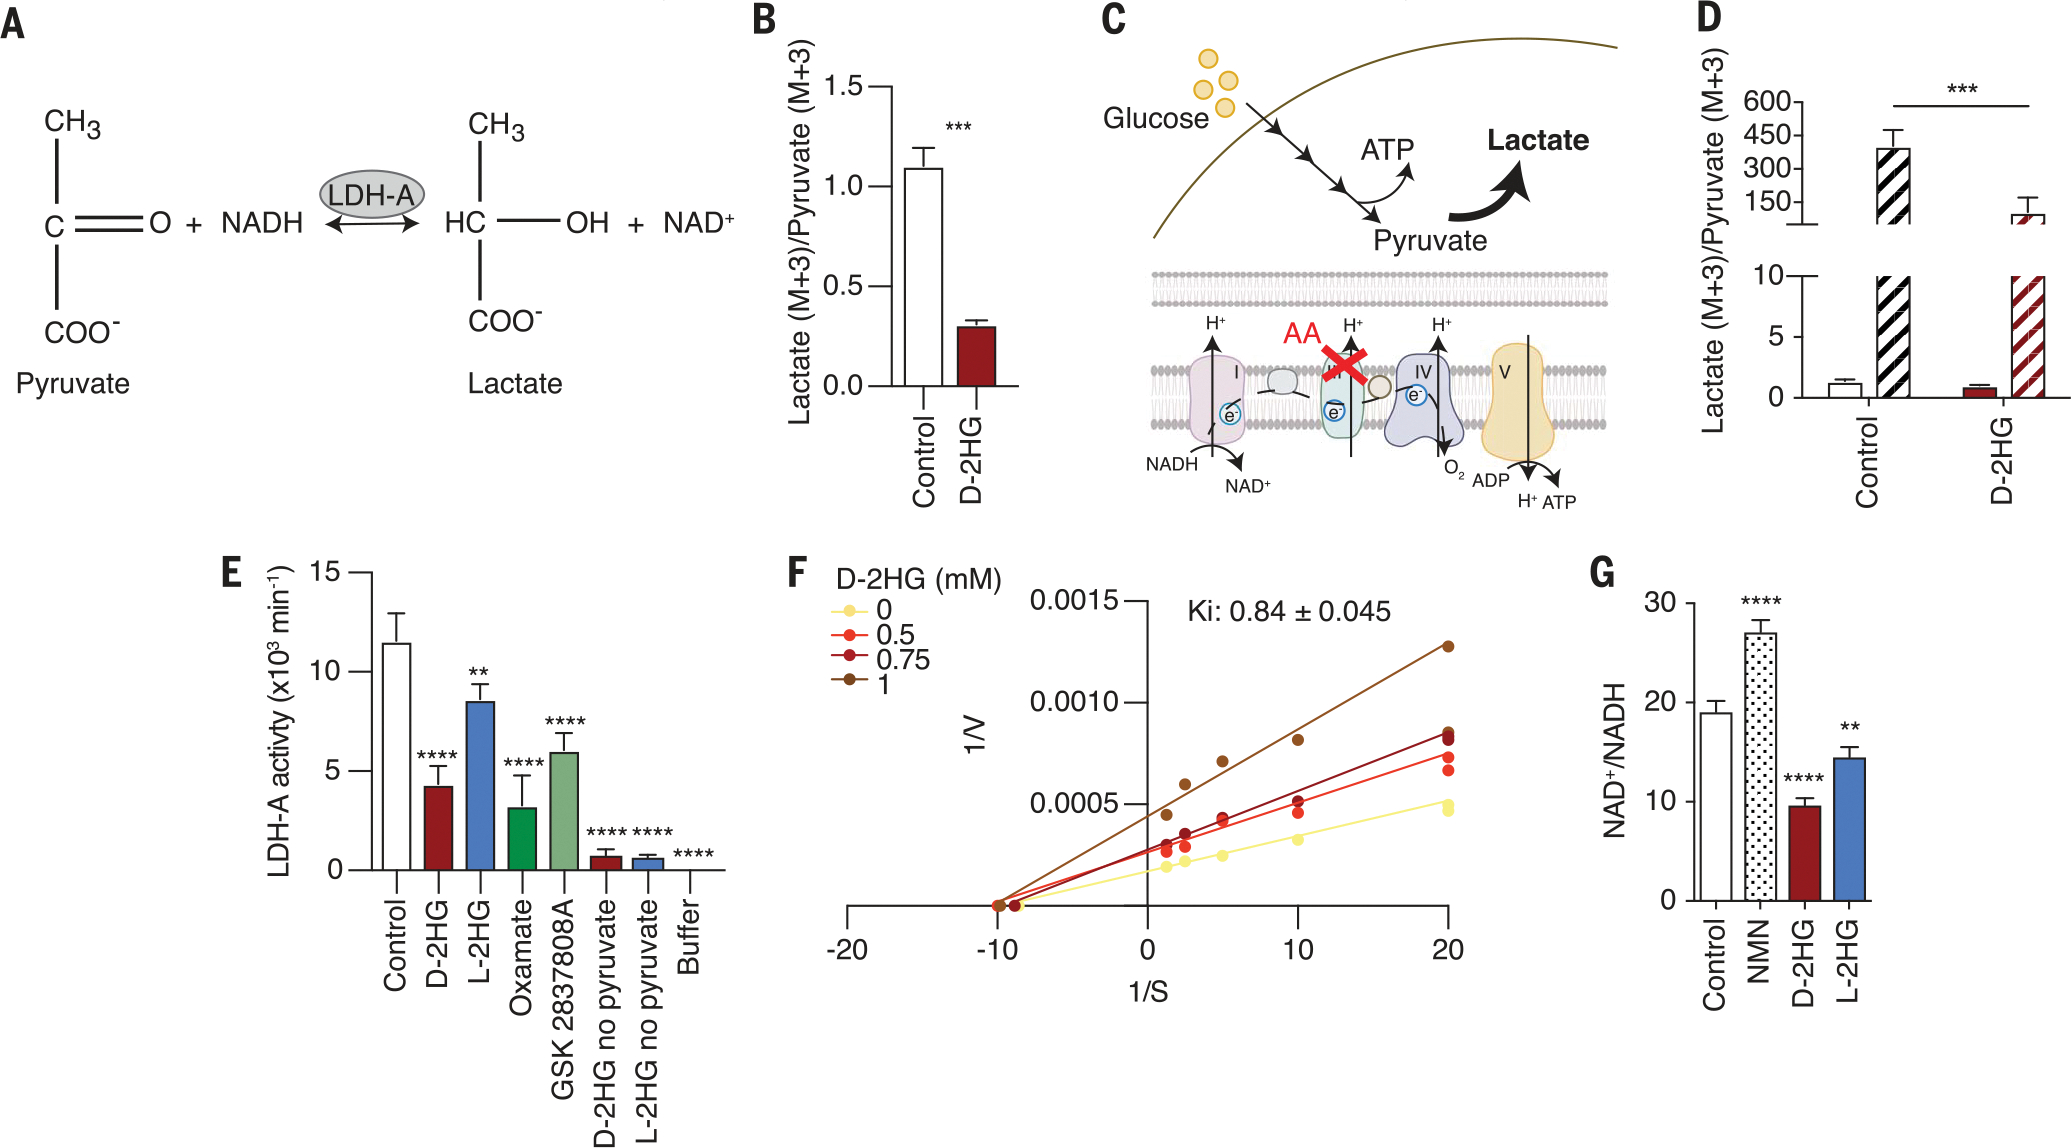
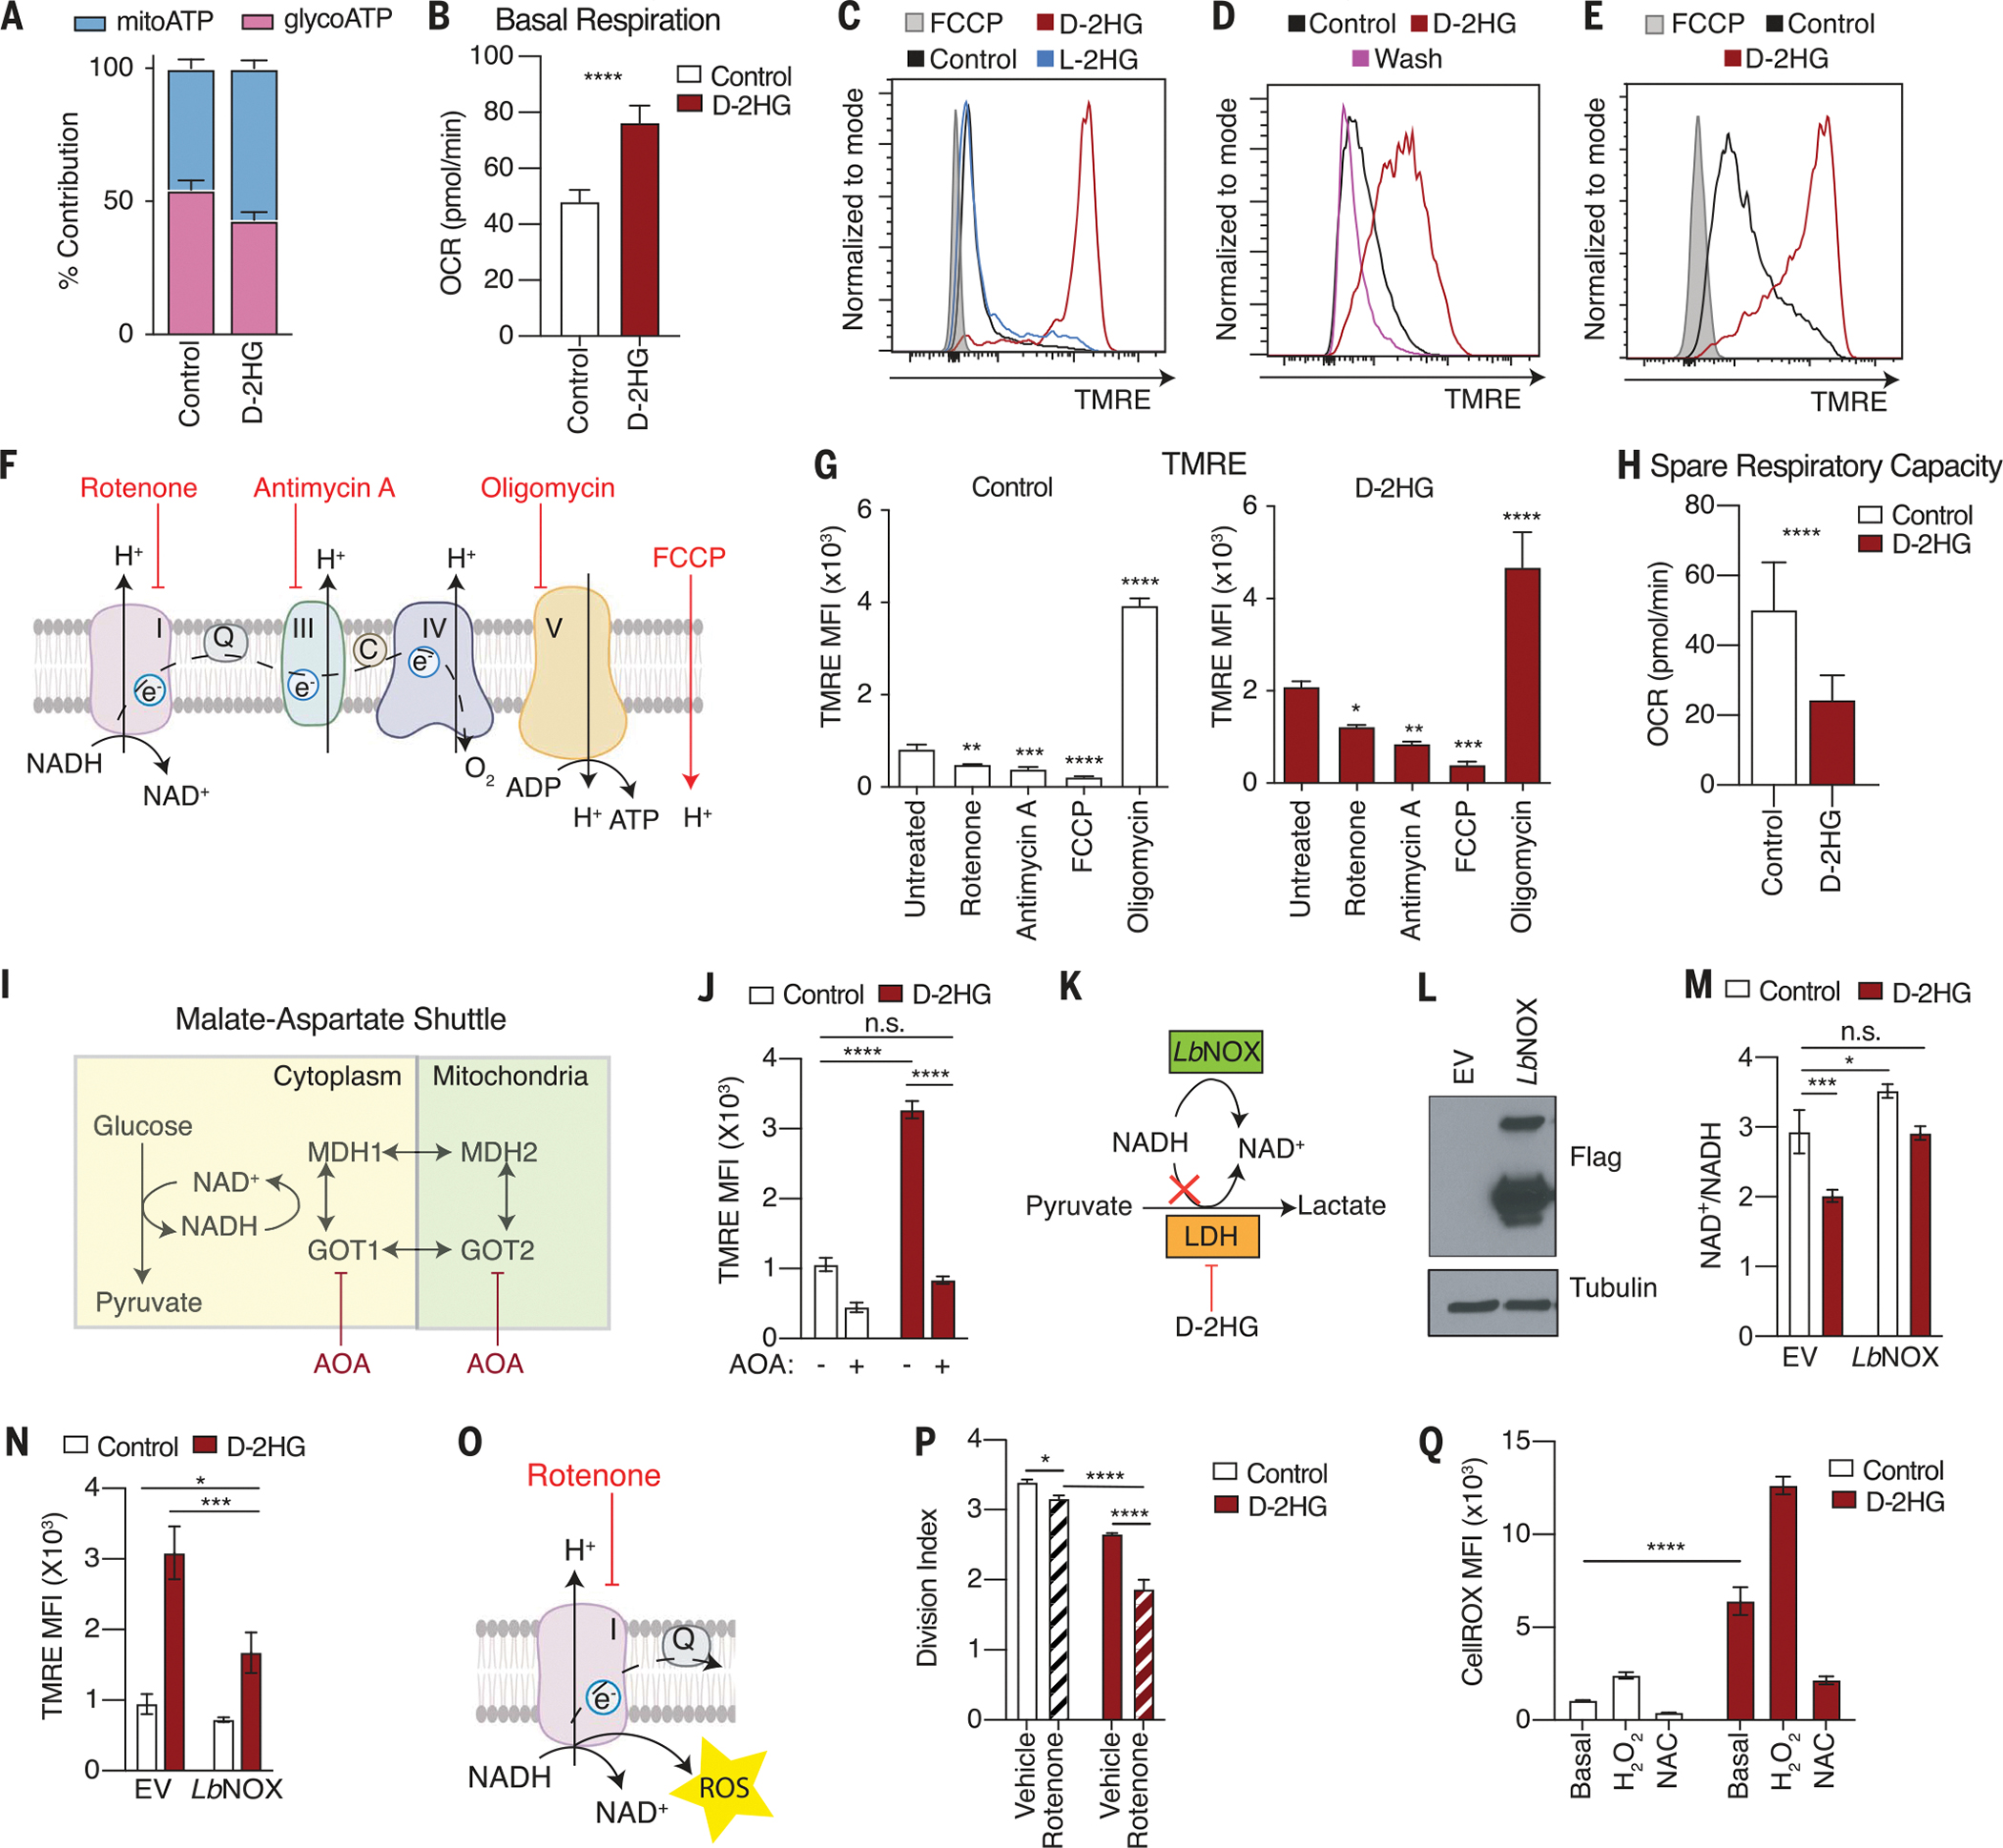
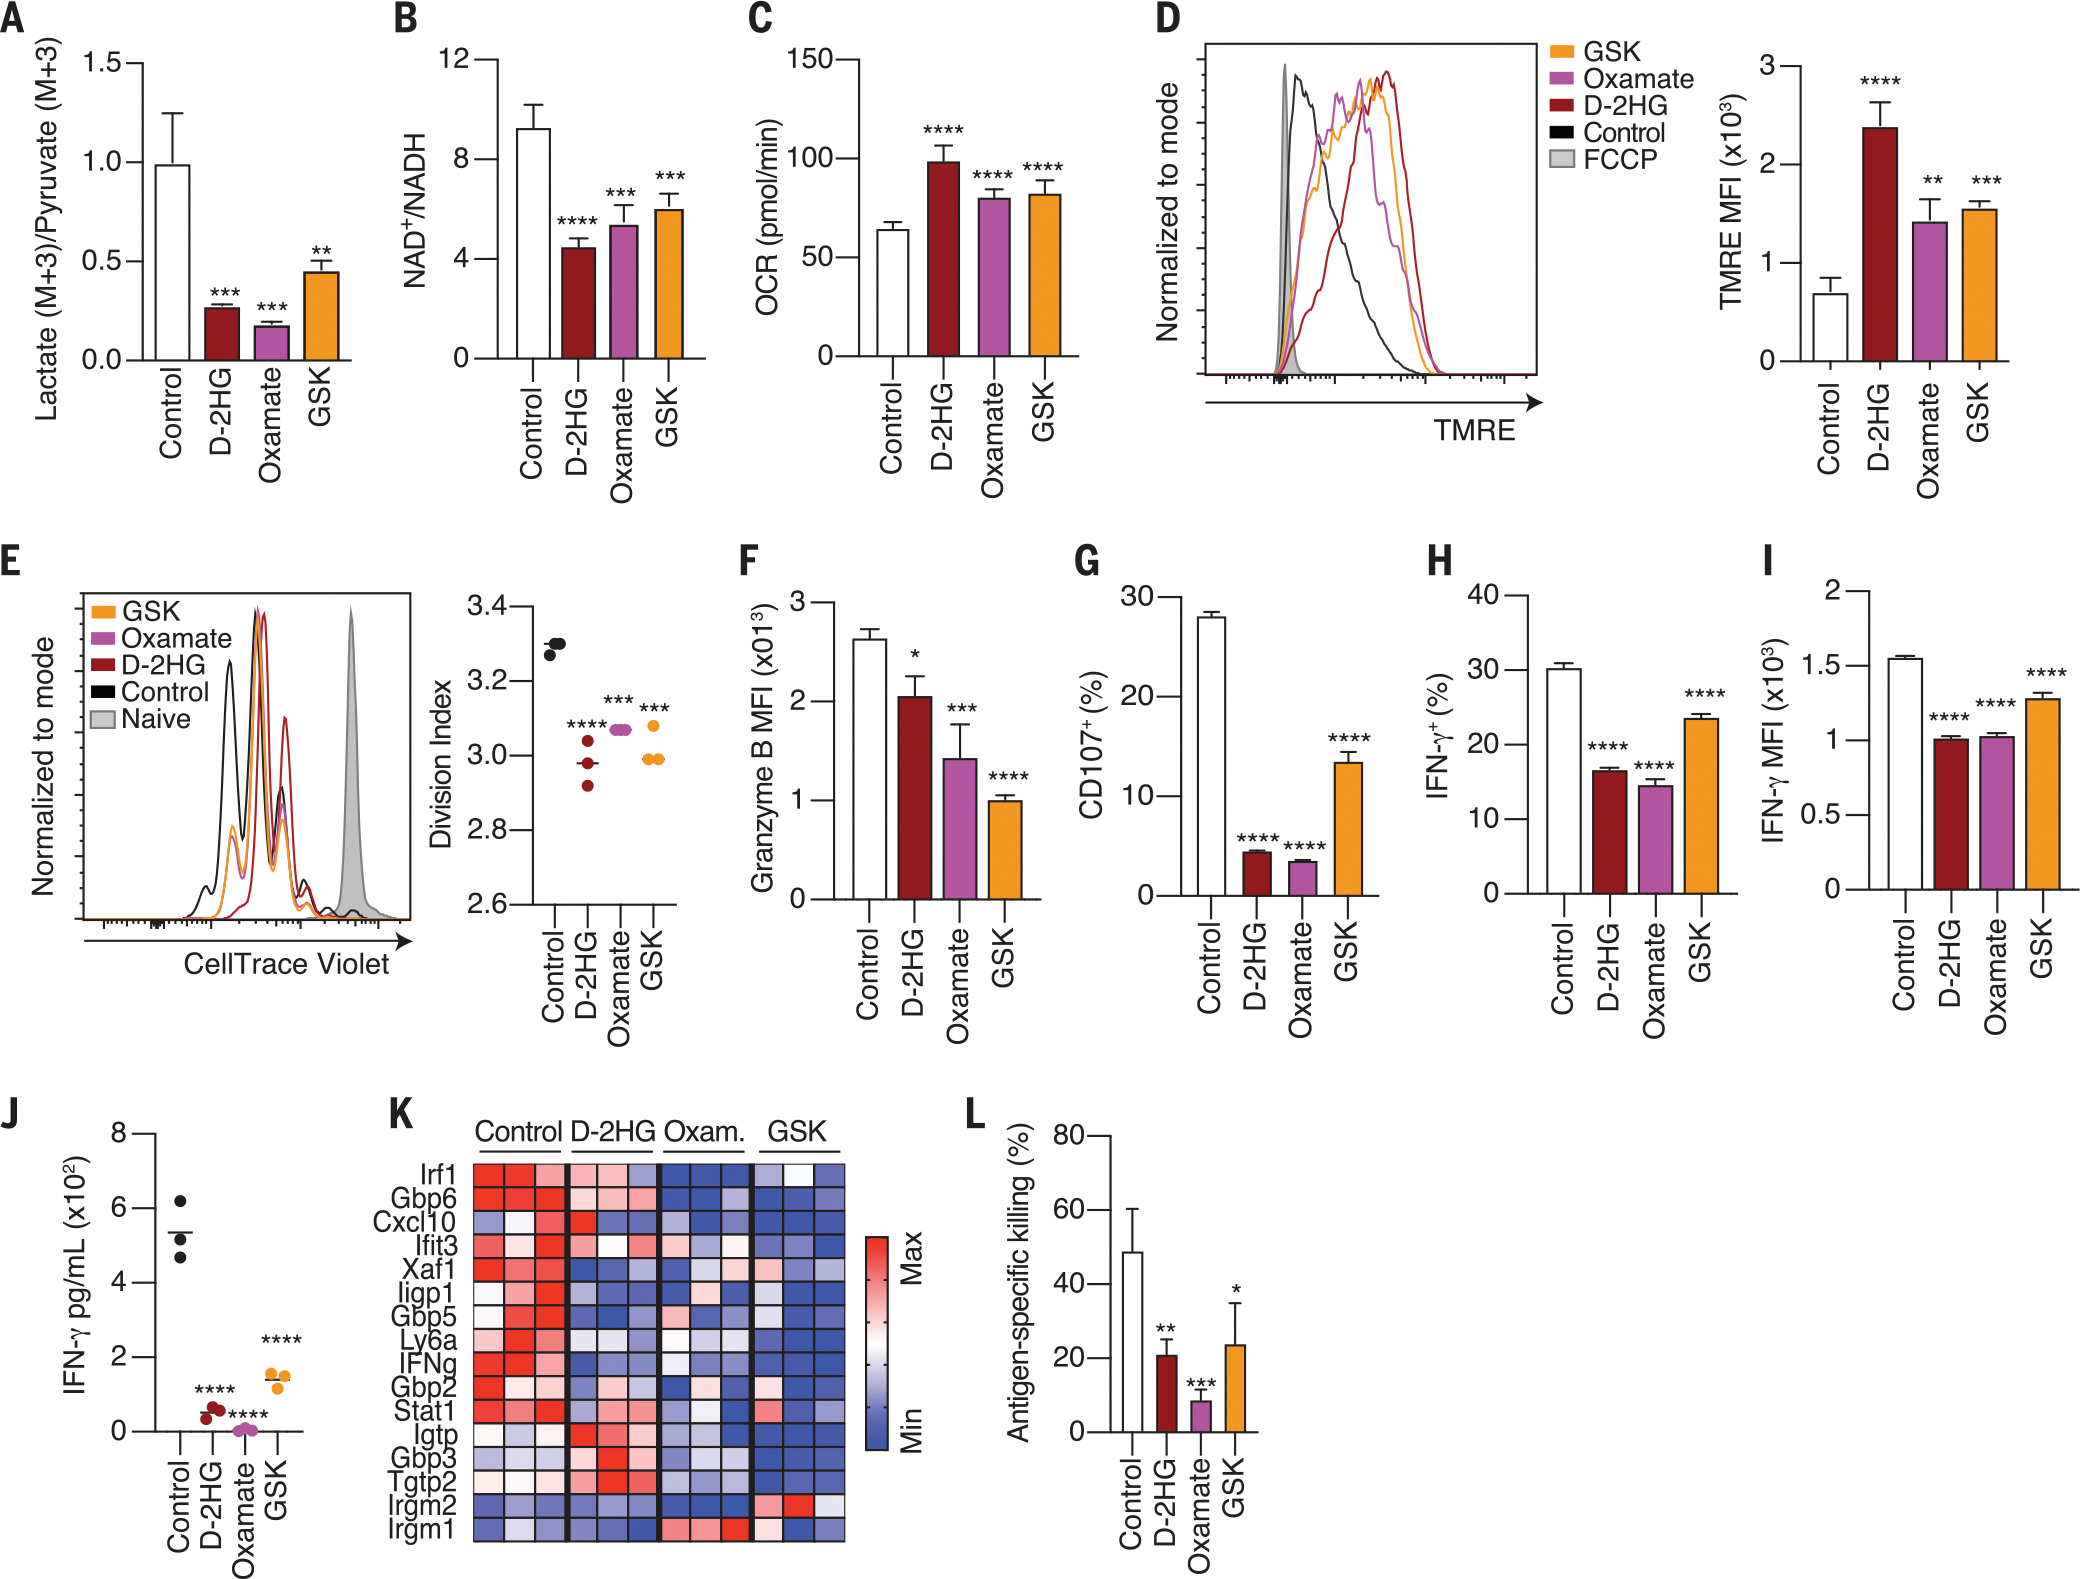
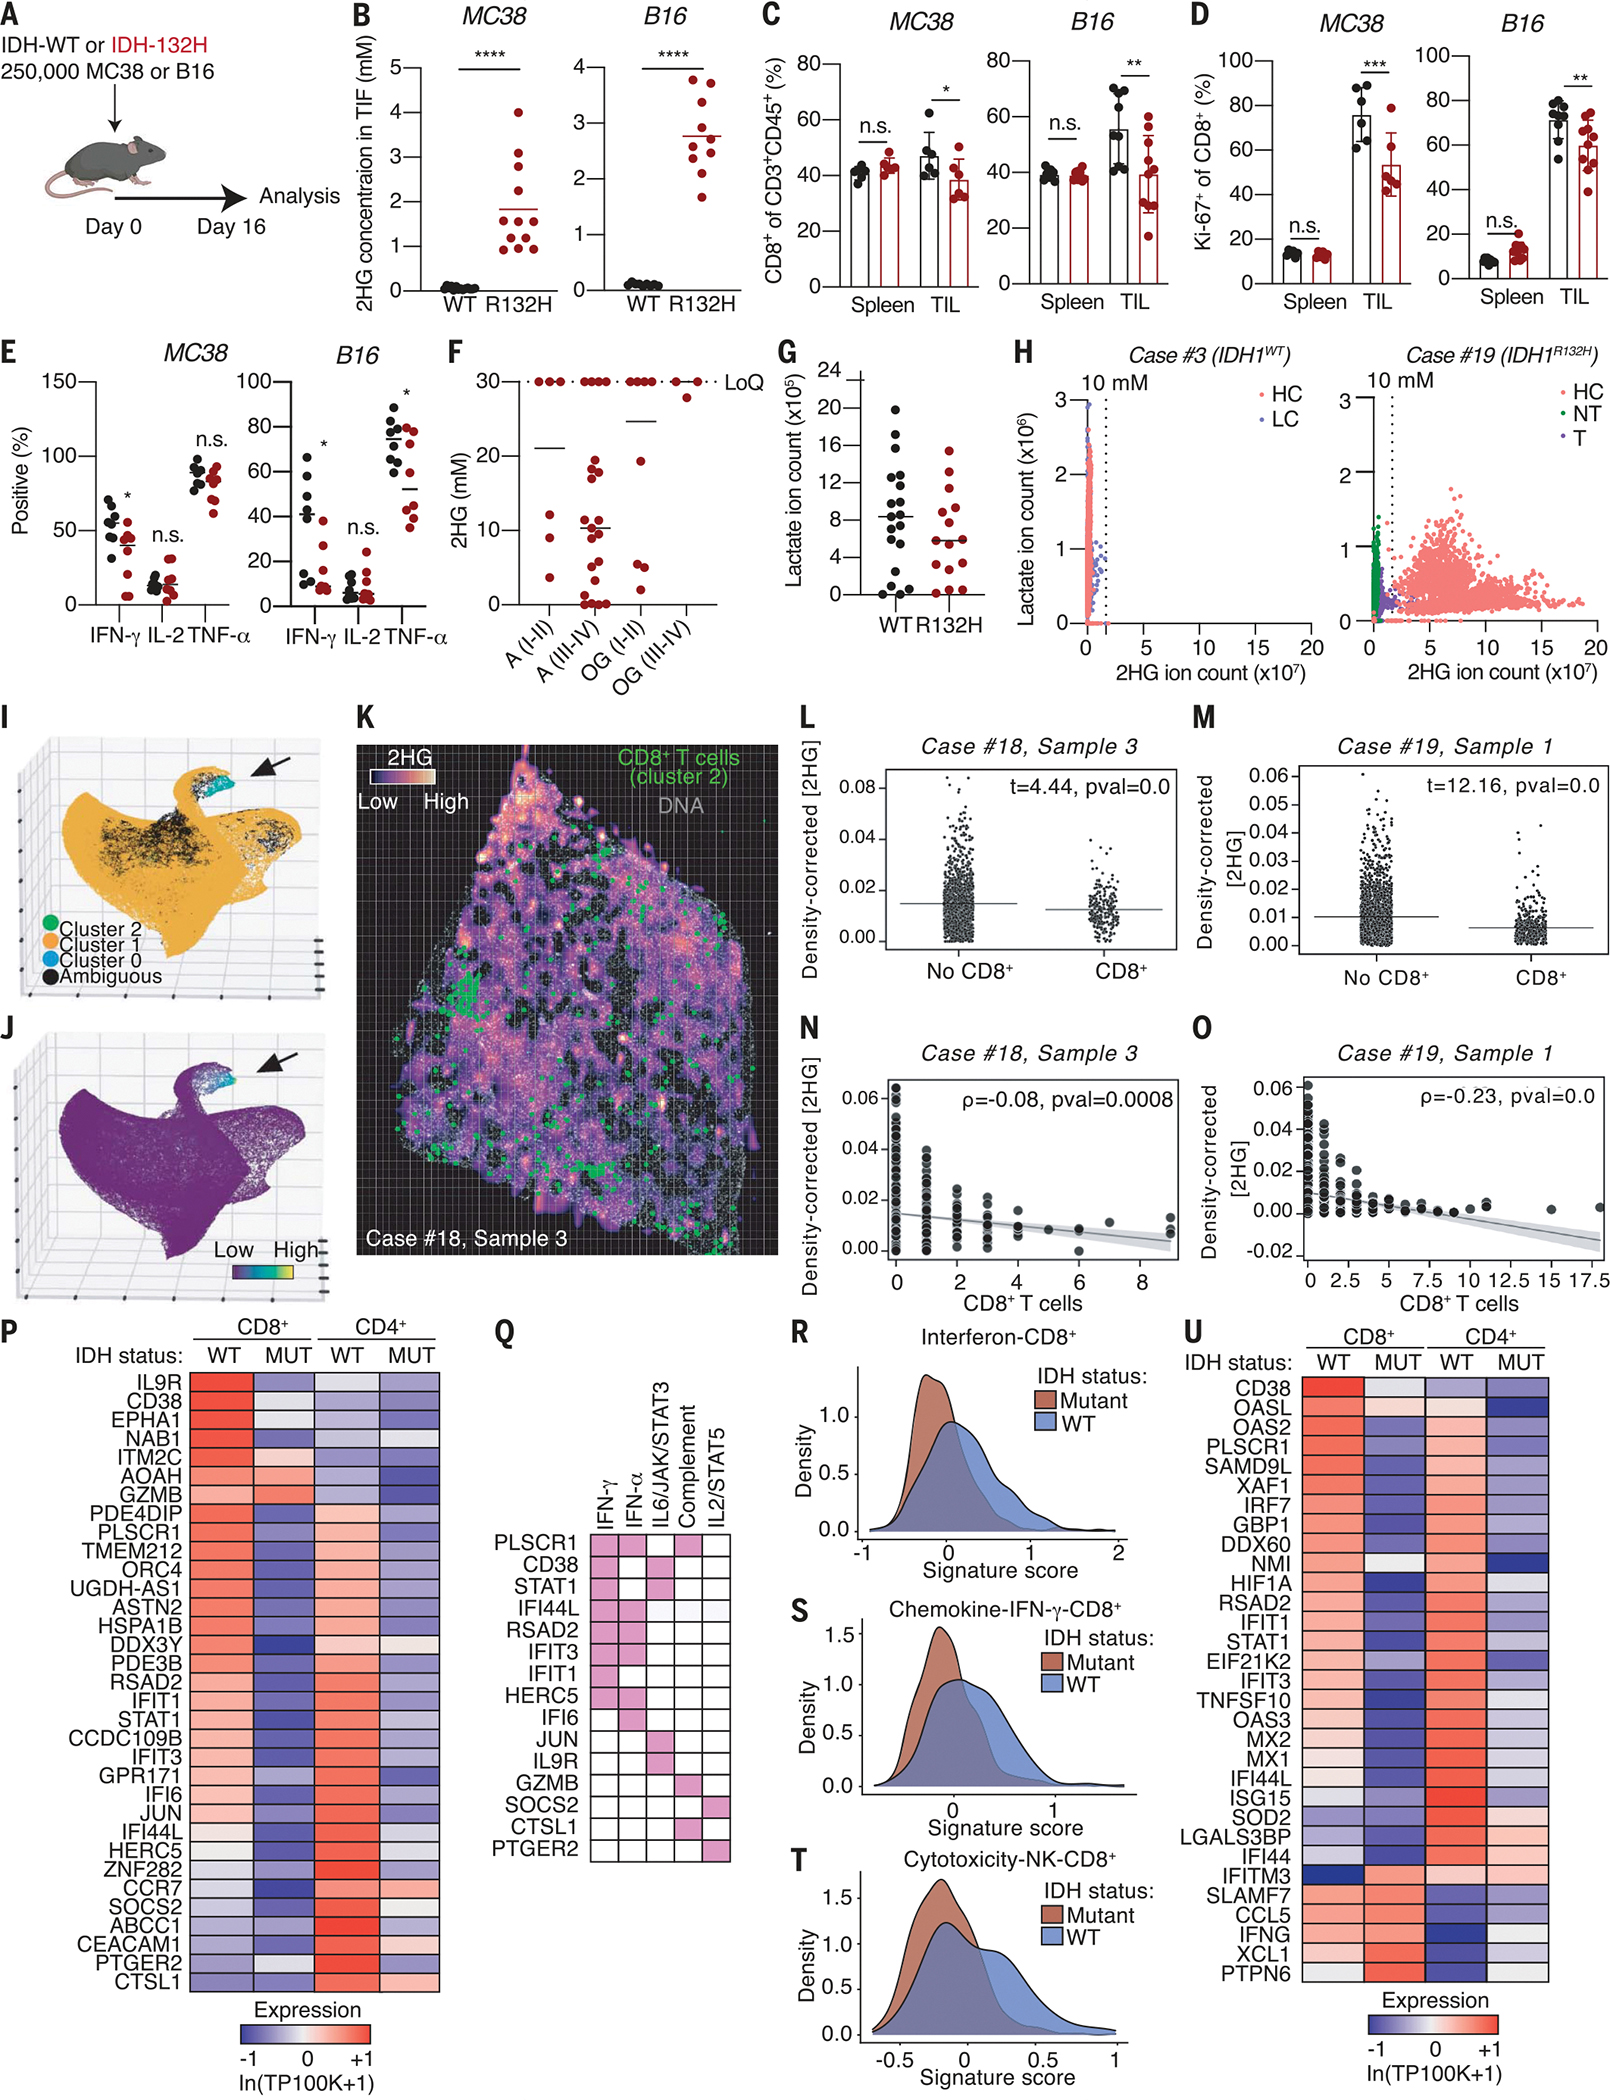
Gain-of-function mutations in isocitrate dehydrogenase (IDH) in human cancers result in the production of d-2-hydroxyglutarate (d-2HG), an oncometabolite that promotes tumorigenesis through epigenetic alterations. The cancer cell-intrinsic effects of d-2HG are well understood, but its tumor cell-nonautonomous roles remain poorly explored. We compared the oncometabolite d-2HG with its enantiomer, l-2HG, and found that tumor-derived d-2HG was taken up by CD8+ T cells and altered their metabolism and antitumor functions in an acute and reversible fashion. We identified the glycolytic enzyme lactate dehydrogenase (LDH) as a molecular target of d-2HG. d-2HG and inhibition of LDH drive a metabolic program and immune CD8+ T cell signature marked by decreased cytotoxicity and impaired interferon-γ signaling that was recapitulated in clinical samples from human patients with IDH1 mutant gliomas.


Conflict of interest statement

Competing interests: M.H. received research funding from Agilent Technologies and Roche Pharmaceuticals and is on advisory boards for Alixia and Minovia. M.L.S. and K.W.W. are equity holders, scientific cofounders, and advisory board members of Immunitas Therapeutics. K.W.W. serves on the scientific advisory board of TCR2 Therapeutics, T-Scan Therapeutics, SQZ Biotech, and Nextechinvest and receives sponsored research funding from Novartis. N.Y.R.A. is key opinion leader for Bruker Daltonics, scientific adviser to Invicro, and receives support from Thermo Finnegan and EMD Serono. A.H.S. has patents and/or pending royalties on the PD-1 pathway from Roche and Novartis. A.H.S. is on advisory boards for Surface Oncology, SQZ Biotechnologies, Elpiscience, Selecta, Bicara, Monopteros, Fibrogen, Alixia, GlaxoSmithKline, and Janssen. A.H.S. has received research funding from Merck, Vertex, Moderna, Quark/Iome, and AbbVie unrelated to this project. The remaining authors declare no competing interests.

Figures

Fig. 1.
Fig. 1.. d-2HG impairs CD8+ T cell proliferation, cytotoxicity, and IFN-γ signaling in an acute and reversible fashion.
(A) Total 2HG levels in activated CD8+ T cells after 24-hour treatment with increasing concentrations of d-2HG or l-2HG. Total ion count was normalized to cell number (n = 3). (B) Intracellular 2HG concentration determined by assuming a T cell volume of 500 fl (n = 3). (C) Left: CellTrace Violet dilution assay at day 3 of CD8+ T cells activated by CD3/CD28 mAbs in the presence of 20 mM d-2HG, 20 mM l-2HG, or left untreated. Stained, naive cells (shaded gray) that did not proliferate are shown. Right: Division index corresponds to the average number of cell divisions that a cell in the total cell population has undergone (n = 3). (D) CellTrace Violet dilution assay according to experimental design described in fig. S1E to assess reversibility of proliferation phenotype. (E) Schematic of a cytotoxic CD8+ T cell releasing granzyme B and IFN-γ. (F) Intracellular granzyme B levels of CD8+ T cells activated by CD3/CD28 mAbs in the presence of 20 mM d-2HG, 20 mM l-2HG, or left untreated for 3 days. (G) Percentage degranulation as assessed by CD107a/b staining of CD8+ T cells activated by CD3/CD28 mAbs and restimulated by CD3 mAb in the presence of 20 mM d-2HG, 20 mM l-2HG, or left untreated. In the washout condition, CD8+ T cells were activated in the presence of 20 mM d-2HG, and the oncometabolite was subsequently washed out before restimulation. In the acute condition, d-2HG was added solely at the time of restimulation. In all other conditions, the metabolites were kept for the entirety of the assay (n = 3). (H) Percentage of IFN-γ+ CD8+ T cells after intracellular cytokine staining of CD8+ T cells activated with phorbol myristate acetate (PMA) and ionomycin for 4 hours in the presence of 20 mM d-2HG, 20 mM l-2HG, or left untreated (n = 3). (I) Mean fluorescent intensity for IFN-γ after intracellular cytokine staining of CD8+ T cells activated with PMA and ionomycin for 4 hours in the presence of 20 mM d-2HG, 20 mM l-2HG, or left untreated (n = 3). (J) IFN-γ levels in the medium of CD8+ T cells activated with 20 mM d-2HG, 20 mM l-2HG, or left untreated for 24 hours (n = 3). (K) Volcano plot showing distribution of the top down-regulated and up-regulated genes in CD8+ T cells activated in the presence of 20 mM d-2HG or left untreated. Statistically significant ISGs with a fold change >1.5 are marked in pink (n = 3). (L) Antigen-specific killing of B16 ovalbumin-positive tumor cells by OT1 CD8+ T cells that were activated in the presence of 20 mM d-2HG, 20 mM l-2HG, or left untreated. In the washout condition, d-2HG was removed before co-culture seeding of tumor cells and T cells. In the acute condition, d-2HG was added at the time of tumor cell and T cell co-culture. In all other conditions, the metabolites were kept for the entirety of the assay (n = 3). *P < 0.05, **P < 0.01, ***P < 0.001, ****P < 0.0001 (one-way and two-way ANOVA). Data are representative of at least two independent experiments.
Fig. 2.
Fig. 2.. d-2HG alters glycolysis in CD8+ T cells.
(A) Schematic of experimental design to assess the acute (24 hours) effects of 20 mM d-2HG and 20 mM l-2HG on steady-state metabolite levels in activated CD8+ T cells. (B) Log2 fold changes of glycolytic intermediates in 20 mM d-2HG–treated versus 20 mM l-2HG–treated CD8+ T cells relative to control. F6P, fructose 6-phosphate; G6P, glucose 6-phosphate; DHAP, dihydroxyacetone phosphate; GA3P, glyceraldehyde 3-phosphate; PEP, phosphoenolpyruvic acid (n = 3). (C) Log2 fold changes of key glycolytic metabolites that are secreted into or consumed from the medium of d-2HG–treated, l-2HG–treated, or untreated CD8+ T cells (n = 3). (D) Schematic of expected incorporation of heavy carbons into glycolytic intermediates after 13C6 glucose is provided for 24 hours. (E) Ion intensities of glycolytic intermediates and their respective 13C-isotopologs after 24-hour cotreatment of 13C6 glucose with 20 mM d-2HG, 20 mM l-2HG, or control (n = 3). (F) Levels of secreted pyruvate isotopologs in the medium of 20 mM d-2HG–treated, 20 mM l-2HG–treated, and untreated CD8+ T cells after providing 13C6 glucose for 24 hours (n = 3). (G) Levels of secreted lactate isotopologs in the medium of 20 mM d-2HG–treated, 20 mM l-2HG–treated, and untreated CD8+ T cells after providing 3C6 glucose for 24 hours (n = 3). *P < 0.05, **P < 0.01, ***P < 0.001, ****P < 0.0001 (two-way ANOVA). Data are representative of at least two independent experiments.
Fig. 3.
Fig. 3.. d-2HG inhibits LDH-A activity in vitro and in CD8+ T cells.
(A) Schematic of LDH reaction. (B) Intracellular lactate (M+3)/pyruvate (M+3) ratio of CD8+ T cells after 24-hour cotreatment of 13C6 glucose with 20 mM d-2HG or control (n = 3). (C) Schematic of the metabolic consequences of antimycin A (AA) treatment on glucose catabolism. (D) Intracellular lactate (M+3)/pyruvate (M+3) ratio after brief 20 mM d-2HG pretreatment, followed by AA and 13C6 glucose cotreatment (n = 3). Solid bars, −AA; striped bars, +AA. (E) In vitro enzymatic assessment of 3 mM l-2HG, 3 mM d-2HG, 80 μM oxamate, and 10 nM GSK2837808A on LDH-A activity. Oxamate and GSK2837808A are known LDH inhibitors and were used as a control (n = 3). (F) Lineweaver-Burk plot for d-2HG. (G) NAD+/NADH ratio of CD8+ T cells treated for 24 hours with control, 1 mM nicotinamide mononucleotide (NMN), 20 mM d-2HG, or 20 mM l-2HG. NMN raises intracellular NAD+ levels and was therefore used as a positive control (n = 3). *P < 0.05, **P < 0.01, ***P < 0.001, ****P < 0.0001 (Student’s t test, one-way and two-way ANOVA). Data are representative of at least two independent experiments.
Fig. 4.
Fig. 4.. Cytosolic NAD(H) imbalance drives mitochondrial membrane hyperpolarization in d-2HG–treated CD8+ T cells.
(A) Relative contribution of mitochondrial oxidative phosphorylation and glycolysis to ATP production in response to d-2HG after 24 hours of treatment (n = 10). (B) Quantification of basal respiration in response to 20 mM d-2HG after 24 hours of treatment (n = 10). (C) Mitochondrial membrane potential as assessed by tetramethylrhodamine ethyl ester (TMRE) fluorescence in CD8+ T cells treated with 20 mM d-2HG, 20 mM l-2HG, or control for 3 days. (D) TMRE assay according to experimental design described in fig. S4F. (E) Mitochondrial membrane potential as assessed by TMRE fluorescence in CD8+ T cells treated with 20 mM d-2HG, 20 mM l-2HG, or control for 2 hours. (F) Schematic of targets of rotenone, AA, oligomycin, and FCCP. (G) Effects of inhibition of ETC complexes on mitochondrial membrane potential in control and d-2HG–treated CD8+ T cells (n = 3). (H) Quantification of spare respiratory capacity in response to 20 mM d-2HG after 24 hours of treatment (n = 10). (I) Schematic of targets of AOA. (J) Mitochondrial membrane potential as assessed by TMRE fluorescence in CD8+ T cells treated with 20 mM d-2HG or control for 24 hours in the presence or absence of 1 mM AOA (n = 3). (K) Schematic of LbNOX mechanism of action. (L) Western blot of CD8+ T cells overexpressing empty vector (EV) or FLAG-tagged cytosolic LbNOX. (M) NAD+/NADH ratio of CD8+ T cells overexpressing EV or cytosolic LbNOX after a 24-hour-long treatment with 20 mM d-2HG or control (n = 3). (N) TMRE staining of EV or LbNOX-overexpressing CD8+ T cells treated with 20 mM d-2HG or left untreated for 24 hours (n = 3). (O) Schematic of the target of rotenone. (P) Quantification of division index of CD8+ T cells activated in the presence or absence of 20 mM d-2HG for 3 days and cotreated with 1 nM rotenone (n = 3). (Q) Quantification of intracellular ROS levels as assessed by CellROX staining in CD8+ T cells treated with 20 mM d-2HG or left untreated for 1 day. Hydrogen peroxide (H2O2, 100 mM) and 10 mM NAC were used as positive and negative controls, respectively (n = 3). *P < 0.05, **P < 0.01, ***P < 0.001, ****P < 0.0001 (Student’s t test, one-way and two-way ANOVA). Data are representative of at least two independent experiments.
Fig. 5.
Fig. 5.. LDH inhibition recapitulates the effects of d-2HG on CD8+ T cell metabolism, proliferation, cytotoxicity, and IFN-γ signaling.
(A) Lactate (M+3)/pyruvate (M+3) ratio in CD8+ T cells treated with 20 mM d-2HG, 20 mM oxamate, 10 μM GSK2837808A, or left untreated for 24 hours (n = 3). (B) NAD+/NADH ratio of CD8+ T cells after a 24-hour-long treatment with 20 mM d-2HG, 20 mM oxamate, 10 μM GSK2837808A, or control (n = 3). (C) Quantification of basal respiration in response to 20 mM d-2HG, 20 mM oxamate, 10 μM GSK2837808A, or control after 24 hours of treatment (n = 10). (D) Left: Mitochondrial membrane potential as assessed by TMRE fluorescence in CD8+ T cells treated with 20 mM d-2HG, 20 mM oxamate, 10 μM GSK2837808A, or control for 24 hours. Right: quantification of mean fluorescence intensity for TMRE (n = 3). (E) Left: CellTrace Violet dilution assay at day 3 of CD8+ T cells activated in the presence of 20 mM d-2HG, 20 mM oxamate, 10 μM GSK2837808A, or left untreated. Right: quantification of division index (n = 3). (F) Quantification of intracellular granzyme B expression in CD8+ T cells activated in the presence of 20 mM d-2HG, 20 mM oxamate, 10 μM GSK2837808A, or control for 3 days (n = 3). (G) Percentage degranulation assessed by CD107a/b staining in CD8+ T cells activated in the presence of 20 mM d-2HG, 20 mM oxamate, 10 μM GSK2837808A, or left untreated (n = 3). (H) Percentage of IFN-γ+ CD8+ T cells after intracellular cytokine staining of CD8+ T cells activated with PMA and ionomycin for 4 hours in the presence of 20 mM d-2HG, 20 mM oxamate, 10 μM GSK2837808A, or left untreated (n = 3). (I) Mean fluorescent intensity for IFN-γ after intracellular cytokine staining of CD8+ T cells activated with PMA and ionomycin for 4 hours in the presence of 20 mM d-2HG, 20 mM oxamate, 10 μM GSK2837808A, or left untreated (n = 3). (J) Cell number–normalized levels of IFN-γ in the cell culture medium of CD8+ T cells activated in the presence of 20 mM d-2HG, 20 mM oxamate, 10 μM GSK2837808A, or control for 2 days (n = 3). (K) Relative mRNA expression of ISGs in CD8+ T cells activated in the presence of 20 mM d-2HG, 20 mM oxamate, 10 μM GSK2837808A, or control for 24 hours (n = 3). (L) Specific killing of B16 ovalbumin-positive tumor cells by OT1 CD8+ T cells activated in the presence of 20 mM d-2HG, 20 mM oxamate, 10 μM GSK2837808A, or control (n = 3). *P < 0.05, **P < 0.01, ***P < 0.001, ****P < 0.0001 (one-way ANOVA). Data are representative of at least two independent experiments.
Fig. 6.
Fig. 6.. Altered metabolic and cytotoxicity signatures in IDH1-mutant relative to IDH1WT cancers.
(A) Schematic depicting experimental setup. (B) Quantification of 2HG levels by liquid chromatography–mass spectrometry in the tumor interstitial fluid (TIF) from IDH1WT and IDH1R132H MC38 and B16 tumors (n = 10 to 12). (C) Quantification of the percentage of CD8+ T cells (of CD3+CD45+ cells) in spleen and tumor of IDH1WT and IDH1R132H MC38 and B16 syngeneic tumor mouse models (n = 6 to 10). (D) Quantification of the percentage of Ki67+ CD8+ T cells in spleen and tumor of IDH1WT and IDH1R132H MC38 and B16 syngeneic tumor mouse models (n = 6 to 10). (E) Quantification of the percentage of IFN-γ+, IL-2+, and TNF-α+CD8+ T cells isolated from IDH1WT or IDH1R132H MC38 or B16 tumors on day 16 after inoculation and after ex vivo restimulation with PMA and ionomycin for 4 hours in the presence of 0 or 2.5 mM d-2HG to recapitulate the 2HG levels measured in the TIF (n = 8). (F) MSI-based quantification of 2HG levels in tissue sections of human IDH1R132H gliomas subdivided by grade. The upper limit of 2HG quantification based on the calibration curve was 30 mM; therefore, any value beyond that was collapsed to 30 mM. A, astrocytoma; OD, oligodendroglioma; I-II, low-grade; III-IV, high-grade. (G) Per-section average lactate ion counts across IDH1WT GBM (n = 5) and IDH1R132H (n = 4) astrocytoma, grade IV patients. (H) Per-pixel lactate and 2HG ion counts across all sections from case #3, an IDH1WT GBM patient, and case #19, an IDH1R132H glioma patient. Sections were annotated based on high cellularity (HC), low cellularity (LC), nontumor (NT), and transition (T). (I) Three-dimensional (3D) UMAP embedding of single-cell CyCIF data derived from human brain tumor sections colored by HDBSCAN cluster identifying a population of CD8+ T cells (cluster 2, black arrow). (J) 3D UMAP embedding color mapped according to CD8 signal intensity showing that cluster 2 cells (black arrow) are characterized by high levels of CD8 expression. (K) Overlay of matched MSI and CyCIF images from case #18, sample 3 of an IDH1R132H astrocytoma. Spatial positions of cluster 2 cells are shown in green; Hoechst nuclear dye (DNA) is shown in gray. Grid superimposed on the image shows equal-sized microregions of tissue with x and y intervals corresponding to the pixel size of the original MSI image used to compute statistics in (L) and (M). (L) Welch’s t tests comparing mean tissue density–corrected d-2HG levels in microregions of tissue with and without CD8+ T cells in case #18, sample 3. (M) Welch’s t tests comparing mean tissue density–corrected d-2HG levels in microregions of tissue with and without CD8+ T cells in case #19, sample 1. (N) Spearman’s rank-order correlation showing anticorrelation between mean tissue density-corrected d-2HG levels and CD8+ T cell counts in microregions of tissue in case #18, sample 3. (O) Spearman’s rank-order correlation showing anticorrelation between mean tissue density–corrected d-2HG levels and CD8+ T cell counts in microregions of tissue in case #19, sample 1. (P) Heatmap showing expression of top DE up-regulated genes in CD8+ and CD4+ T cells in IDHWT GBM relative to IDH-mutant gliomas. Gene expression is zero-centered and given in units of ln(TP100K+1). (Q) Grouping of the top up-regulated genes into hallmark gene sets. (R) Density plot of expression of top DE up-regulated genes in the IFN subcluster for CD8+ T cells in IDHWT and IDH-mutant samples. (S) Density plot of expression of the top DE up-regulated CD8+ IDHWT genes in the chemokine–IFN-γ subcluster for T cells in and IDH-mutant samples. (T) Density plot of expression of the top DE up-regulated genes in cytotoxicity-NK subcluster for CD8+ T cells in IDHWT and IDH-mutant samples. (U) Overlay of the top DE ISGs from mouse RNA sequencing onto the top 400 DE up-regulated genes in the CD4+ and CD8+ T cell populations of IDH-mutant and IDHWT tumors showing the relative expression of genes in common between the two datasets. *P < 0.05, **P < 0.01, ***P < 0.001, ****P < 0.0001 (Student’s t test and two-way ANOVA). Data are representative of at least two independent experiments.

Comment in

References

    1. Ryan DG et al., Nat. Metab 1, 16–33 (2019). - PMC - PubMed
    1. Choi C et al., Nat. Med 18, 624–629 (2012). - PMC - PubMed
    1. Dang L et al., Nature 462, 739–744 (2009). - PMC - PubMed
    1. Losman JA, Kaelin WG Jr.., Genes Dev 27, 836–852 (2013). - PMC - PubMed
    1. Andronesi OC et al., Sci. Transl. Med 4, 116ra4 (2012). - PMC - PubMed

MeSH terms