. 2022 Sep 29;18(9):e1010579.
doi: 10.1371/journal.pcbi.1010579. eCollection 2022 Sep.

Modeling enculturated bias in entrainment to rhythmic patterns

Affiliations

Modeling enculturated bias in entrainment to rhythmic patterns

Thomas Kaplan et al. PLoS Comput Biol. .

Abstract

Long-term and culture-specific experience of music shapes rhythm perception, leading to enculturated expectations that make certain rhythms easier to track and more conducive to synchronized movement. However, the influence of enculturated bias on the moment-to-moment dynamics of rhythm tracking is not well understood. Recent modeling work has formulated entrainment to rhythms as a formal inference problem, where phase is continuously estimated based on precise event times and their correspondence to timing expectations: PIPPET (Phase Inference from Point Process Event Timing). Here we propose that the problem of optimally tracking a rhythm also requires an ongoing process of inferring which pattern of event timing expectations is most suitable to predict a stimulus rhythm. We formalize this insight as an extension of PIPPET called pPIPPET (PIPPET with pattern inference). The variational solution to this problem introduces terms representing the likelihood that a stimulus is based on a particular member of a set of event timing patterns, which we initialize according to culturally-learned prior expectations of a listener. We evaluate pPIPPET in three experiments. First, we demonstrate that pPIPPET can qualitatively reproduce enculturated bias observed in human tapping data for simple two-interval rhythms. Second, we simulate categorization of a continuous three-interval rhythm space by Western-trained musicians through derivation of a comprehensive set of priors for pPIPPET from metrical patterns in a sample of Western rhythms. Third, we simulate iterated reproduction of three-interval rhythms, and show that models configured with notated rhythms from different cultures exhibit both universal and enculturated biases as observed experimentally in listeners from those cultures. These results suggest the influence of enculturated timing expectations on human perceptual and motor entrainment can be understood as approximating optimal inference about the rhythmic stimulus, with respect to prototypical patterns in an empirical sample of rhythms that represent the music-cultural environment of the listener.


Conflict of interest statement

The authors have declared that no competing interests exist.

Figures

Fig 1
Fig 1. Perceptual bias in entrainment.
Entrainment to an auditory rhythm through synchronized movement reveals a biased response, as in Bayesian inference, towards a listener’s perceptual priors [24, 25]. If a listener does not have enculturated familiarity with musical rhythms related by the ratios 2:2:3, they are likely to interpret a rhythm (approximately) related by these ratios as 1:1:2, and this will be reflected in synchronized movements that are in fact closer to ratios 1:1:2 than 2:2:3.
Fig 2
Fig 2. PIPPET expectation template.
An expectation template in PIPPET, as defined in Eq (1), represents the instantaneous rate of events λ(ϕ) at phase ϕ of the underlying process. Expectations for specific events are each represented by a Gaussian centered at the respective phase ϕi, with variance vi representing the precision of the expectation, and scaling factor λi representing the strength of expectations. The constant λ0 accounts for the rate of events unrelated to phase, i.e. background noise.
Fig 3
Fig 3. Two- and three-interval rhythms.
A) Simple two-interval rhythms of ratios 1:1, 2:1 and 4:3, with a 1000ms period. B) Three-interval rhythm space, where each axis of the ternary plot refers to one of the three intervals in a rhythm. Each point corresponds to a three-interval rhythm of period 2000ms, with each interval constrained to a minimum duration of 300ms. The crosses denote some examples of rhythms related by small-integer ratios (e.g. 1:1:1 and 2:1:1, shown to the left).
Fig 4
Fig 4. Tracking the phase of a 4:3 rhythm with different timing expectations.
Two pPIPPET models are given patterns of expectations for 1:1 and 2:1 rhythms, but only one with expectations for 4:3 rhythms. The resulting quality of phase tracking—for the first two stimulus repetitions—is shown through adjustments to estimated phase μt on auditory events, alongside changes in uncertainty Vt. Implicit inference of the rhythmic pattern over time is shown through changes in template probability pm. A) European model. Without 4:3 expectations, phase must be adjusted after the first event of each cycle to compensate for the timing shift, causing phase uncertainty to increase until the cycle is complete, when phase is shifted back. B) Malian model. Phase is successfully tracked, with phase uncertainty only growing slightly between events. Note that phase uncertainty always accumulates between events due to expected phase noise (see Methods, σ in Eq 2).
Fig 5
Fig 5. Production bias when tracking 1:1, 4:3 and 2:1 rhythms.
Performance of pPIPPET in tracking repeating two-interval rhythms, depending on template configuration. A) Distribution of phase corrections following the first interval of the 4:3 stimulus rhythm. Curves are Gaussian kernel density estimates, vertical black dashed line shows an unbiased response, and other vertical dashed lines refer to sample means. B) Phase uncertainty on the time step preceding an auditory event. Error bars show the 95% confidence intervals within each sample. Note that this figure shows qualitative agreement with empirical tapping data shown in [, Fig 3].
Fig 6
Fig 6. Categorization maps for three-interval rhythms.
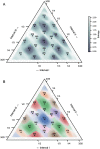
Categorization of three-interval rhythms (pattern duration of 2000ms and minimum interval duration of 300ms) after being presented once, using a pPIPPET filter configured with expectation templates derived from a corpus of German folksongs [46]. Rhythms related by small-integer-ratios (integers less than 3) are marked with crosses and labeled. A) Entropy of the posterior distribution over expectation templates. B) Colors correspond to cyclic permutations of the pattern which has been inferred (i.e. the expectation template which maximizes pm), and transparency the entropy. For comparison, see [, Fig 10b] and [, Fig 13a]. This figure, and other ternary plots presented in this work, were made using the python-ternary package [47].
Fig 7
Fig 7. Simulated iterated reproduction.
Results from the final iteration of all simulated trials, using pPIPPET filters configured with either German folk songs [46] or Turkish makam music [48]. A) Kernel density estimate (KDE) of the underlying data distribution for the German model, using the non-parametric method described in [24], normalized relative to a uniform distribution. B) KDE for the Turkish model. C) Category weights for the two models, obtained by fitting a constrained Gaussian mixture model (GMM), using the modified expectation-maximization procedure described in [25]. Weights for cyclic permutations of each ratio are grouped. Error bars reflect confidence intervals (SD of weights, derived from bootstrapping, N = 250). We draw specific attention to the differences in weights measured for cyclical permutations of the ratios labeled in bold (1:1:1, 1:1:2 and 2:2:3), which relate to differences in the KDE plots at the respective ratios.
Fig 8
Fig 8. Metrical analysis for German and Turkish corpora.
Relative frequency of onset positions (phase, at the resolution of 16th notes) within a metrical cycle of rhythms belonging to a specific meter (time signature). This analysis from [, p. 185] is used with permission.

References

    1. Desain P, Honing H. The Formation of Rhythmic Categories and Metric Priming. Perception. 2003;32(3):341–365. doi: 10.1068/p3370 - DOI - PubMed
    1. Sadakata M, Desain P, Honing H. The Bayesian Way to Relate Rhythm Perception and Production. Music Perception. 2006;23(3):269–288. doi: 10.1525/mp.2006.23.3.269 - DOI
    1. Ullal-Gupta S, Hannon EE, Snyder JS. Tapping to a Slow Tempo in the Presence of Simple and Complex Meters Reveals Experience-Specific Biases for Processing Music. PLoS ONE. 2014;9(7):e102962. doi: 10.1371/journal.pone.0102962 - DOI - PMC - PubMed
    1. Hannon EE, Soley G, Ullal S. Familiarity overrides complexity in rhythm perception: A cross-cultural comparison of American and Turkish listeners. Journal of Experimental Psychology: Human Perception and Performance. 2012;38(3):543–548. - PubMed
    1. Polak R, Jacoby N, Fischinger T, Goldberg D, Holzapfel A, London J. Rhythmic Prototypes Across Cultures. Music Perception. 2018;36(1):1–23. doi: 10.1525/mp.2018.36.1.1 - DOI

Publication types