

Correlation of Sedline-generated variables and clinical signs with anaesthetic depth in experimental pigs receiving propofol
- PMID: 36174080
- PMCID: PMC9522294
- DOI: 10.1371/journal.pone.0275484
Correlation of Sedline-generated variables and clinical signs with anaesthetic depth in experimental pigs receiving propofol
Erratum in
-
Correction: Correlation of Sedline-generated variables and clinical signs with anaesthetic depth in experimental pigs receiving propofol.PLoS One. 2024 Aug 6;19(8):e0308594. doi: 10.1371/journal.pone.0308594. eCollection 2024. PLoS One. 2024. PMID: 39106277 Free PMC article.
Abstract
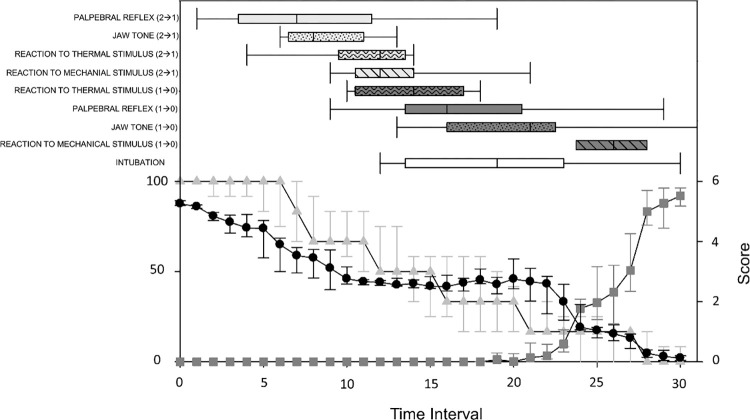
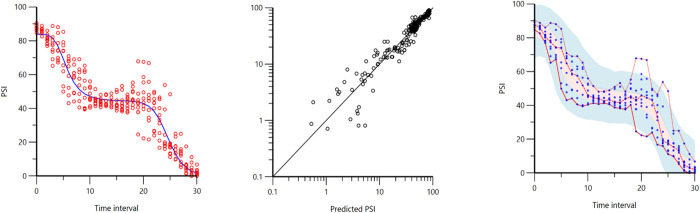
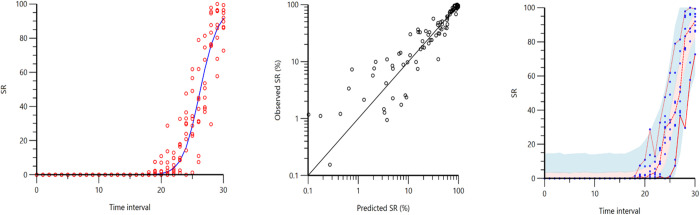
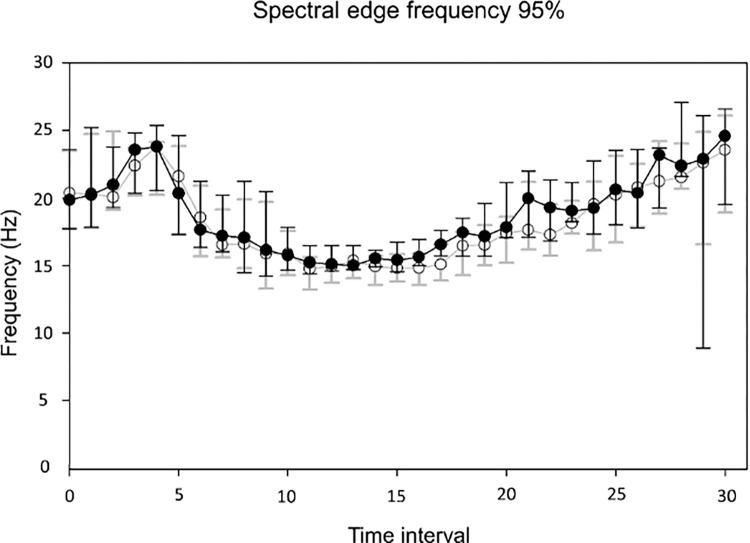
Most of currently available electroencephalographic (EEG)-based tools to assess depth of anaesthesia have not been studied or have been judged unreliable in pigs. Our primary aim was to investigate the dose-effect relationship between increasing propofol dose and variables generated by the EEG-based depth of anaesthesia monitor Sedline in pigs. A secondary aim was to compare the anaesthetic doses with clinical outcomes commonly used to assess depth of anaesthesia in this species. Sixteen juvenile pigs were included. Propofol infusion was administered at 10 mg kg-1 h-1, increased by 10 mg kg-1 h-1 every 15 minutes, and stopped when an EEG Suppression ratio >80% was reached. Patient state index, suppression ratio, left and right spectral edge frequency 95%, and outcomes from commonly used clinical methods to assess depth of anaesthesia in pigs were recorded. The best pharmacodynamic model was assessed for Patient state index, suppression ratio, left and right spectral edge frequency 95% in response to propofol administration. The decrease of Patient state index best fitted to an inhibitory double-sigmoid model (including a plateau phase). The increase of suppression ratio fitted a typical sigmoid Emax model. No relevant relationship could be identified between spectral edge frequency 95% values and propofol administration. A large variability in clinical outcomes was observed among pigs, such that they did not provide a reliable evaluation of propofol dose. The relationship between propofol dose and Patient state index/suppression ratio described in the present study can be used for prediction in future investigations. The evaluation of depth of anaesthesia based on common clinical outcomes was not reliable.
Conflict of interest statement
The authors have declared that no competing interests exist.
Figures
Similar articles
-
Spatio-temporal electroencephalographic power distribution in experimental pigs receiving propofol.PLoS One. 2024 May 14;19(5):e0303146. doi: 10.1371/journal.pone.0303146. eCollection 2024. PLoS One. 2024. PMID: 38743713 Free PMC article.
-
Usability of the SedLine® electroencephalographic monitor of depth of anaesthesia in pigs: a pilot study.J Clin Monit Comput. 2022 Dec;36(6):1635-1646. doi: 10.1007/s10877-022-00807-3. Epub 2022 Jan 20. J Clin Monit Comput. 2022. PMID: 35059913 Free PMC article.
-
How is depth of anaesthesia assessed in experimental pigs? A scoping review.PLoS One. 2023 Mar 23;18(3):e0283511. doi: 10.1371/journal.pone.0283511. eCollection 2023. PLoS One. 2023. PMID: 36952576 Free PMC article.
-
Sedline® Miscalculation of Depth of Anaesthesia Variables in Two Pigs Due to Electrocardiographic Signal Contamination.Animals (Basel). 2023 Aug 23;13(17):2699. doi: 10.3390/ani13172699. Animals (Basel). 2023. PMID: 37684963 Free PMC article.
-
Bispectral index for improving intraoperative awareness and early postoperative recovery in adults.Cochrane Database Syst Rev. 2019 Sep 26;9(9):CD003843. doi: 10.1002/14651858.CD003843.pub4. Cochrane Database Syst Rev. 2019. PMID: 31557307 Free PMC article.
Cited by
-
Spatial and temporal frequency band changes during infarct induction, infarct progression, and spreading depolarizations in the gyrencephalic brain.Front Neurosci. 2022 Dec 5;16:1025967. doi: 10.3389/fnins.2022.1025967. eCollection 2022. Front Neurosci. 2022. PMID: 36570832 Free PMC article.
-
Quantitative Variables Derived from the Electroencephalographic Signal to Assess Depth of Anaesthesia in Animals: A Narrative Review.Animals (Basel). 2025 Aug 5;15(15):2285. doi: 10.3390/ani15152285. Animals (Basel). 2025. PMID: 40805076 Free PMC article. Review.
-
Dexmedetomidine Sedation in Dogs: Impact on Electroencephalography, Behavior, Analgesia, and Antagonism with Atipamezole.Vet Sci. 2024 Feb 6;11(2):74. doi: 10.3390/vetsci11020074. Vet Sci. 2024. PMID: 38393092 Free PMC article.
-
The neurophysiological effect of mild hypothermia in gyrencephalic brains submitted to ischemic stroke and spreading depolarizations.Front Neurosci. 2024 Mar 14;18:1302767. doi: 10.3389/fnins.2024.1302767. eCollection 2024. Front Neurosci. 2024. PMID: 38567280 Free PMC article.
-
Spatio-temporal electroencephalographic power distribution in experimental pigs receiving propofol.PLoS One. 2024 May 14;19(5):e0303146. doi: 10.1371/journal.pone.0303146. eCollection 2024. PLoS One. 2024. PMID: 38743713 Free PMC article.
References
-
- Commission European. Seventh Report on the Statistics on the Number of Animals used for Experimental and other Scientific Purposes in the Member States of the European Union. 2013; 1–40. doi: 10.1017/CBO9781107415324.004 - DOI
-
- Haga HA, Tevik A, Moerch H. Electroencephalographic and cardiovascular indicators of nociception during isoflurane anaesthesia in pigs. Vet Anaesth Analg. 2001;28: 126–131. Available: https://ovidsp.ovid.com/ovidweb.cgi?T=JS&CSC=Y&NEWS=N&PAGE=fulltext&D=ca... doi: 10.1046/j.1467-2987.2001.00051.x - DOI - PubMed
