

Epidemiological characteristics and spatiotemporal patterns of scrub typhus in Fujian province during 2012-2020
- PMID: 36174105
- PMCID: PMC9553047
- DOI: 10.1371/journal.pntd.0010278
Epidemiological characteristics and spatiotemporal patterns of scrub typhus in Fujian province during 2012-2020
Abstract
Background: Scrub typhus has become a serious public health concern in the Asia-Pacific region including China. There were new natural foci continuously recognized and dramatically increased reported cases in mainland China. However, the epidemiological characteristics and spatiotemporal patterns of scrub typhus in Fujian province have yet to be investigated.
Objective: This study proposes to explore demographic characteristics and spatiotemporal dynamics of scrub typhus cases in Fujian province, and to detect high-risk regions between January 2012 and December 2020 at county/district scale and thereby help in devising public health strategies to improve scrub typhus prevention and control measures.
Method: Monthly cases of scrub typhus reported at the county level in Fujian province during 2012-2020 were collected from the National Notifiable Disease Surveillance System. Time-series analyses, spatial autocorrelation analyses and space-time scan statistics were applied to identify and visualize the spatiotemporal patterns of scrub typhus cases in Fujian province. The demographic differences of scrub typhus cases from high-risk and low-risk counties in Fujian province were also compared.
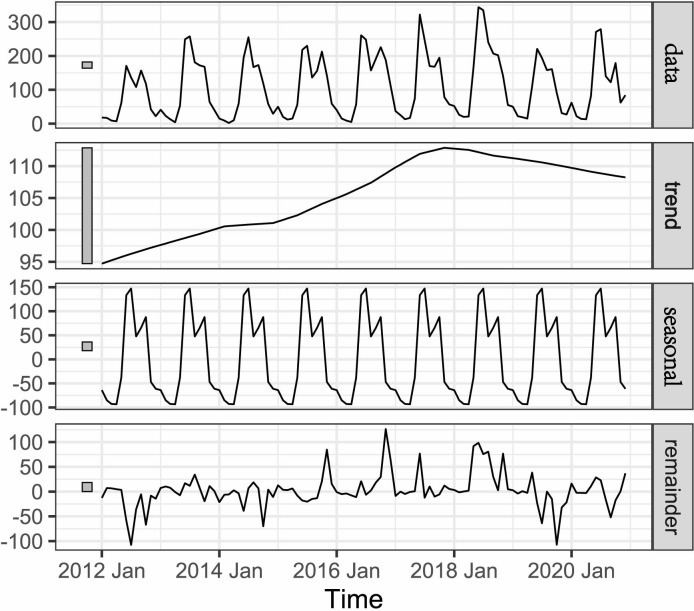
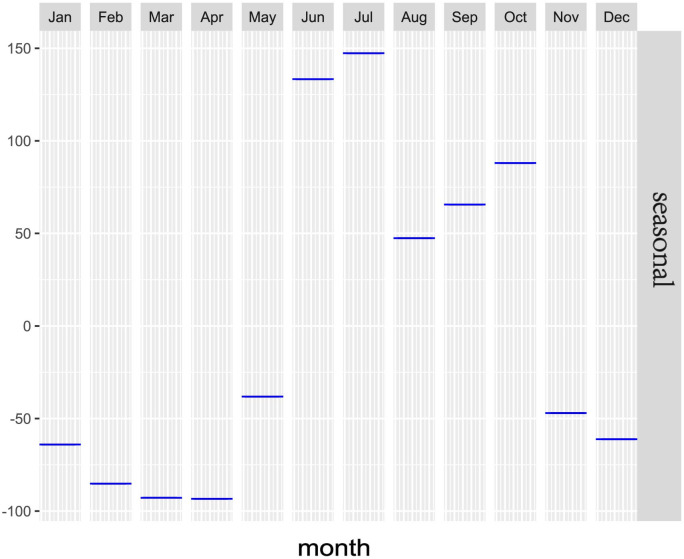
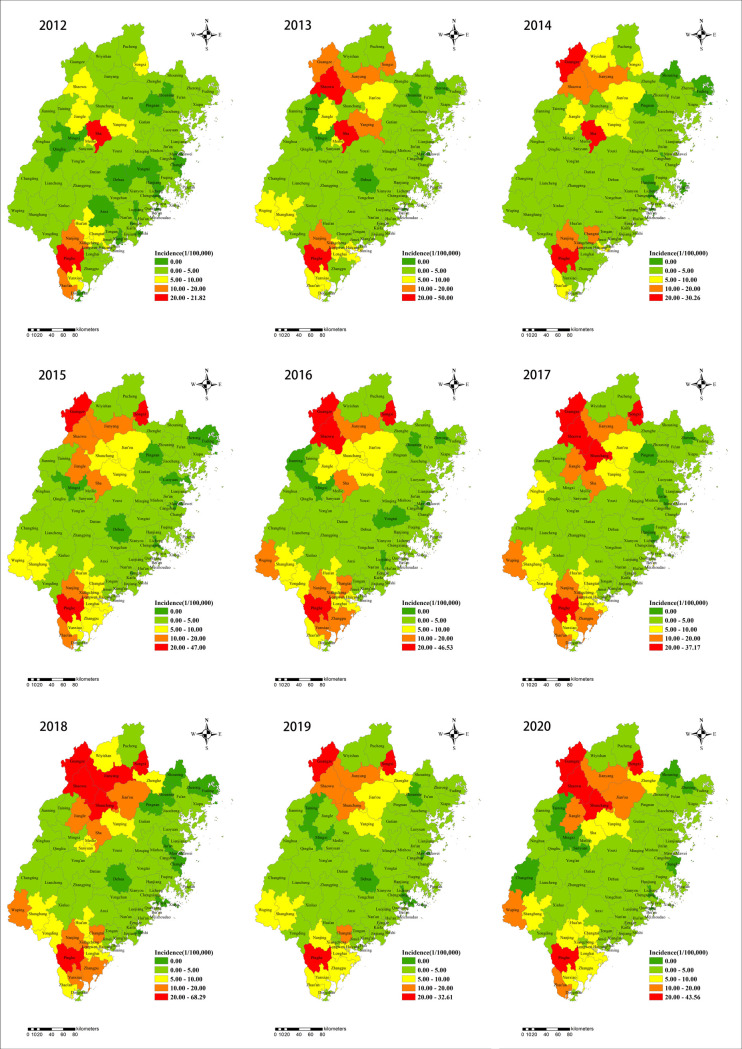
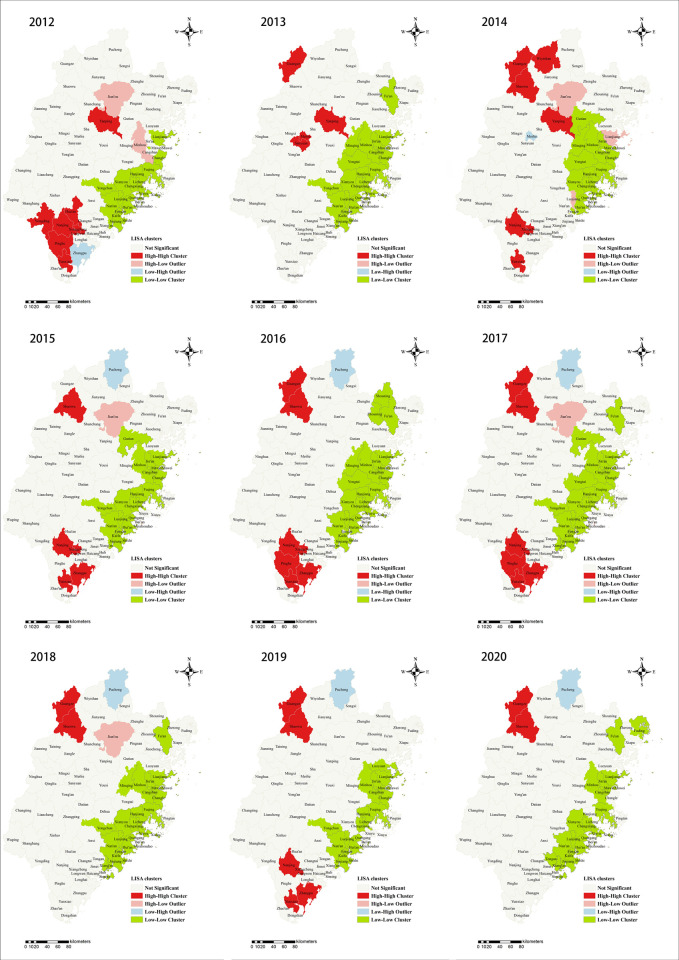
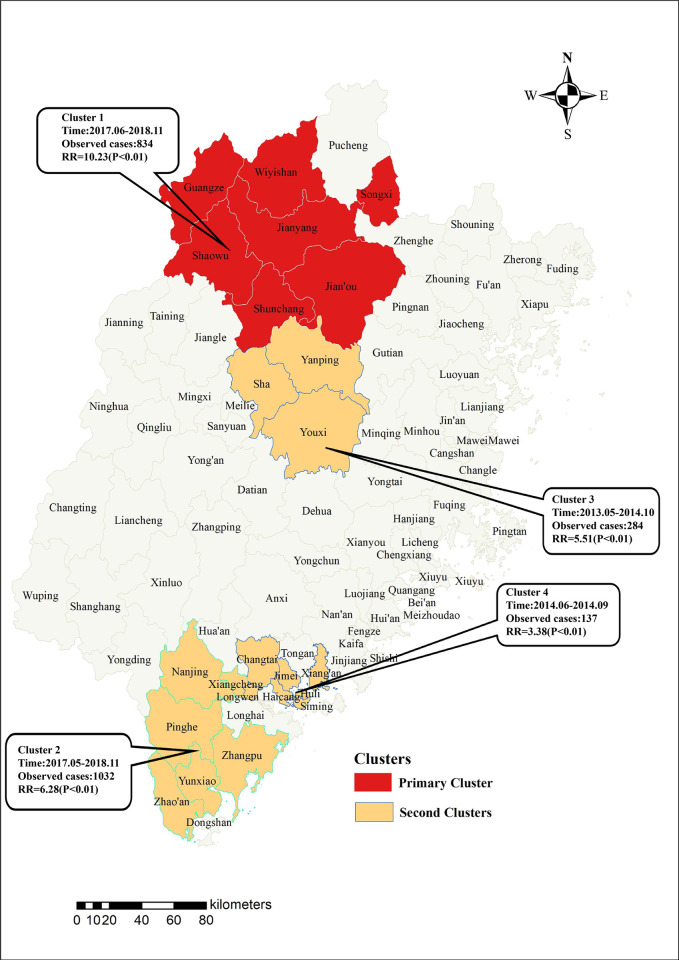
Results: A total of 11,859 scrub typhus cases reported in 87 counties from Fujian province were analyzed and the incidence showed an increasing trend from 2012 (2.31 per 100,000) to 2020 (3.20 per 100,000) with a peak in 2018 (4.59 per 100,000). There existed two seasonal peaks in June-July and September-October every year in Fujian province. A significant positive spatial autocorrelation of scrub typhus incidence in Fujian province was observed with Moran's I values ranging from 0.258 to 0.471 (P<0.001). Several distinct spatiotemporal clusters mainly concentrated in north and southern parts of Fujian province. Compared to low-risk regions, a greater proportion of cases were female, farmer, and older residents in high-risk counties.
Conclusions: These results demonstrate a clear spatiotemporal heterogeneity of scrub typhus cases in Fujian province, and provide the evidence in directing future researches on risk factors and effectively assist local health authorities in the refinement of public health interventions against scrub typhus transmission in the high risk regions.
Conflict of interest statement
The authors have declared that no competing interests exist.
Figures
Similar articles
-
Spatiotemporal Dynamics of Scrub Typhus Transmission in Mainland China, 2006-2014.PLoS Negl Trop Dis. 2016 Aug 1;10(8):e0004875. doi: 10.1371/journal.pntd.0004875. eCollection 2016 Aug. PLoS Negl Trop Dis. 2016. PMID: 27479297 Free PMC article.
-
Spatio-temporal patterns of scrub typhus in mainland China, 2006-2017.PLoS Negl Trop Dis. 2019 Dec 2;13(12):e0007916. doi: 10.1371/journal.pntd.0007916. eCollection 2019 Dec. PLoS Negl Trop Dis. 2019. PMID: 31790406 Free PMC article.
-
Spatiotemporal dynamics and environmental determinants of scrub typhus in Anhui Province, China, 2010-2020.Sci Rep. 2023 Feb 6;13(1):2131. doi: 10.1038/s41598-023-29373-7. Sci Rep. 2023. PMID: 36747027 Free PMC article.
-
Epidemiological analysis and risk prediction of scrub typhus from 2006 to 2021 in Sichuan, China.Front Public Health. 2023 May 30;11:1177578. doi: 10.3389/fpubh.2023.1177578. eCollection 2023. Front Public Health. 2023. PMID: 37325301 Free PMC article. Review.
-
Global and regional seroprevalence, incidence, mortality of, and risk factors for scrub typhus: A systematic review and meta-analysis.Int J Infect Dis. 2024 Sep;146:107151. doi: 10.1016/j.ijid.2024.107151. Epub 2024 Jul 2. Int J Infect Dis. 2024. PMID: 38964725 Free PMC article.
Cited by
-
Epidemiology and spatiotemporal analysis of acute hemorrhagic conjunctivitis in Zhejiang province, China (2004-2023).Front Public Health. 2025 Feb 3;13:1509495. doi: 10.3389/fpubh.2025.1509495. eCollection 2025. Front Public Health. 2025. PMID: 39968230 Free PMC article.
-
Epidemiological Characteristics and Spatiotemporal Cluster Analysis of Scrub Typhus - China, 2006-2023.China CDC Wkly. 2025 Jun 27;7(26):882-888. doi: 10.46234/ccdcw2025.146. China CDC Wkly. 2025. PMID: 40620756 Free PMC article.
-
Estimation of scrub typhus incidence and spatiotemporal multicomponent characteristics from 2016 to 2023 in Zhejiang Province, China.Front Public Health. 2024 Sep 26;12:1359318. doi: 10.3389/fpubh.2024.1359318. eCollection 2024. Front Public Health. 2024. PMID: 39391156 Free PMC article.
-
Epidemiological characteristics and influencing factors of scrub typhus in Jiangxi Province.Parasit Vectors. 2025 Jul 5;18(1):260. doi: 10.1186/s13071-025-06908-7. Parasit Vectors. 2025. PMID: 40618171 Free PMC article.
-
Molecular Detection of Multiple Genotypes of Orientia tsutsugamushi Causing Scrub Typhus in Febrile Patients from Theni District, South India.Trop Med Infect Dis. 2023 Mar 16;8(3):174. doi: 10.3390/tropicalmed8030174. Trop Med Infect Dis. 2023. PMID: 36977175 Free PMC article.
References
Publication types
MeSH terms
LinkOut - more resources
Full Text Sources
