. 2022 Sep;14(5):479-493.
doi: 10.4168/aair.2022.14.5.479.

Epithelial Autoantigen-Specific IgG Antibody Enhances Eosinophil Extracellular Trap Formation in Severe Asthma

Affiliations

Epithelial Autoantigen-Specific IgG Antibody Enhances Eosinophil Extracellular Trap Formation in Severe Asthma

Dong-Hyun Lee et al. Allergy Asthma Immunol Res. 2022 Sep.

Abstract

Purpose: There have been autoimmune mechanisms for the pathogenesis of severe asthma (SA) involving epithelial autoantigen-specific antibodies. This study aimed to find the function of these antibodies in the formation of eosinophil extracellular traps (EETs), contributing to the development of SA.

Methods: Patients with SA (n = 11), those with patients with nonsevere asthma (NSA, n = 41), and healthy controls (HCs, n = 26) were recruited to evaluate levels of epithelial antigens and autoantigen-specific antibodies. Moreover, the significance of epithelial autoantigen-specific antibodies in association with EET production was investigated ex vivo and in vivo.

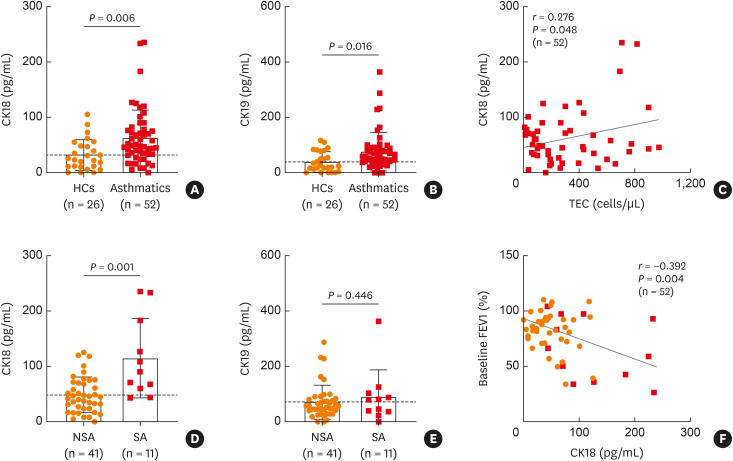
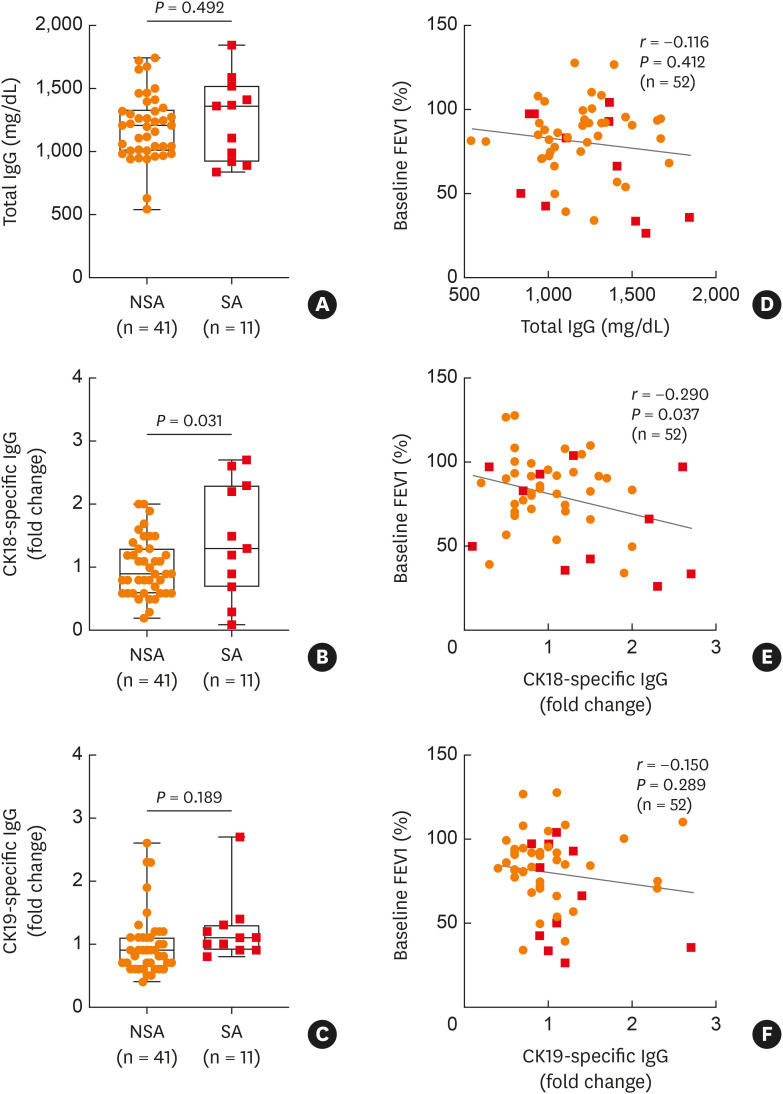
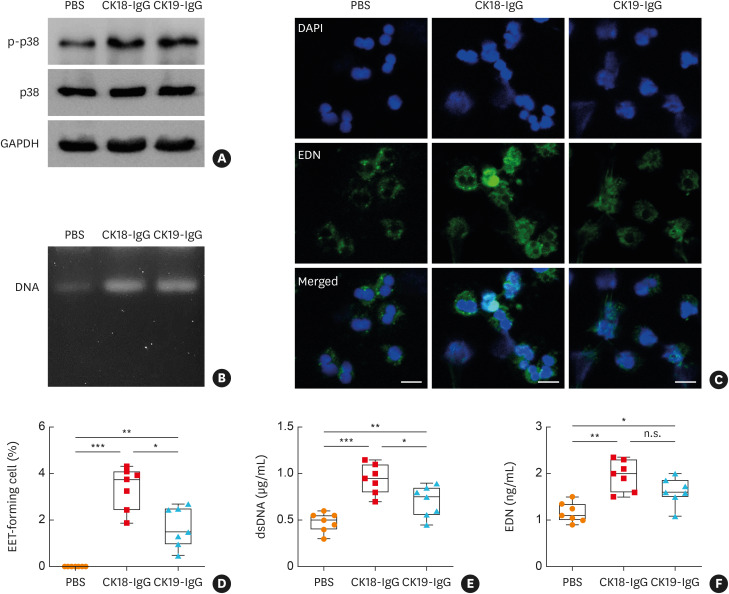
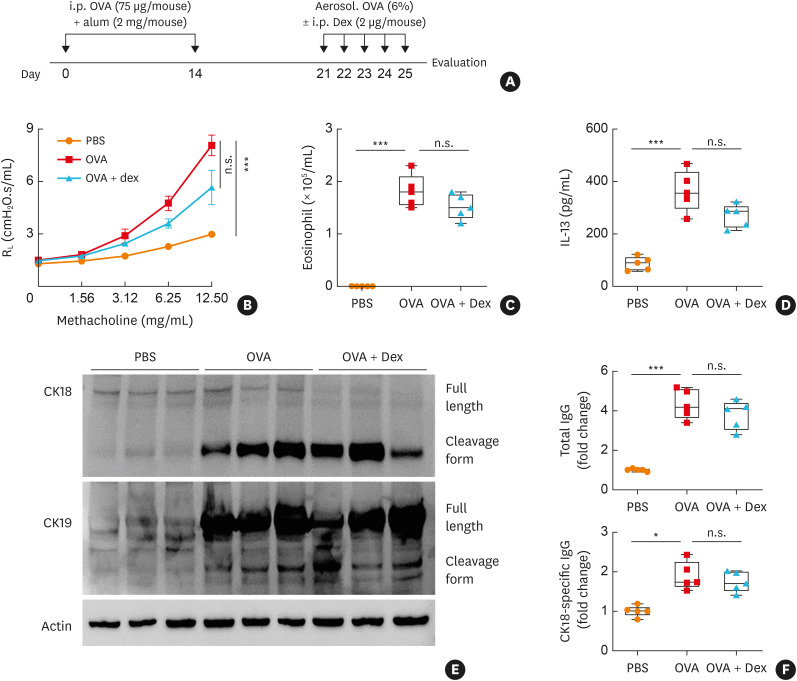
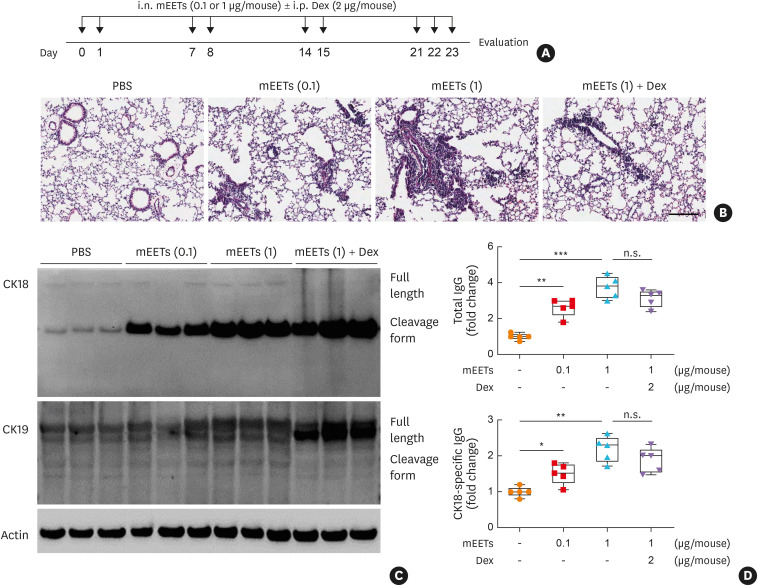
Results: Significantly higher levels of serum cytokeratin (CK) 18 and CK18-specific IgG were observed in patients with SA than in those with NSA (P = 0.001 and P = 0.031, respectively), while no differences were found in serum CK19 or CK19-specific immunoglobulin G (IgG). Moreover, levels of serum CK18 were positively correlated with total eosinophil counts (r = 0.276, P = 0.048) in asthmatics, while a negative correlation was noted between levels of serum CK18 and forced expiratory volume in 1 second (FEV1) %. In the presence of CK18-specific IgG, peripheral eosinophils from asthmatics released EETs, which further increased CK18 production from airway epithelial cells. In severe asthmatic mice, CK18 expression and CK18-specific IgG production were enhanced in the lungs, where EET treatment enhanced CK18 expression and CK18-specific IgG production, either of which was not suppressed by dexamethasone.

Conclusions: These suggest that EETs could enhance epithelial autoantigen (CK18)-induced autoimmune responses, further stimulating EET production and type 2 airway responses, which is a new therapeutic target for SA.

Keywords: Asthma; autoantigens; autoimmunity; eosinophils; epithelium; extracellular traps; immunoglobulin G; keratin.


Conflict of interest statement

There are no financial or other issues that might lead to conflict of interest.

Figures

Fig. 1
Fig. 1. Comparisons of circulating CK18/CK19 levels in association with blood eosinophil counts and FEV1% in the study subjects. Levels of (A) CK18 and (B) CK19 in sera from asthmatic patients as well as from HCs. Data are presented as mean ± SD. P values were obtained by Student’s t-tests. (C) A positive correlation between levels of CK18 and TEC. Data are represented as Pearson correlation coefficient r (P value). Comparisons of serum levels of (D) CK18 and (E) CK19 between patients with SA and NSA. Data are presented as mean ± SD. P values were obtained by Student’s t-tests. (F) A negative correlation between levels of CK18 and FEV1% values. Data are presented as Pearson correlation coefficient r (P value).
CK, cytokeratin; FEV1, forced expiratory volume in 1 second; HCs, healthy control subjects; SD, standard deviation; SA, severe asthma; NSA, nonsevere asthma; TEC, total eosinophil count.
Fig. 2
Fig. 2. Comparisons of serum CK18/CK19-specific IgG levels with asthma severity. (A) Levels of total IgG. Levels of (B) CK18- and (C) CK19-specific IgG in sera of patients with NSA and those with SA. Data are presented as box plots. P values were obtained by Student’s t-tests. Correlations of baseline FEV1% with levels of (D) total IgG, (E) CK18-specific IgG, and (F) CK19-specific IgG. Data are presented as Pearson correlation coefficient r (P value).
CK, cytokeratin; IgG, immunoglobulin G; NSA, nonsevere asthma; SA, severe asthma; FEV1, forced expiratory volume in 1 second.
Fig. 3
Fig. 3. Effects of epithelial antigen (CK18)-specific IgG antibody on EET formation in eosinophils ex vivo. (A) Phosphorylation of p38 in human peripheral eosinophils. (B) Extracellular DNA from the cells observed by agarose gel electrophoresis. (C) Confocal microscopic images of eosinophil degranulation stained with DAPI (blue) and EDN (green). Scale bar, 20 µm. (D) Quantification of EET-forming cells. Concentrations of (E) dsDNA and (F) EDN released from the cells. Data are presented as box plots (n = 5).
CK, cytokeratin; IgG, immunoglobulin G; EETs, eosinophil extracellular traps; DAPI, 4′,6-diamidino-2-phenylindole; EDN, eosinophil-derived neurotoxin; ANOVA, analysis of variance; n.s., not significant. *P < 0.05, **P < 0.01, and ***P < 0.001 were obtained by one-way ANOVA with Bonferroni’s post hoc test.
Fig. 4
Fig. 4. In vivo validation of CK18/CK18-specific IgG production in a mouse model of severe asthma. (A) Schematic for establishing SA in mice. (B) Changes in AHR. (C) Total eosinophil numbers in BALF. (D) Concentrations of IL-13 in BALF. (E) Expression of CK18 and CK19 in the lung tissues. (F) Levels of total IgG and CK18-specific IgG in sera. Data are presented as box plots (n = 5).
CK, cytokeratin; IgG, immunoglobulin G; SA, severe asthma; AHR, airway hyperresponsiveness; BALF, bronchoalveolar lavage fluid; IL, interleukin; n.s., not significant; Dex, dexamethasone; OVA, ovalbumin; PBS, phosphate-buffered saline; ANOVA, analysis of variance. *P < 0.05 and ***P < 0.001 were obtained by one-way ANOVA with Bonferroni’s post hoc test.
Fig. 5
Fig. 5. EETs-induced CK18/CK18-specific IgG production in a mouse model of severe asthma in vivo. (A) Schematic for mEET treatment. (B) Histological analysis of lung tissues stained with hematoxylin and eosin. Scale bar, 200 µm. (C) Expression of CK18 and CK19 in the lung tissues. (D) Levels of total IgG and CK18-specific IgG in sera. Data are presented as box plots (n = 5).
EETs, eosinophil extracellular traps; CK, cytokeratin; IgG, immunoglobulin G; mEETs, mouse-derived eosinophil extracellular traps; i.n., intranasal; i.p. intraperitoneal; Dex, dexamethasone; PBS, phosphate-buffered saline; n.s., not significant. *P < 0.05, **P < 0.01, and ***P < 0.001 were obtained by one-way ANOVA with Bonferroni’s post hoc test.

References

    1. Cevhertas L, Ogulur I, Maurer DJ, Burla D, Ding M, Jansen K, et al. Advances and recent developments in asthma in 2020. Allergy. 2020;75:3124–3146. - PubMed
    1. Holguin F, Cardet JC, Chung KF, Diver S, Ferreira DS, Fitzpatrick A, et al. Management of severe asthma: a European Respiratory Society/American Thoracic Society guideline. Eur Respir J. 2020;55:1900588. - PubMed
    1. Soma T, Iemura H, Naito E, Miyauchi S, Uchida Y, Nakagome K, et al. Implication of fraction of exhaled nitric oxide and blood eosinophil count in severe asthma. Allergol Int. 2018;67S:S3–11. - PubMed
    1. Price DB, Bosnic-Anticevich S, Pavord ID, Roche N, Halpin DM, Bjermer L, et al. Association of elevated fractional exhaled nitric oxide concentration and blood eosinophil count with severe asthma exacerbations. Clin Transl Allergy. 2019;9:41. - PMC - PubMed
    1. Heijink IH, Kuchibhotla VN, Roffel MP, Maes T, Knight DA, Sayers I, et al. Epithelial cell dysfunction, a major driver of asthma development. Allergy. 2020;75:1902–1917. - PMC - PubMed