. 2022 Aug 1;36(15-16):916-935.
doi: 10.1101/gad.349689.122. Epub 2022 Sep 29.

Developmentally regulated alternate 3' end cleavage of nascent transcripts controls dynamic changes in protein expression in an adult stem cell lineage

Affiliations

Developmentally regulated alternate 3' end cleavage of nascent transcripts controls dynamic changes in protein expression in an adult stem cell lineage

Cameron W Berry et al. Genes Dev. .

Abstract

Alternative polyadenylation (APA) generates transcript isoforms that differ in the position of the 3' cleavage site, resulting in the production of mRNA isoforms with different length 3' UTRs. Although widespread, the role of APA in the biology of cells, tissues, and organisms has been controversial. We identified >500 Drosophila genes that express mRNA isoforms with a long 3' UTR in proliferating spermatogonia but a short 3' UTR in differentiating spermatocytes due to APA. We show that the stage-specific choice of the 3' end cleavage site can be regulated by the arrangement of a canonical polyadenylation signal (PAS) near the distal cleavage site but a variant or no recognizable PAS near the proximal cleavage site. The emergence of transcripts with shorter 3' UTRs in differentiating cells correlated with changes in expression of the encoded proteins, either from off in spermatogonia to on in spermatocytes or vice versa. Polysome gradient fractionation revealed >250 genes where the long 3' UTR versus short 3' UTR mRNA isoforms migrated differently, consistent with dramatic stage-specific changes in translation state. Thus, the developmentally regulated choice of an alternative site at which to make the 3' end cut that terminates nascent transcripts can profoundly affect the suite of proteins expressed as cells advance through sequential steps in a differentiation lineage.

Keywords: alternative polyadenylation; mRNA isoforms; spermatogenesis; translational control.


Figures

Figure 1.
Figure 1.
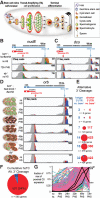
Differential 3′ end cleavage of selected transcripts is associated with the switch from spermatogonia proliferation to spermatocyte differentiation in Drosophila. (A) Main stages of Drosophila male germ cell differentiation. (B,C) 3′-seq tracks from one of two biological replicates plotted on the 3′ genomic region of nudE (B) and dco (C) from testes from bamΔ86/1;hs-Bam-HA (bam heat shock time course [hsTC]) flies with no heat shock or 72 h post-heat shock (PHS), as well as testes from aly mutant flies with no heat shock. The maximum number of supporting reads is indicated at the right of each track. At the top is a gene model representing the two most abundant isoforms of 3′ UTR for each gene, indicating the position of the proximal (red) and distal (blue) cleavage sites (CSs) according to peaks from 3′-seq tracks. (D) 3′-seq tracks of one of two biological replicates plotted on the 3′ genomic region of orb from the bam hsTC flies at indicated times PHS and from aly mutant testes. At the left, testes diagrams indicate the cell diversity and developmental stage at each timepoint. (E) Pie charts (size normalized to gene list) for each time point indicating the number of genes detected as undergoing alternative 3′ cleavage events resulting in longer (blue) or shorter (red) 3′ UTRs relative to in testes from bamΔ86/1;hs-Bam-HA flies without HS. (Bottom row) Comparison of aly5p/2 flies without HS versus bamΔ86/1;hs-Bam-HA flies without HS. (F) Cumulative pie chart containing all genes detected as changing 3′ UTR cut site in the bam hsTC. (G) Line graph of the 531 genes called as showing stage-specific alternative 3′ cleavage, with the relative level of the short 3′ UTR isoform plotted as the fraction of maximum value over the time course. (Black lines) Relative short 3′ UTR transcript levels for nudE, orb, and dco.
Figure 2.
Figure 2.
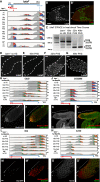
The strength of PAS at the proximal site influences stage-specific differential 3′ end formation. (A) Top MEME motif enriched in a 50-nt region upstream of distal cleavage sites (CSs) of 531 genes that undergo alternative 3′ cleavage to produce transcripts with shorter 3′ UTRs in later stages of the hsTC, compared with a background of similar 50-nt regions upstream of the 3′ end for genes that do not undergo alternative 3′ cleavage. Plot of the abundance of the MEME enriched sequence along the 50-nt region upstream of the distal CS, with the number of the APA transcripts that have the MEME motif 10–40 nt upstream of the distal cleavage site in blue. (B) Position of the canonical PAS (AATAAA) upstream of the proximal (red line) or distal (blue line) cleavage sites in genes identified as undergoing the stage-specific APA, with the percentage of the APA transcripts that have a canonical PAS 10–40 nt upstream of the respective cleavage sites shown. (C) Arrangement of canonical, variant, or no PAS motif upstream of the proximal and distal cleavage sites (indicated as “proximal/distal”) in genes that undergo the stage-specific APA. (Black arc) Fifty-four percent of the APA genes have a stronger PAS associated with the distal cleavage site than with the proximal cleavage site. (D,D′) Live fluorescent images of testes from Drosophila containing a GFP-tagged third-copy Fosmid transgene for dco (green) and mRFP-tagged His2Av (red). (E,F) Diagram of the paired dco 3′ UTR reporter constructs. (Light gray) UAS element to drive cell type-specific expression in spermatogonia under the control of nos-Gal4, (light green) coding region for destabilized GFP, (light yellow) genomic DNA encoding dco 3′ UTR, (dark gray) 500 bases downstream from the distal 3′ cleavage site. (E) WT: Wild-type dco 3′ UTR with the proximal (variant sequence) and distal (canonical sequence) polyadenylation signal (PAS) indicated by a red and blue triangle, respectively. (F) can PAS* dco 3′ UTR: Same construct as above but with a single nucleotide change in the dco 3′ UTR that converts a variant PAS (AATATA) into the canonical PAS (AATAAA) 23 nt upstream of the proximal cleavage site. (G) RT-PCR ratio of reporter mRNA isoform with long 3′ UTR to total reporter mRNA produced in testes from the indicated reporters expressed in early germ cells under the control of nos-Gal4 as measured by qRT-PCR using primer pairs indicated in F. WT dco 3′ UTR reporter long/total ratio was set to 1. Error bar indicates SD of at least three independent biological replicates. (H,I) Native GFP fluorescence for the respective reporters expressed at the apical tip of testes (indicated by an asterisk) under control of nos-Gal4. (J) Quantification of GFP fluorescence in z-stacks through apical tips of live testes, normalized to His2Av::mRFP expression. (Asterisk) Hub, (solid bracket) spermatogonia, (dashed bracket) spermatocytes. Scale bars, 50 µm. Statistical significance was determined by two-tailed Student's t-test. (***) P-value < 0.001.
Figure 3.
Figure 3.
Changes in protein expression accompany the shortening of 3′ UTRs. (A) 3′-seq tracks of testis mRNA from one of two biological replicates plotted on the 3′ genomic region of lolaF from the bam hsTC at the indicated times PHS, as well as from and aly mutant testes. (B,B′) Immunofluorescence image of the apical region of a wild-type testis stained with anti-LolaF (white/green) and anti-Vasa (red) antibodies. (C) 3′ RACE of lolaF from bam hsTC fly testes at the indicated time points showing the expression of long and short 3′ UTR isoforms. (DG) Immunofluorescence images containing the apical third of testes from bam−/−;hs-Bam flies with no heat shock or 16, 32, or 48 h PHS stained with anti-LolaF antibody. (H,J,L,N) 3′-seq tracks from one of two biological replicates from testes from bam hsTC flies at the indicated times PHS, as well as from aly mutant testes, plotted on the 3′ genomic regions for Chd3 (H), CG32066 (J), Snp (L), and numb (N). (Bottom) Proximal (red arrowhead) and distal (blue arrowhead) cleavage sites were predicted from the most highly used cleavage site in bam−/−;hs-Bam testes without heat shock and 48 h PHS, respectively. (I,K,M) Native fluorescence from GFP (white/green) and mRFP (red) in live-mount testes from flies carrying His2Av-mRFP and third-copy Fosmid-based GFP-tagged reporters for Chd3-GFP (I,I′), CG32066-GFP (K,K′), and Snp-GFP (M,M′). (O,O′) Immunofluorescence staining of testis tip with anti-Numb (white/green) and anti-Vasa (red). (Asterisk) Hub, (solid bracket) spermatogonia, (dashed bracket) spermatocytes. Scale bars, 50 µm.
Figure 4.
Figure 4.
3′-seq following polysome fractionation reveals widespread differences in migration of transcripts with long 3′ UTRs at 24 h PHS versus their short 3′ UTR isoforms at 48 h PHS. (A) Diagram of polysome fractionation by centrifugation: Transcripts occupied by more ribosomes sediment further down in the polysome profile. (B) Absorbance at 260 nm from one of two replicates of the polysome profile of testis extracts from 48 h PHS, indicating separation of the 40S, 80S, and multiple polysome peaks. ROYGBV colors (with dashed lines as boundaries) indicate the polysome fractions that were combined before 3′-seq. (C,E) 3′-seq from polysome profiling from 24-h PHS testes, plotting relative level of the long 3′ UTR isoform detected across the different polysome fractions (in each column) for genes that undergo the stage-specific 3′ UTR shortening due to APA (in each row). (C) Heat map of the 124 long 3′ UTR mRNA isoforms that predominantly comigrated with polysome fractions lighter than the 80S at the 24-h PHS time point. (E) Heat map of the 384 long 3′ UTR mRNA isoforms that comigrated with the 80S and/or polysomes at the 24-h PHS time point. (D,F) 3′-seq from polysome profiling of 48-h PHS testes, plotting relative level of the short 3′ UTR isoform detected across the different polysome profile fractions for genes that undergo the stage-specific 3′ UTR. (D) Heat map of distribution based on 3′-seq of the polysome fractions from 48-h PHS testes of the short 3′ UTR mRNA isoforms from the 124 genes grouped in C. (F) Heat map of distribution based on 3′-seq of the polysome fractions from 48-h PHS testes of the short 3′ UTR mRNA isoforms from the 384 genes from E. Heat map: White/yellow indicates low expression of the indicated transcript, and dark red indicates higher expression of the transcript. nudE transcript is indicated in black. (GK′) Immunofluorescence images of testes from bamΔ86/1;hs-Bam flies with no heat shock or 24, 48, 72, or 96 h PHS stained with anti-nudE antibody (white/green) and anti-Vasa (red). (Solid bracket) Spermatogonia, (dashed bracket) spermatocytes. Scale bars: 50 µm.
Figure 5.
Figure 5.
Dynamic changes in the polysome profile of short 3′ UTR isoforms as spermatocytes mature revealed by 3′-seq polysome profiling of 72-h PHS testes. (A) Heat map of distribution in the polysome gradient based on 3′-seq of 199 of the short 3′ UTR mRNA isoforms that predominantly comigrated with fractions lighter than the 80S monosome at the 48-h PHS time point from Figure 4F. (B) Heat map of distribution in the polysome fractions from 72-h PHS testes of the same 199 short 3′ UTR mRNA isoforms shown in A. (C) Line graph of relative levels of the long 3′ UTR orb isoform (24 h PHS; green) and short 3′ UTR orb isoform (48 h PHS [red] and 72 h PHS [blue]) in the indicated polysome fractions. (DH′) Immunofluorescence images of apical regions of testes from bamΔ86/1;hs-Bam flies with no heat shock or 24, 48, 72, or 96 h PHS stained with anti-Orb antibody (white/green) and antibody against the spermatocyte marker Kmg (magenta). (Solid bracket) Spermatogonia, (dashed bracket) spermatocytes. Scale bars, 50 µm.
Figure 6.
Figure 6.
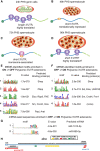
Identification of motifs enriched in transcripts from genes subject to APA that undergo dynamic translational regulation as Drosophila germline progenitors differentiate. Cartoon depictions of germline cysts from 24-h (A), 48-h (B), 72-h (C), and 96-h (D) PHS testes. Predicted transcript association with ribosomes based on 3′-seq polysome profiling with the coding region (blue) and 3′ UTR (green). Top MEME motifs enriched in the “extension” regions spanning from the proximal to distal cleavage sites of 200 transcripts that undergo APA and transition from on polysomes at 24 h PHS to polysome-free fractions at 48 h PHS (E) and 50 transcripts that undergo APA and transition from polysome-free fractions at 24 h PHS to polysomes at 48 h PHS (F). Predicted RNA binding proteins that bind to each motif are also indicated. (G) Indicated miRNAs are enriched in the 3′ UTR extensions of transcripts that go from off to on relative to a background set of 3′ UTRs that do not undergo APA. (H) The presence of motifs identified in E is indicated in the extension region of dco's 3′ UTR.

Similar articles

Cited by

References

    1. Agarwal V, Lopez-Darwin S, Kelley DR, Shendure J. 2021. The landscape of alternative polyadenylation in single cells of the developing mouse embryo. Nat Commun 12: 5101. 10.1038/s41467-021-25388-8 - DOI - PMC - PubMed
    1. An JJ, Gharami K, Liao GY, Woo NH, Lau AG, Vanevski F, Torre ER, Jones KR, Feng Y, Lu B, et al. 2008. Distinct role of long 3′ UTR BDNF mRNA in spine morphology and synaptic plasticity in hippocampal neurons. Cell 134: 175–187. 10.1016/j.cell.2008.05.045 - DOI - PMC - PubMed
    1. Andreassi C, Luisier R, Crerar H, Darsinou M, Blokzijl-Franke S, Tchern L, Luscombe NM, Cuda G, Gaspari M, Saiardi A, et al. 2021. Cytoplasmic cleavage of IMPA1 3′ UTR is necessary for maintaining axon integrity. Cell Rep 34: 108778. 10.1016/j.celrep.2021.108778 - DOI - PMC - PubMed
    1. Angulo B, Srinivasan S, Bolival BJ, Olivares GH, Spence AC, Fuller MT. 2019. DREF genetically counteracts Mi-2 and Caf1 to regulate adult stem cell maintenance. PLoS Genet 15: e1008187. 10.1371/journal.pgen.1008187 - DOI - PMC - PubMed
    1. Bae B, Miura P. 2020. Emerging roles for 3′ UTRs in neurons. Int J Mol Sci 21: 3413. 10.3390/ijms21103413 - DOI - PMC - PubMed

Publication types