. 2023 Feb;82(2):272-282.
doi: 10.1136/ard-2022-222773. Epub 2022 Sep 29.

Synovial fibroblasts assume distinct functional identities and secrete R-spondin 2 in osteoarthritis

Affiliations

Synovial fibroblasts assume distinct functional identities and secrete R-spondin 2 in osteoarthritis

Alexander J Knights et al. Ann Rheum Dis. 2023 Feb.

Abstract

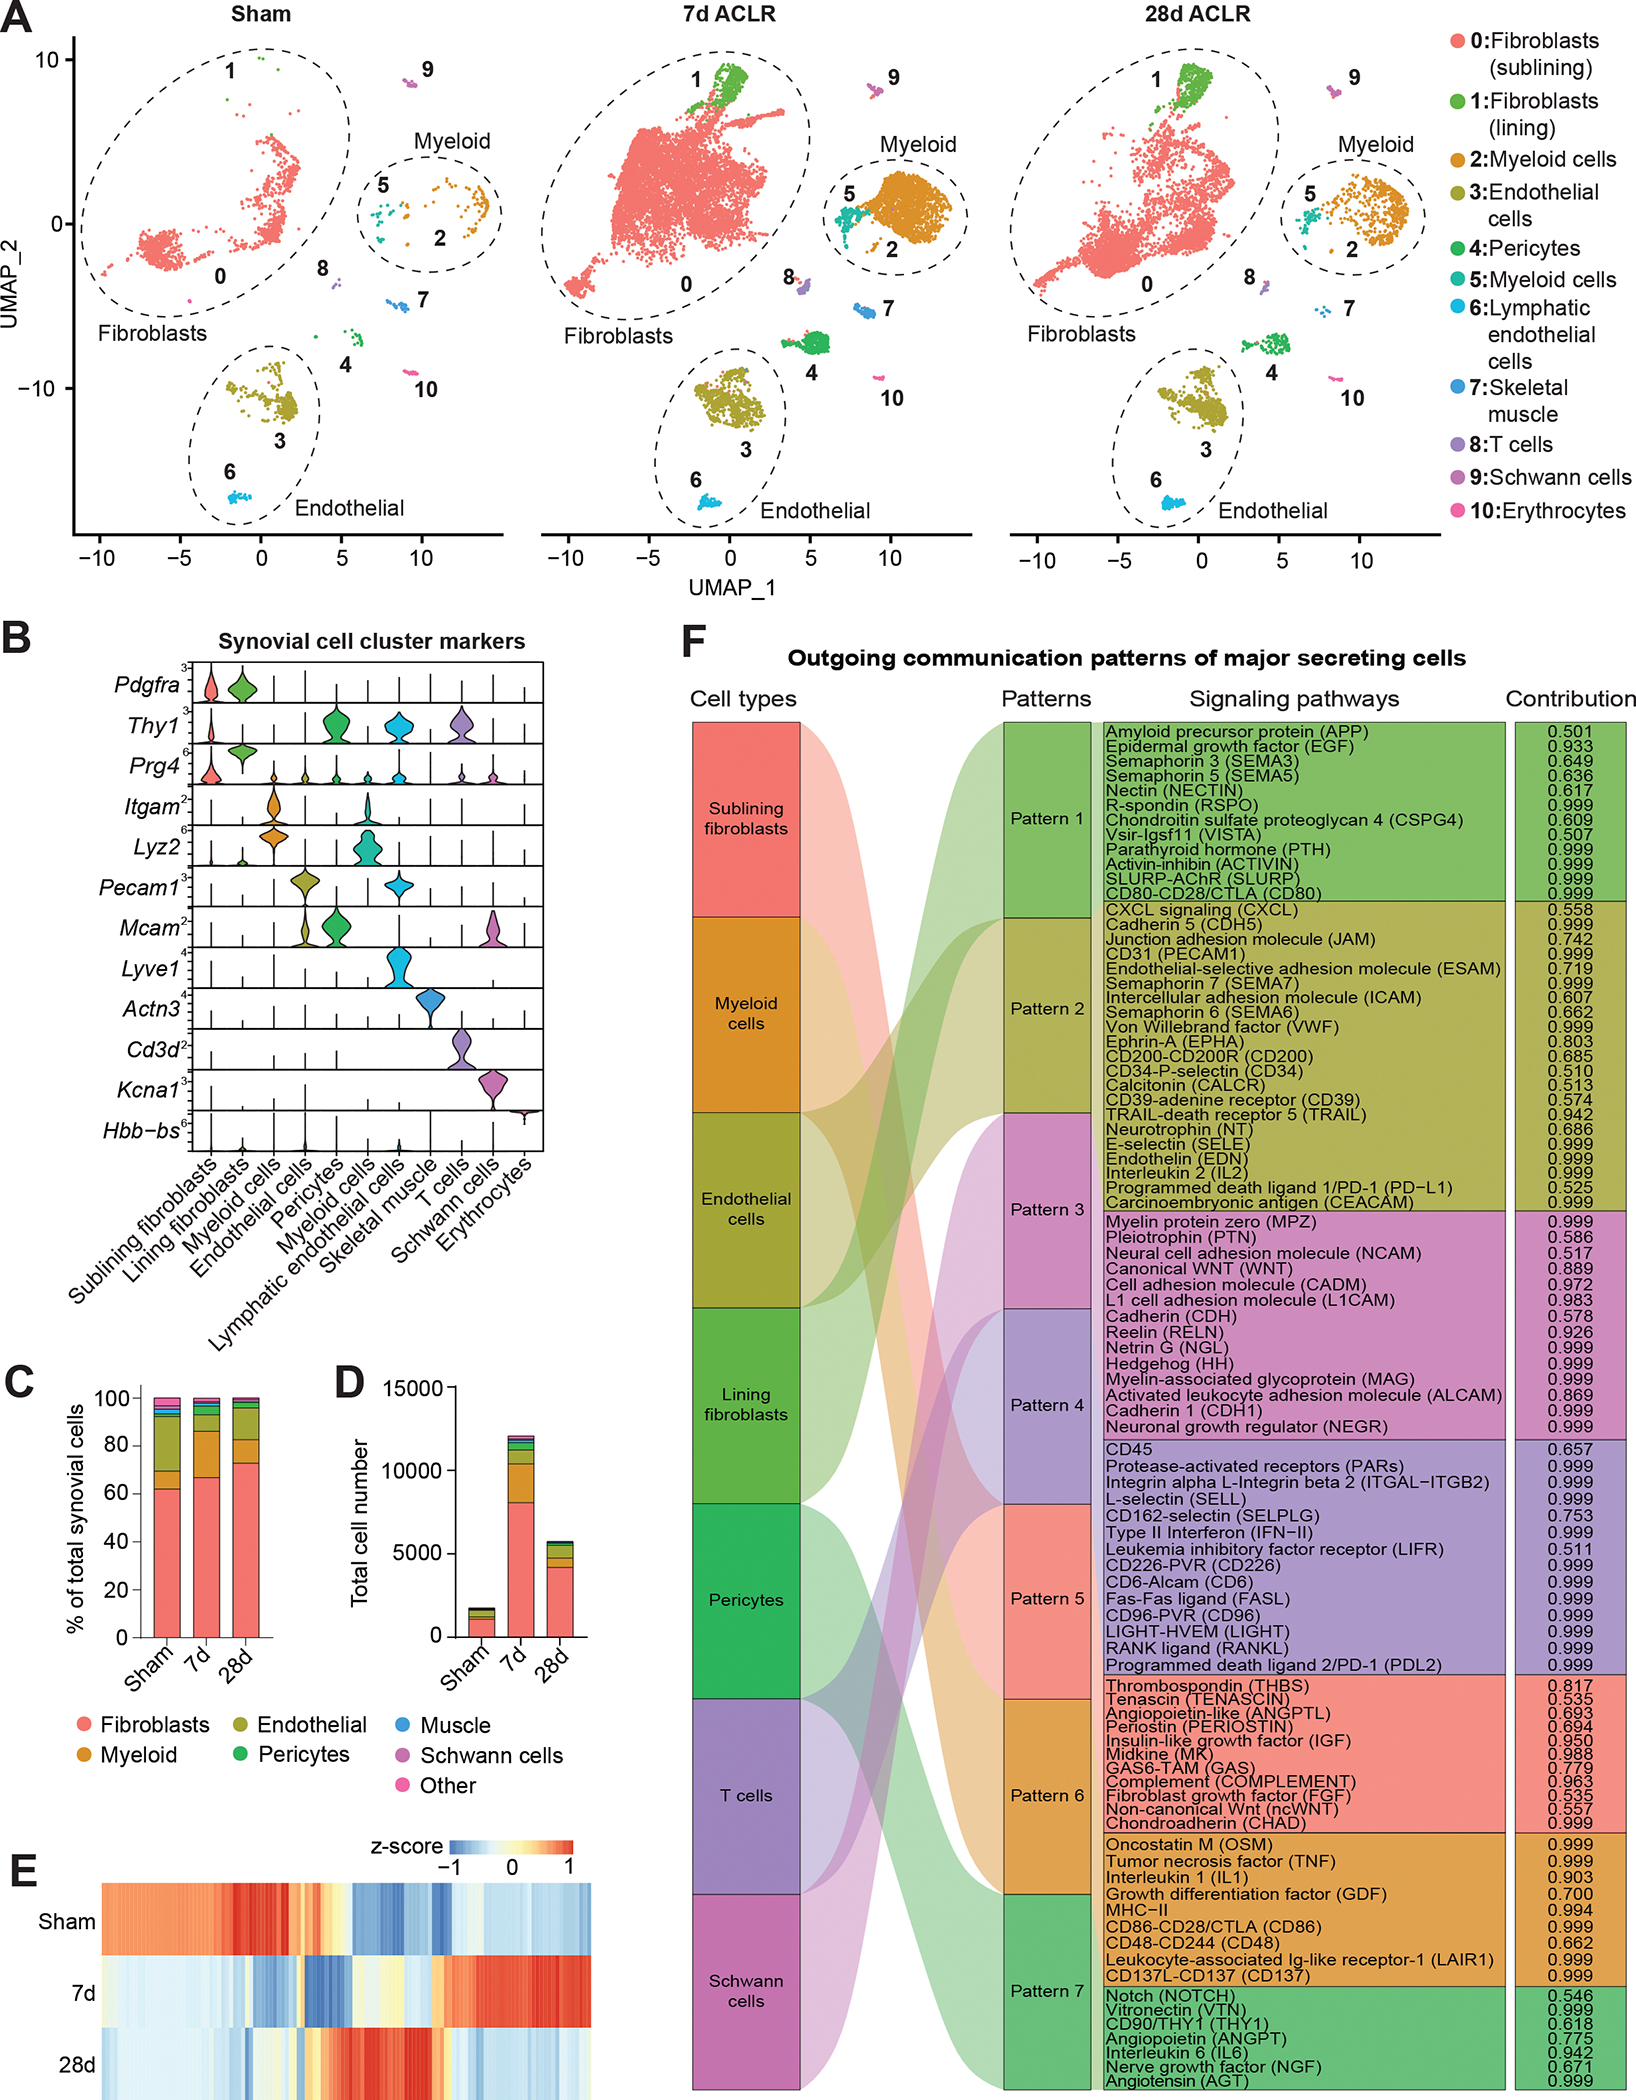
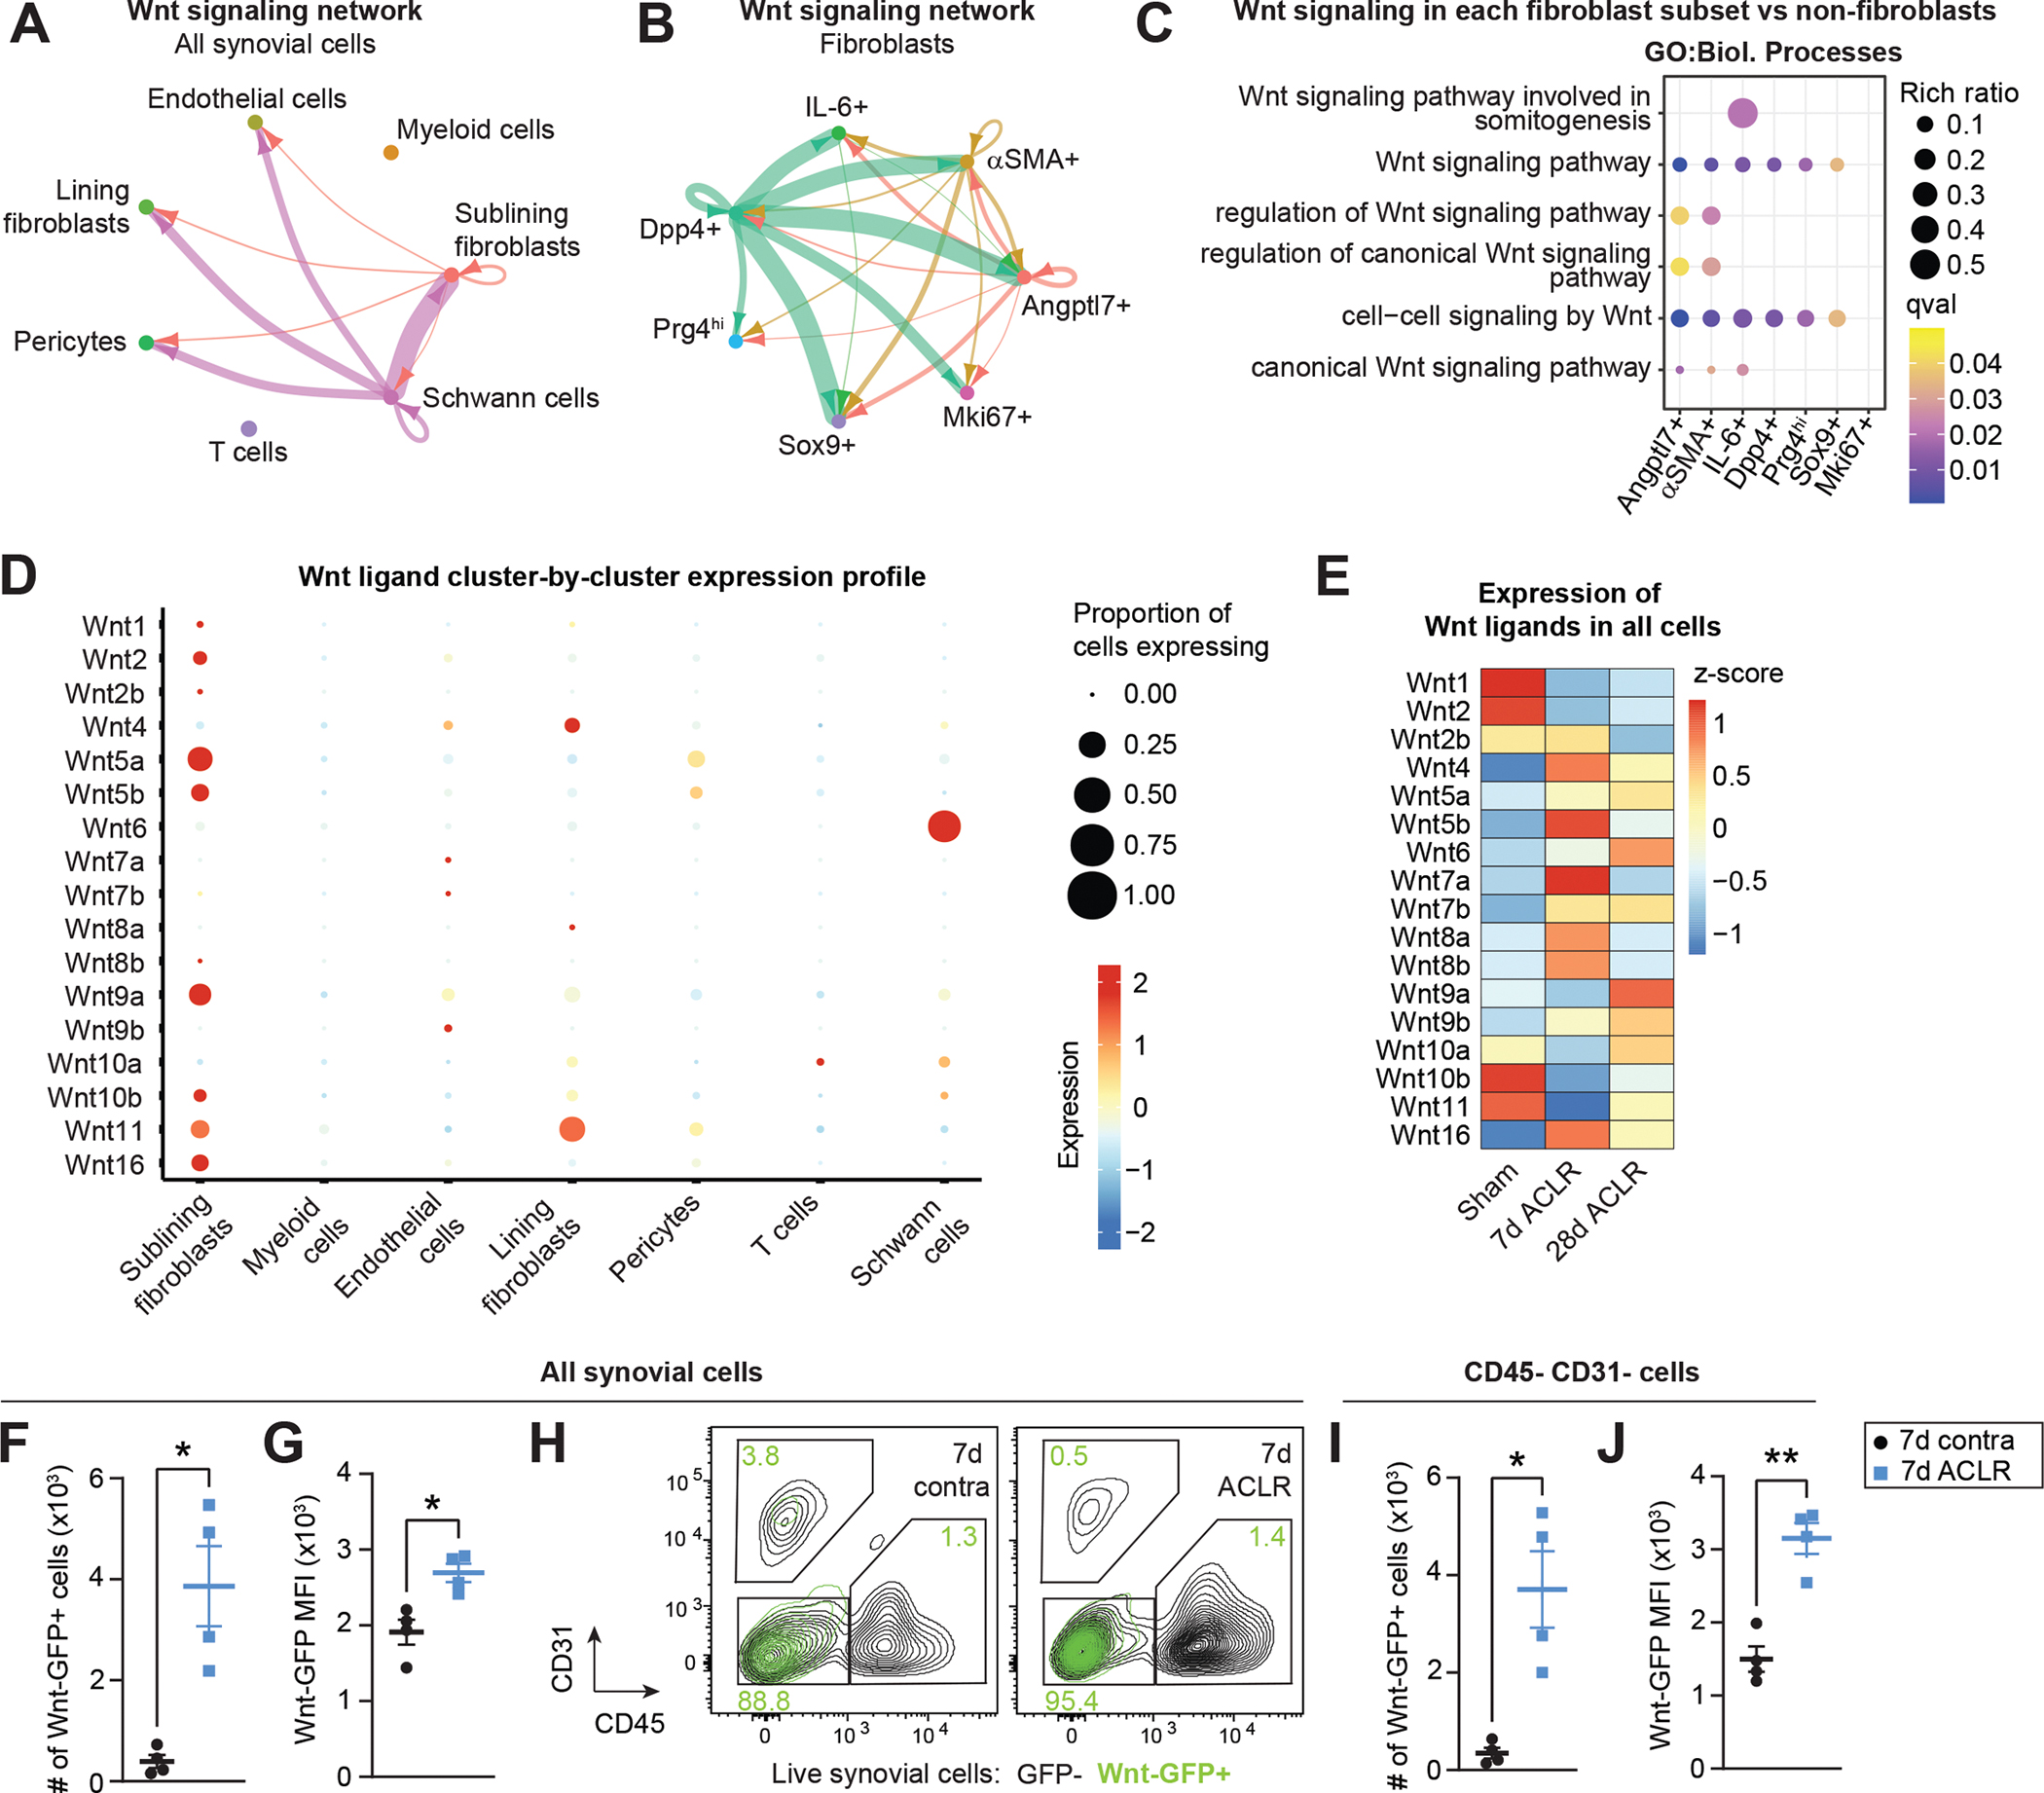
Objectives: Synovium is acutely affected following joint trauma and contributes to post-traumatic osteoarthritis (PTOA) progression. Little is known about discrete cell types and molecular mechanisms in PTOA synovium. We aimed to describe synovial cell populations and their dynamics in PTOA, with a focus on fibroblasts. We also sought to define mechanisms of synovial Wnt/β-catenin signalling, given its emerging importance in arthritis.

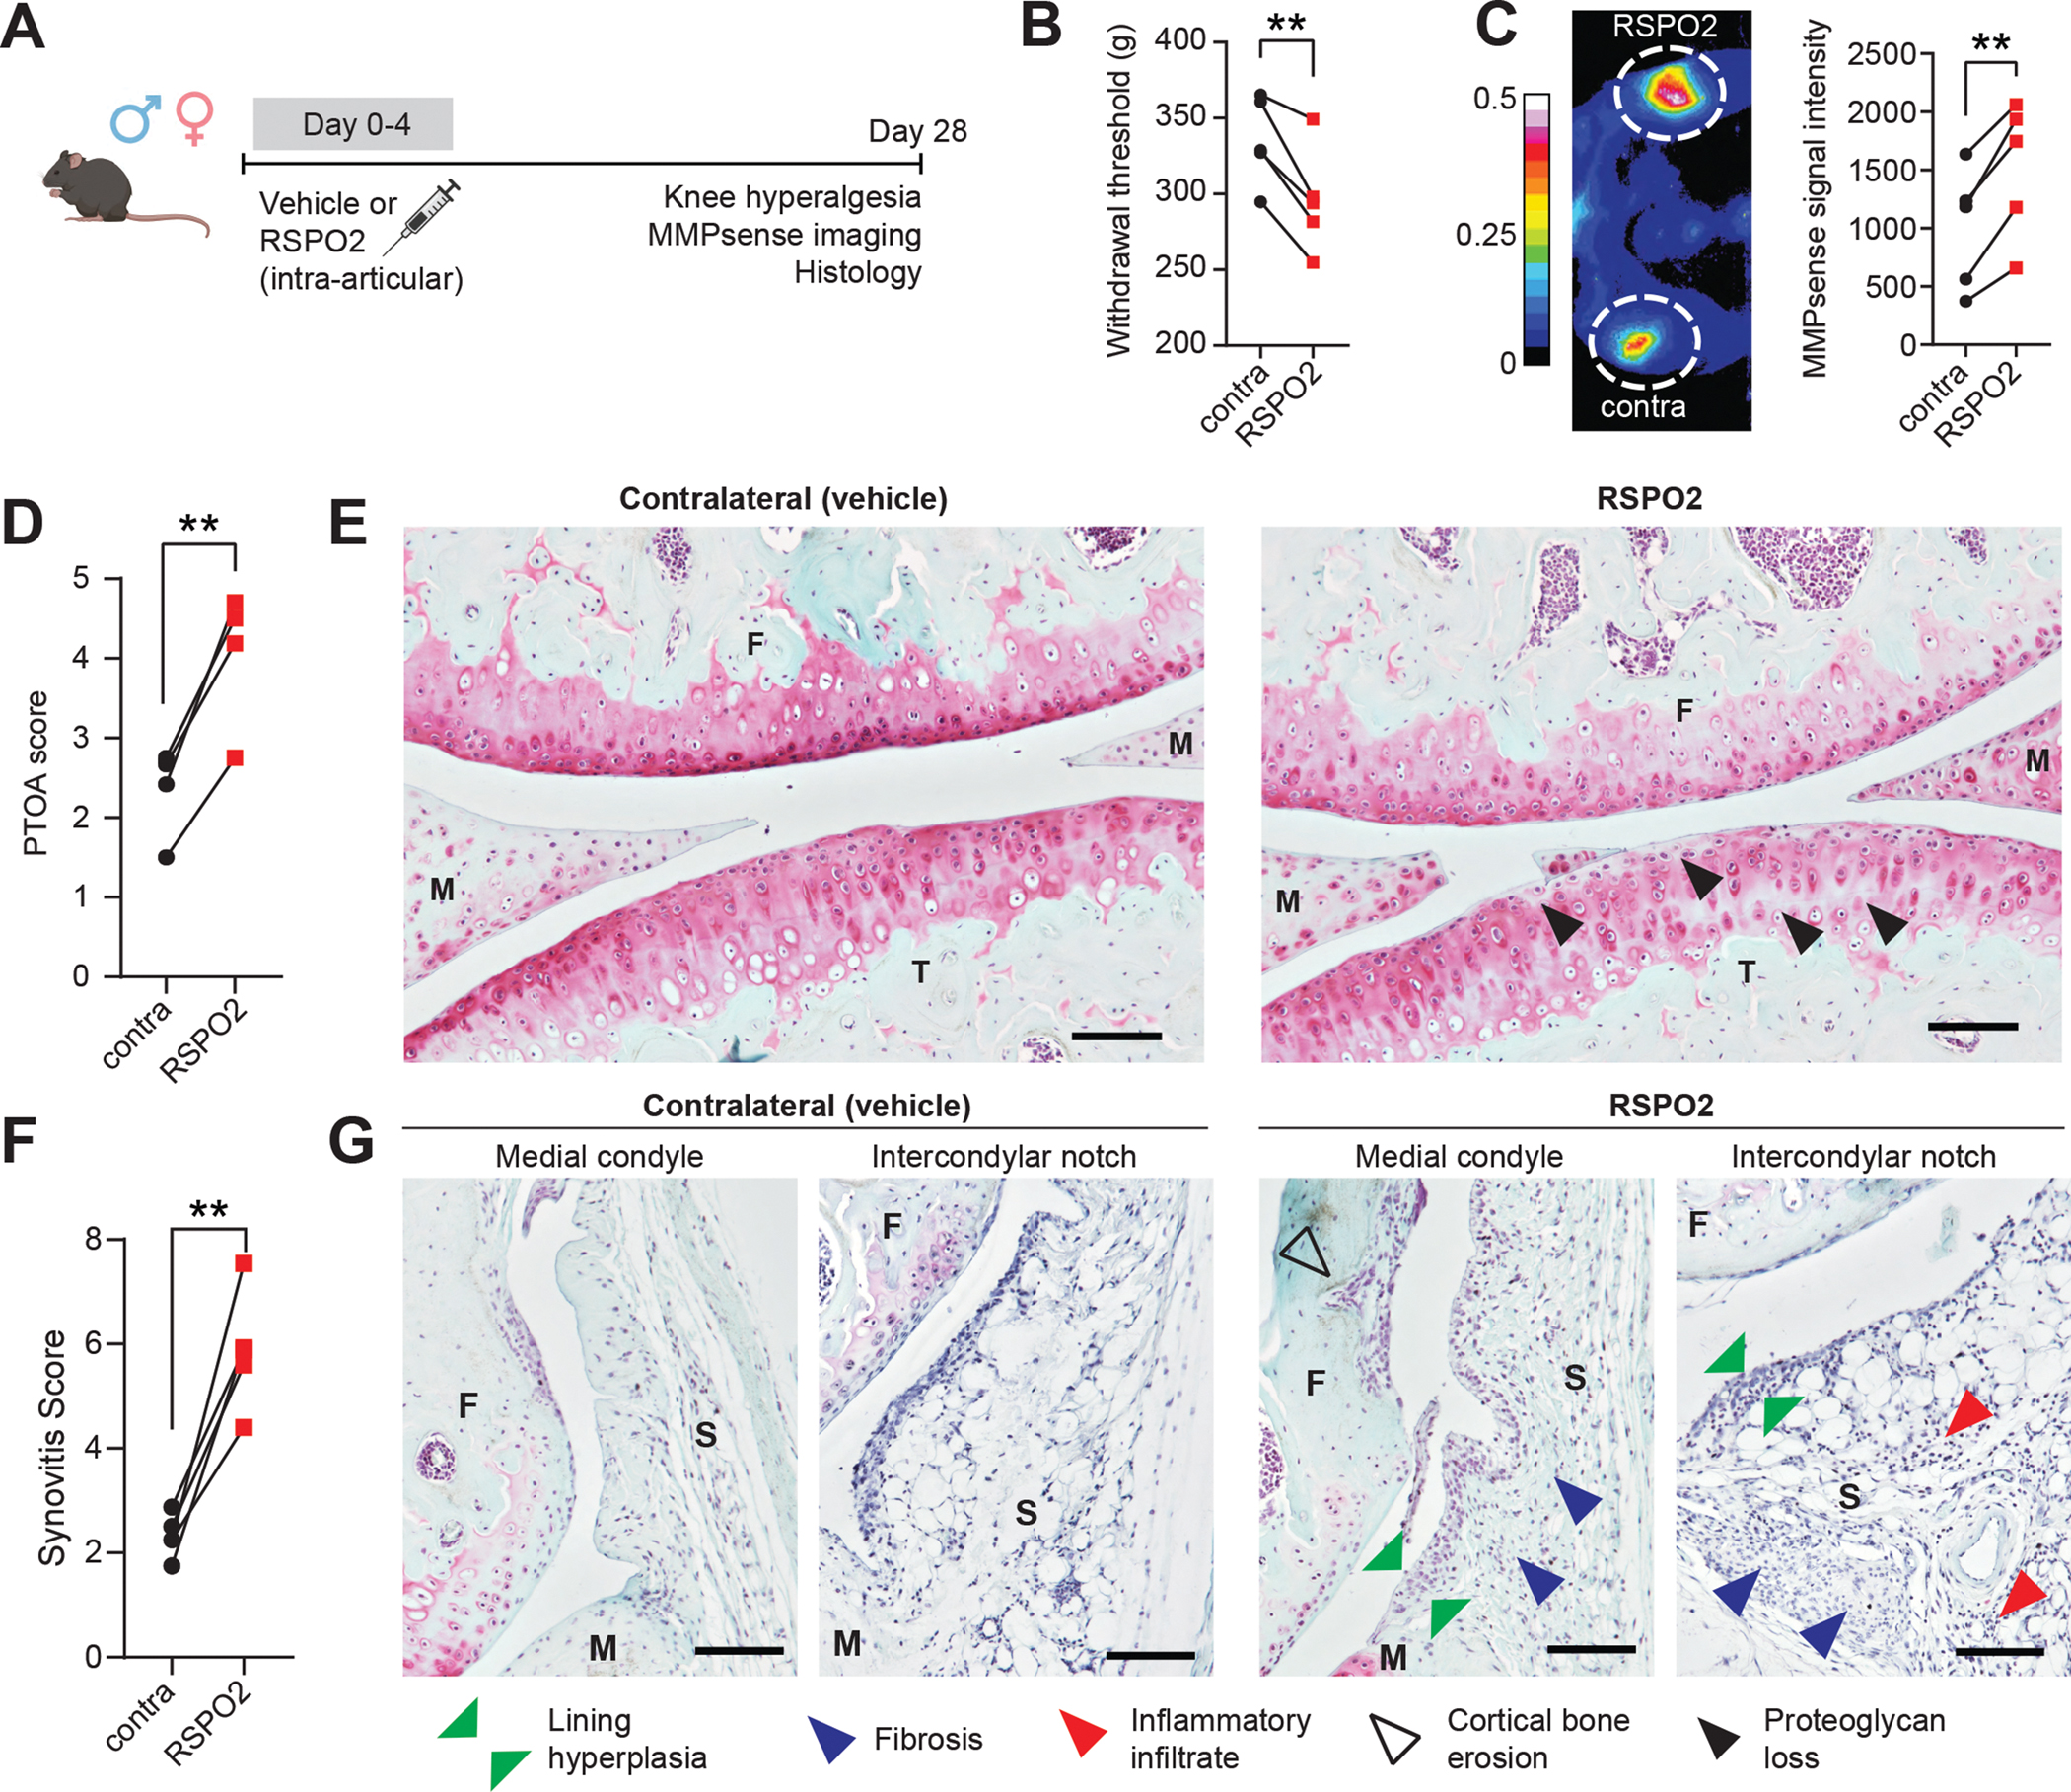
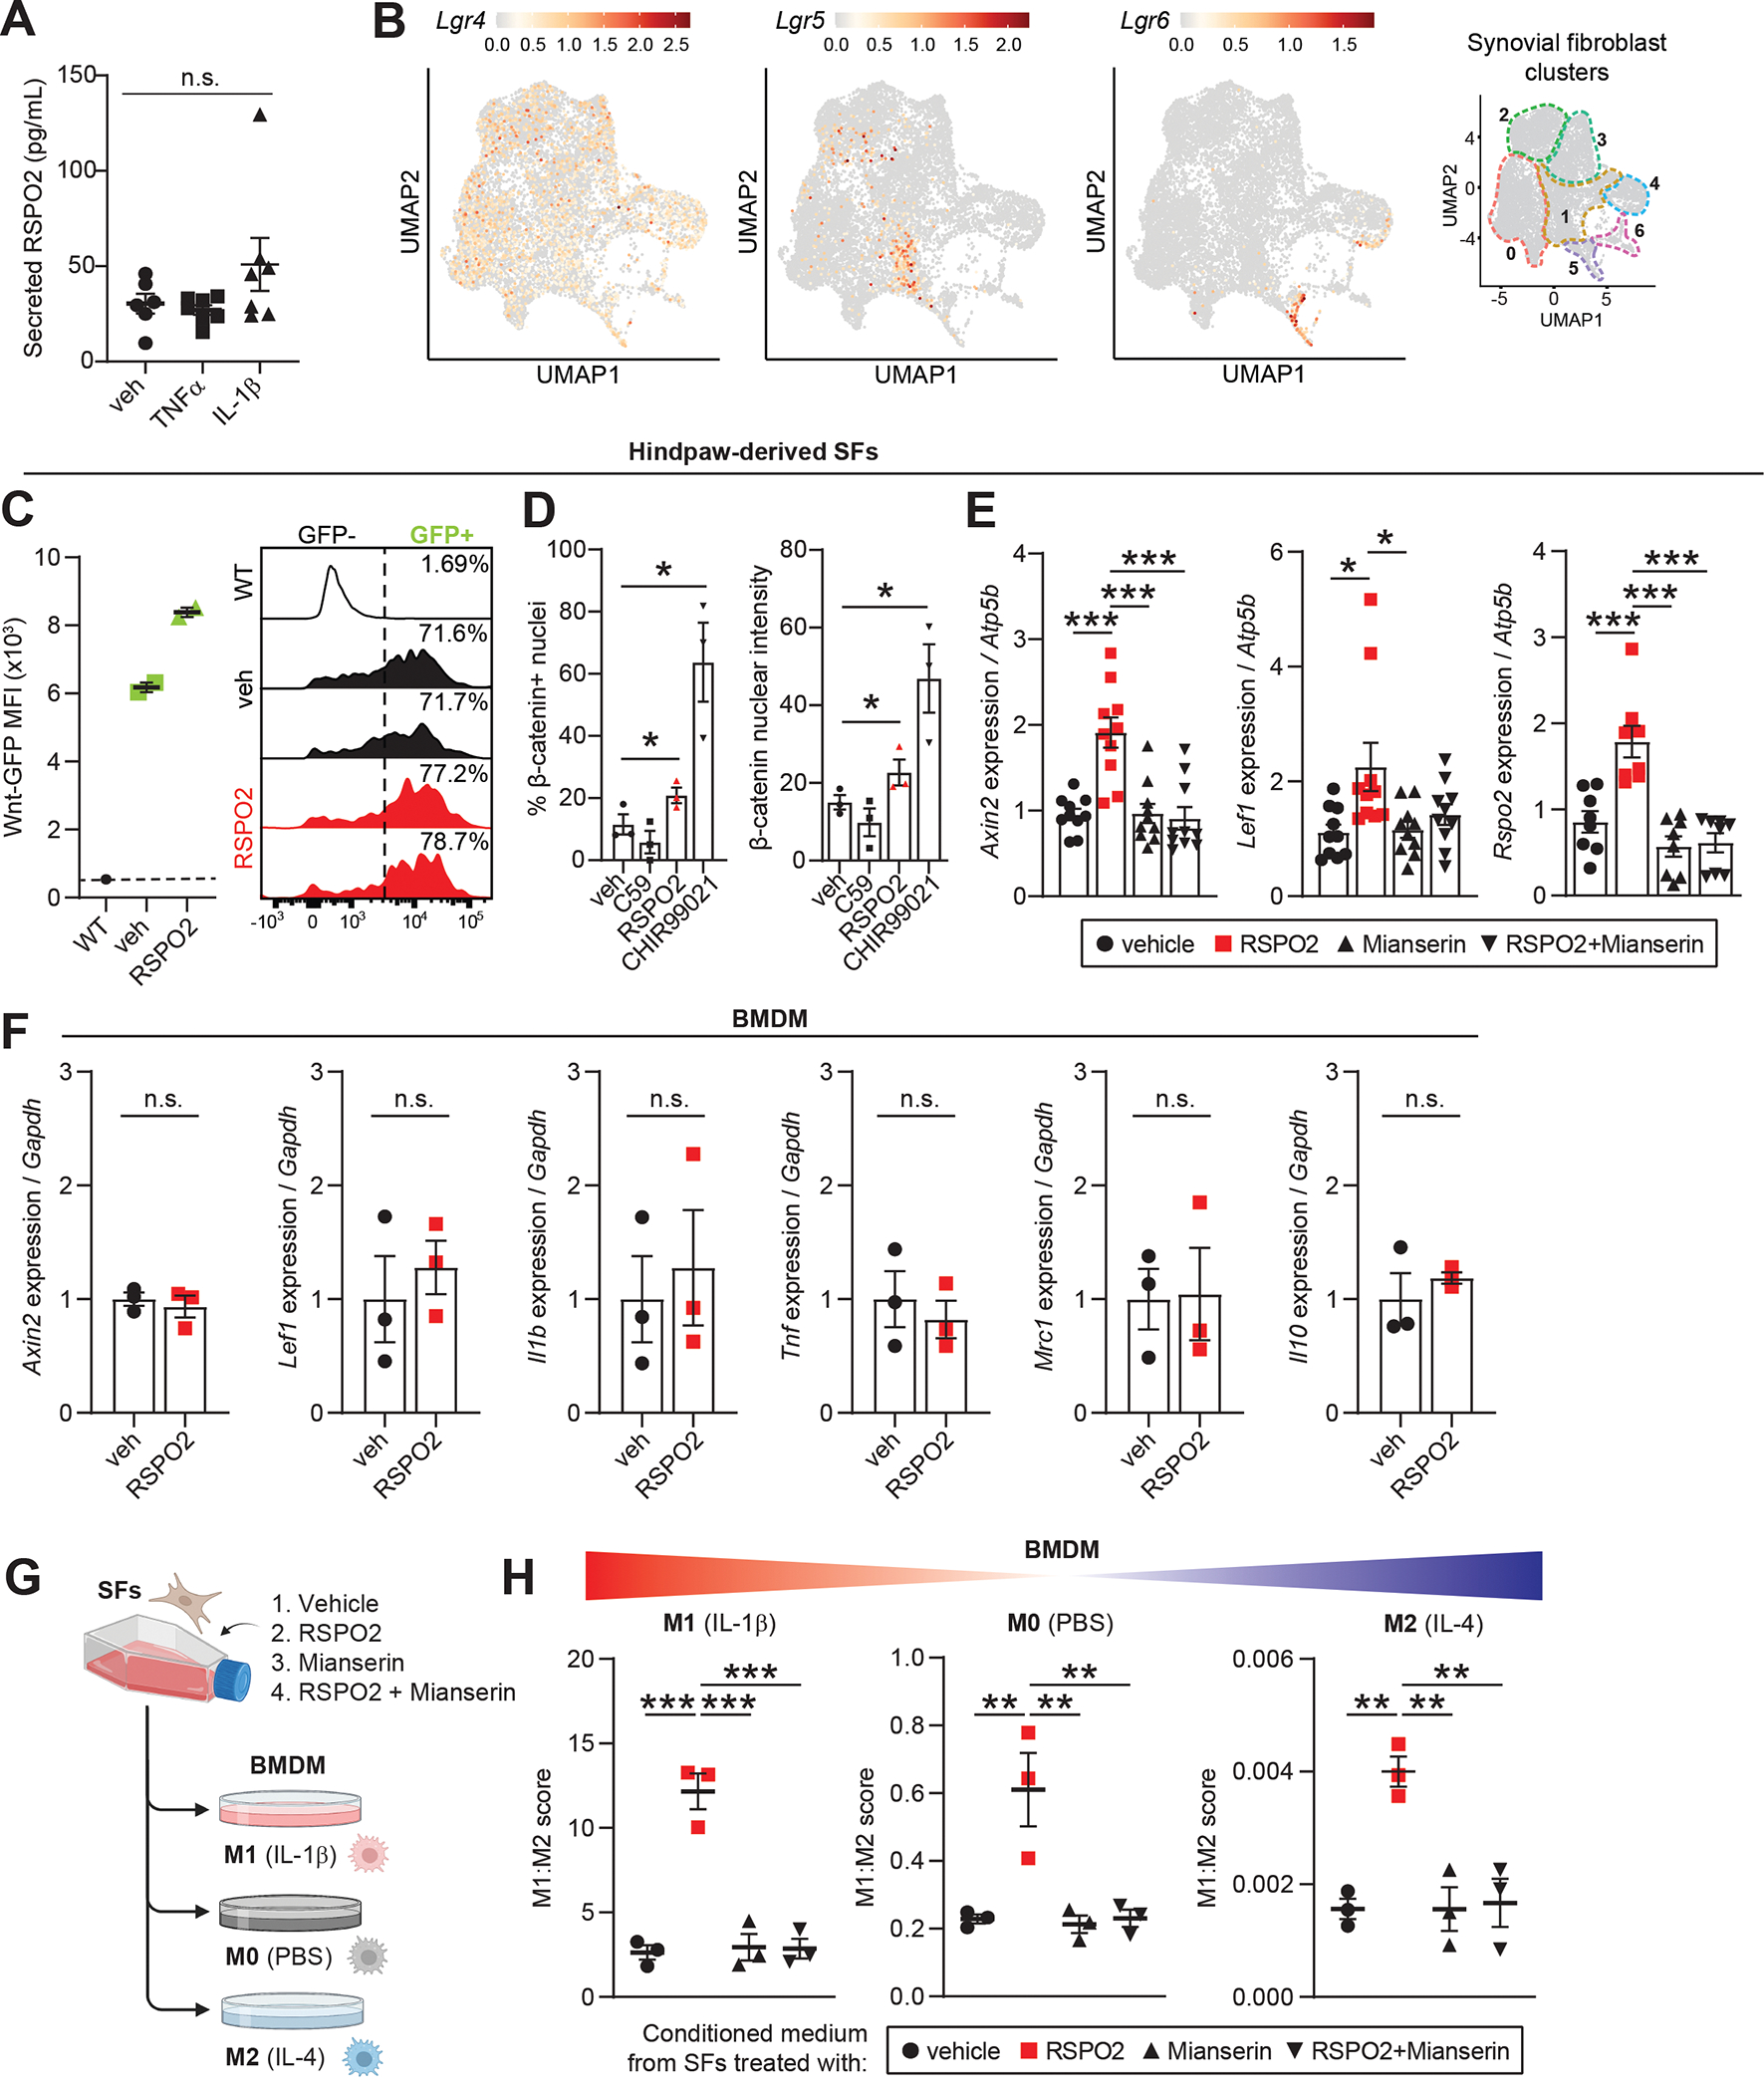
Methods: We subjected mice to non-invasive anterior cruciate ligament rupture as a model of human joint injury. We performed single-cell RNA-sequencing to assess synovial cell populations, subjected Wnt-GFP reporter mice to joint injury to study Wnt-active cells, and performed intra-articular injections of the Wnt agonist R-spondin 2 (Rspo2) to assess whether gain of function induced pathologies characteristic of PTOA. Lastly, we used cultured fibroblasts, macrophages and chondrocytes to study how Rspo2 orchestrates crosstalk between joint cell types.

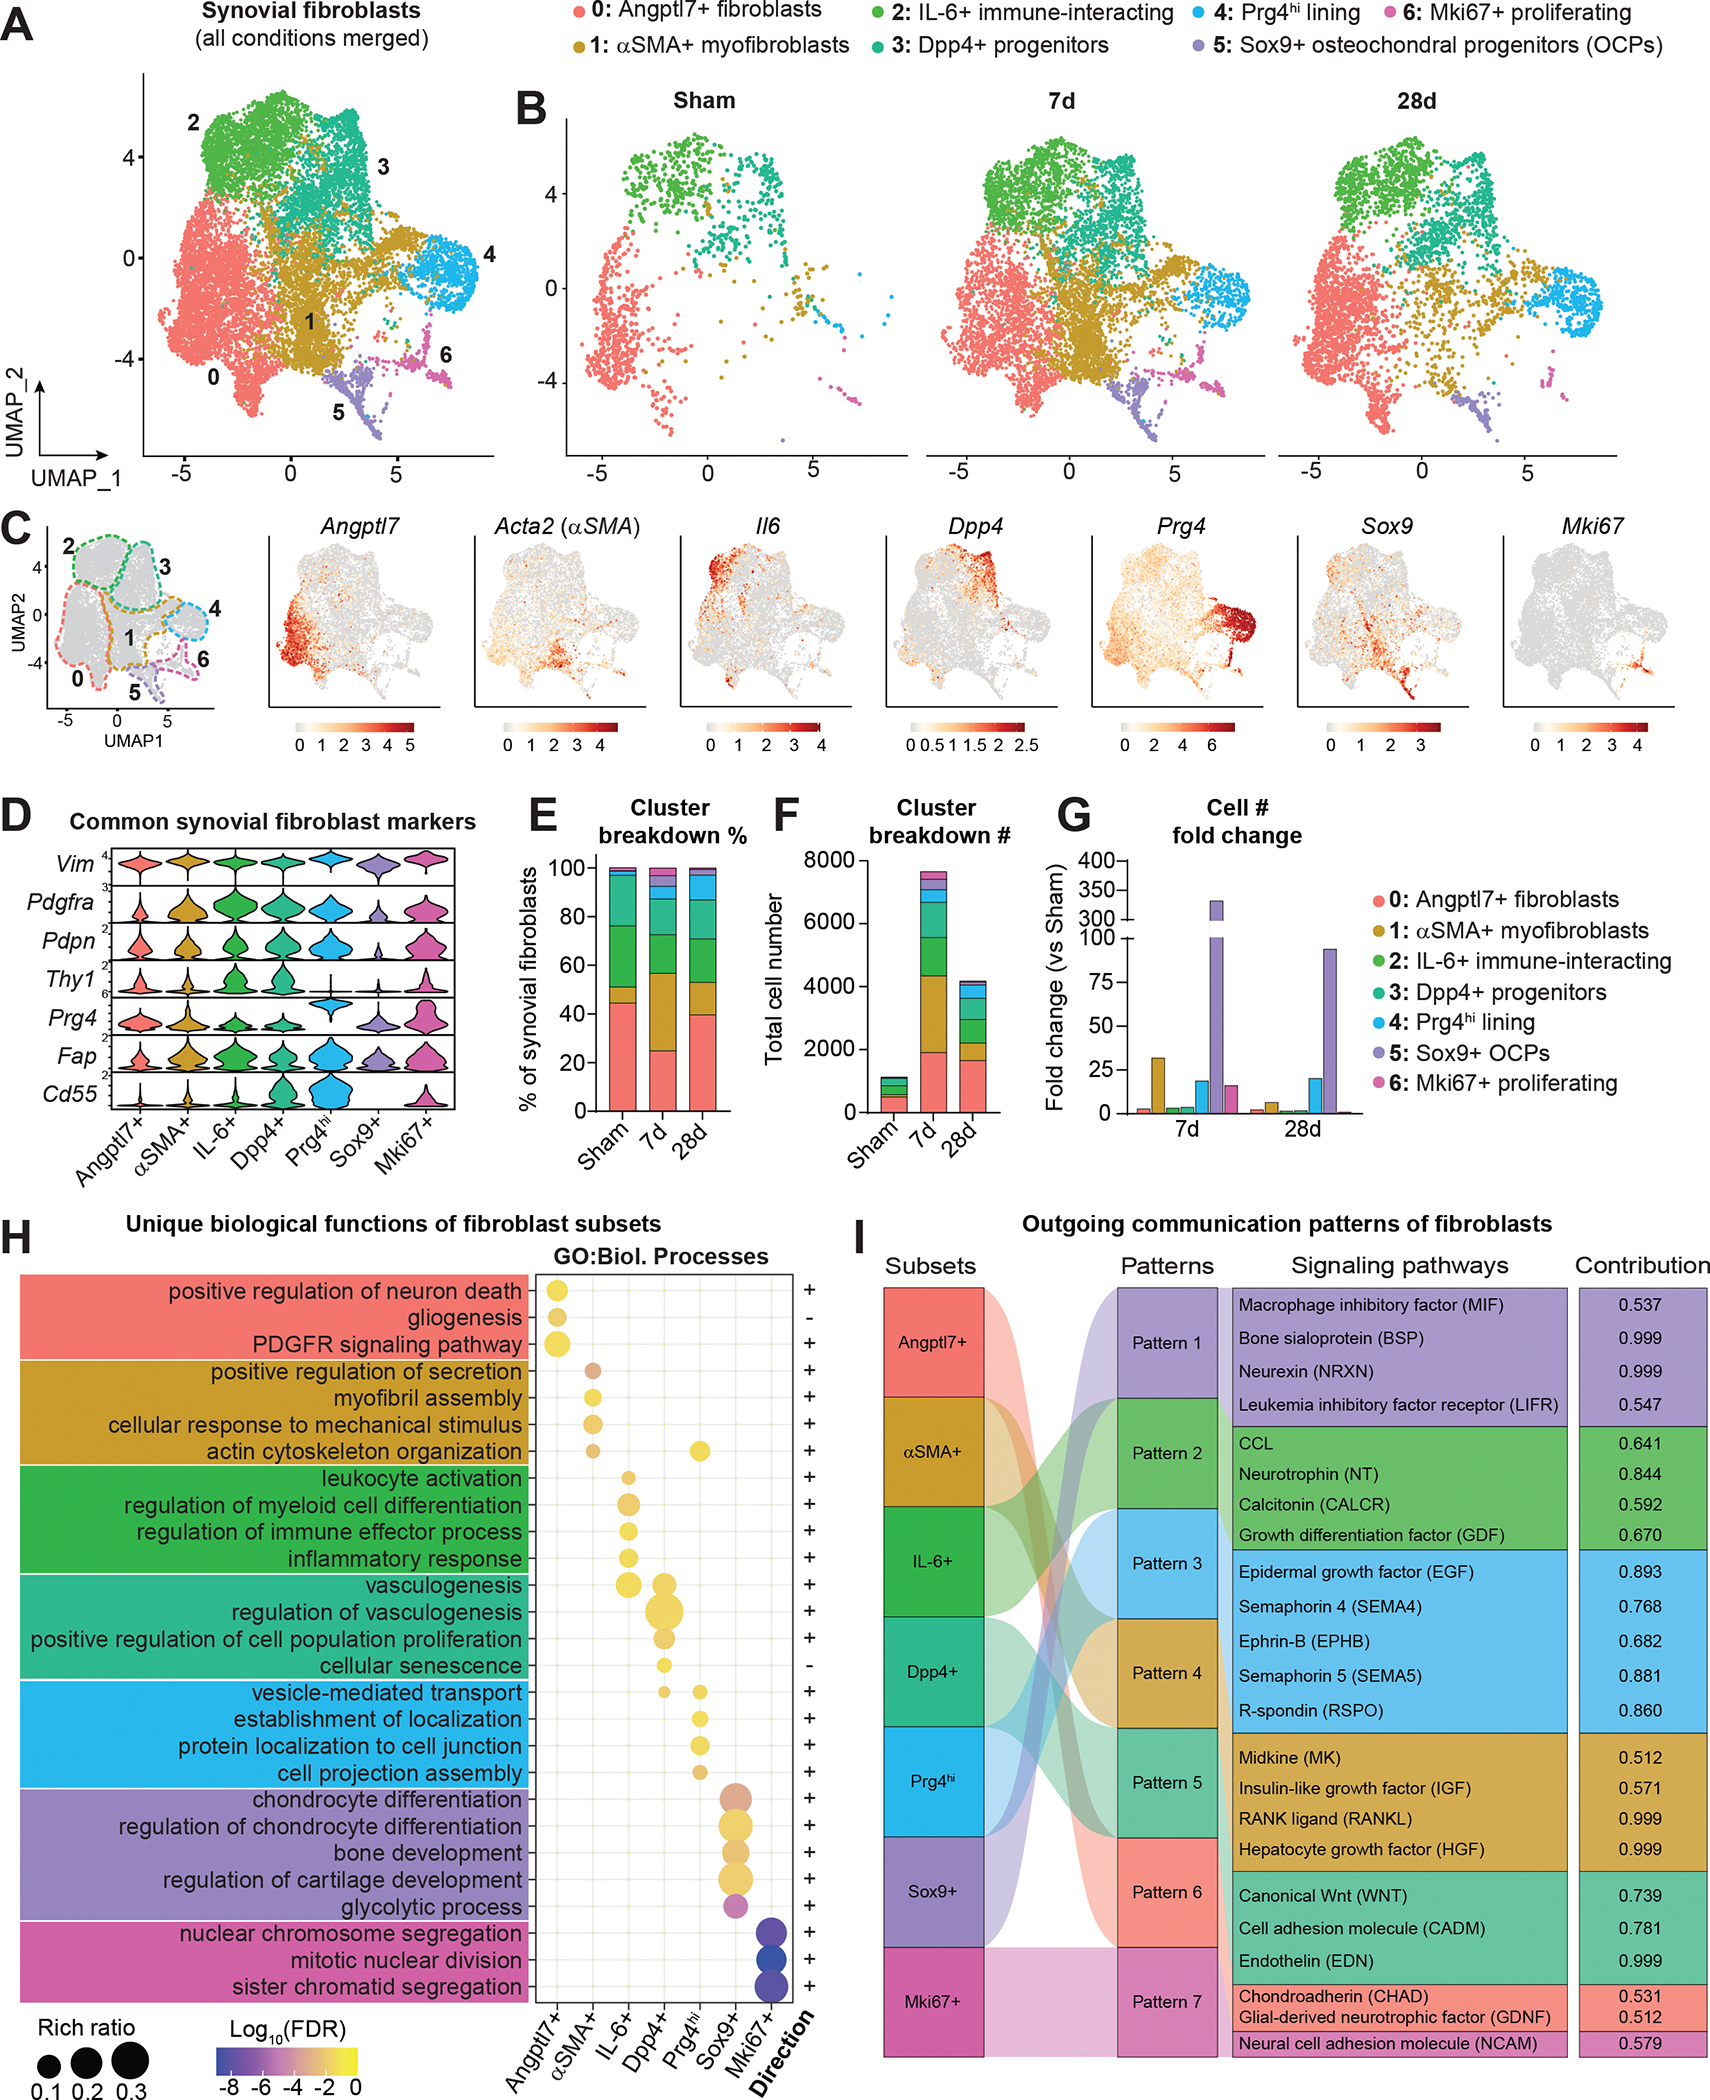
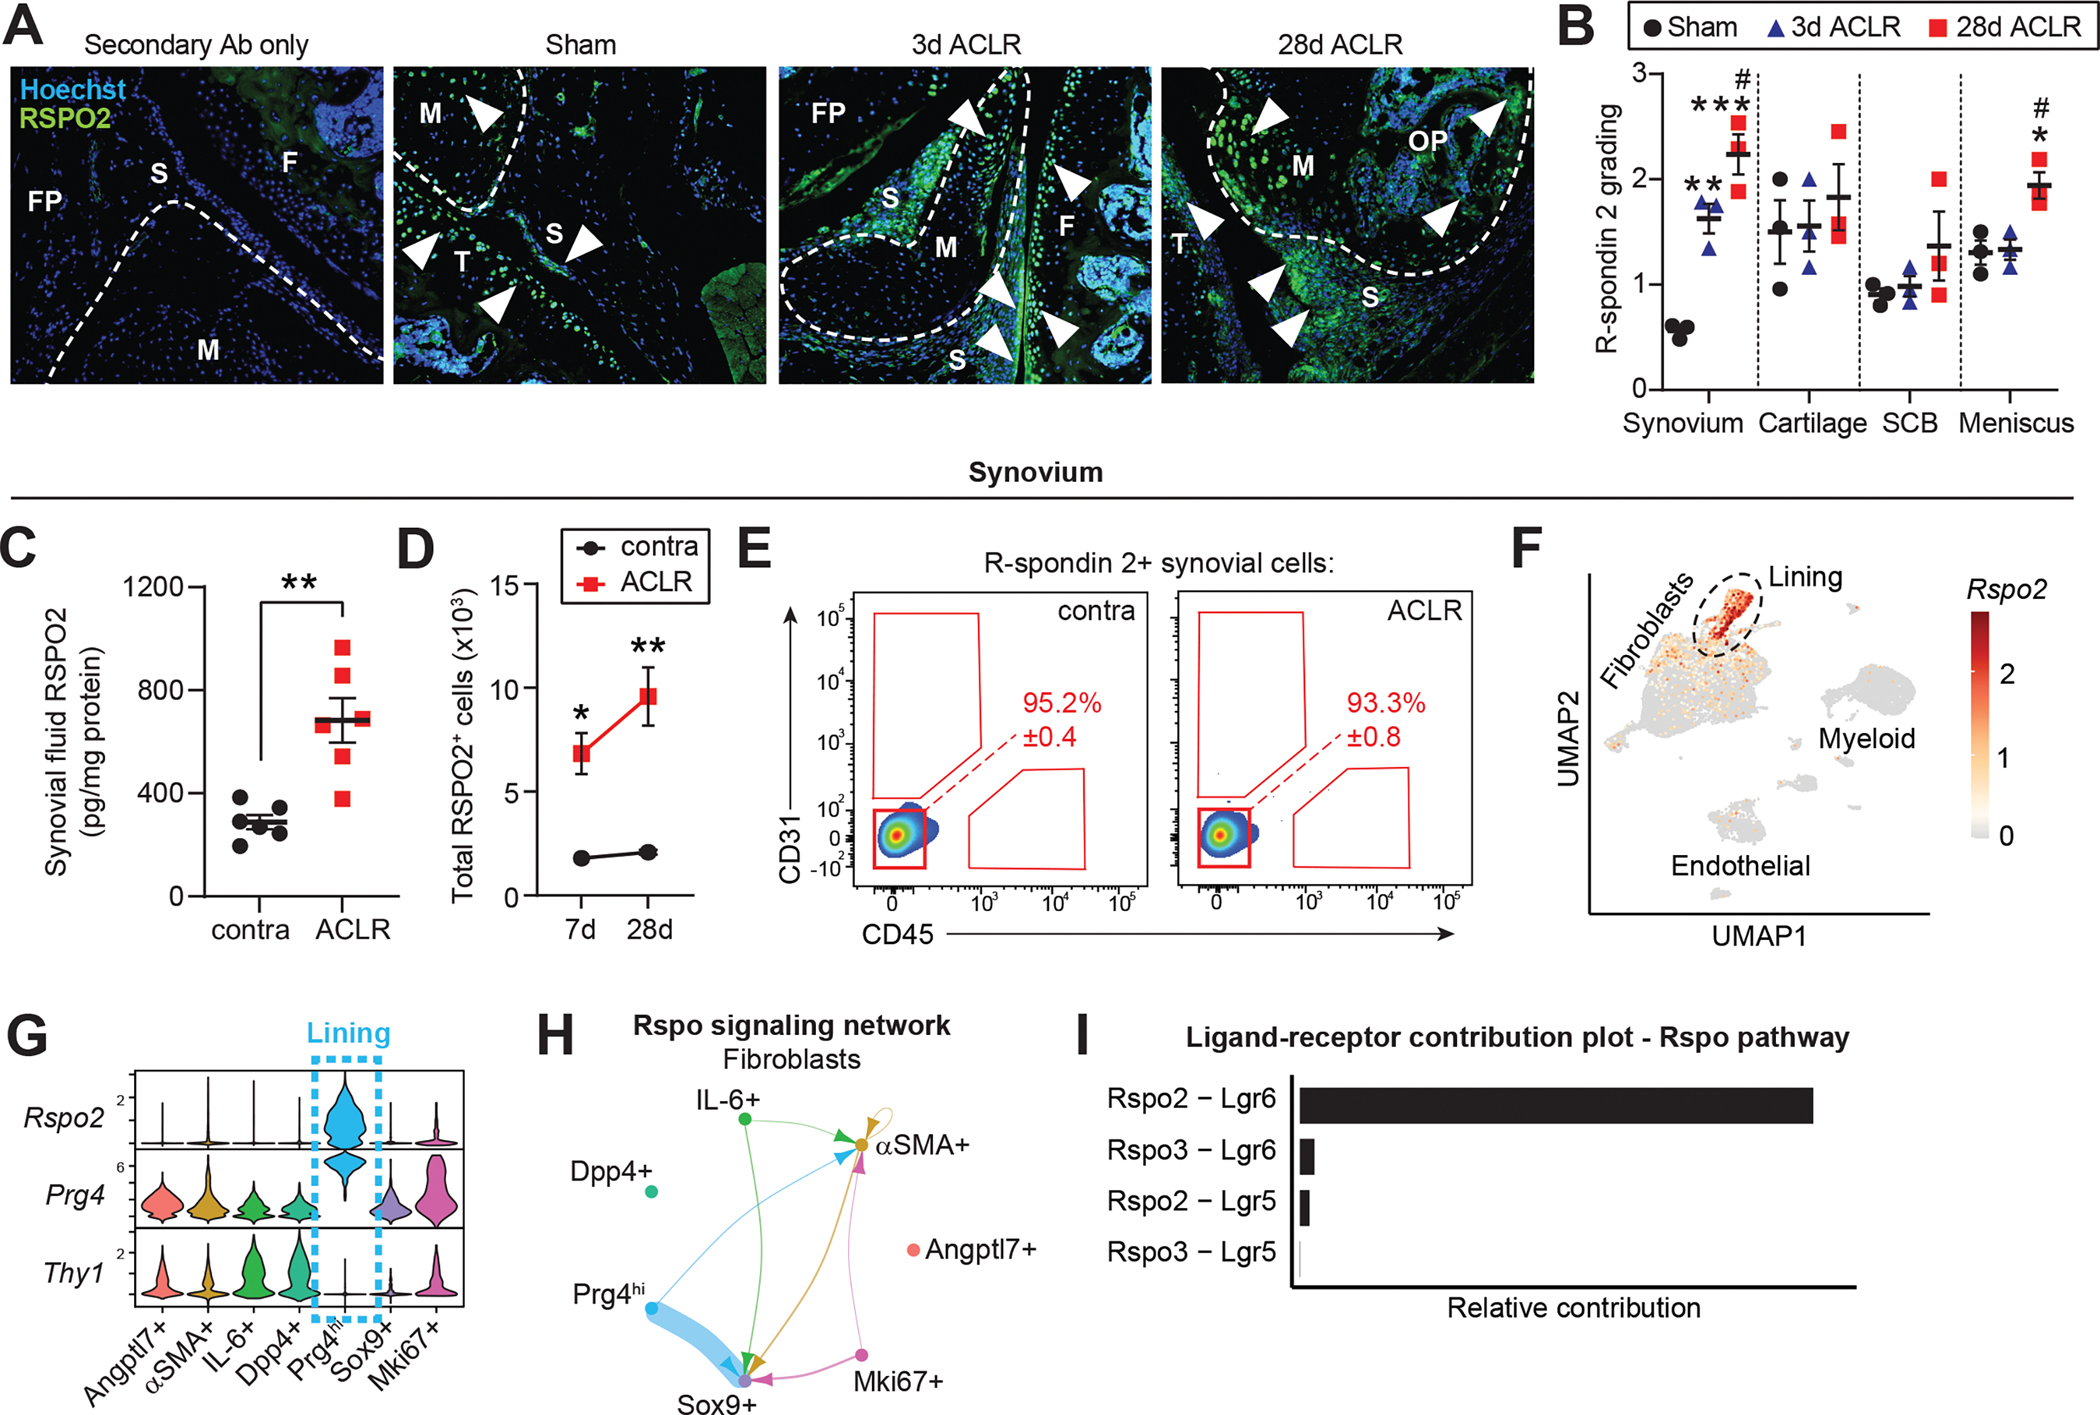
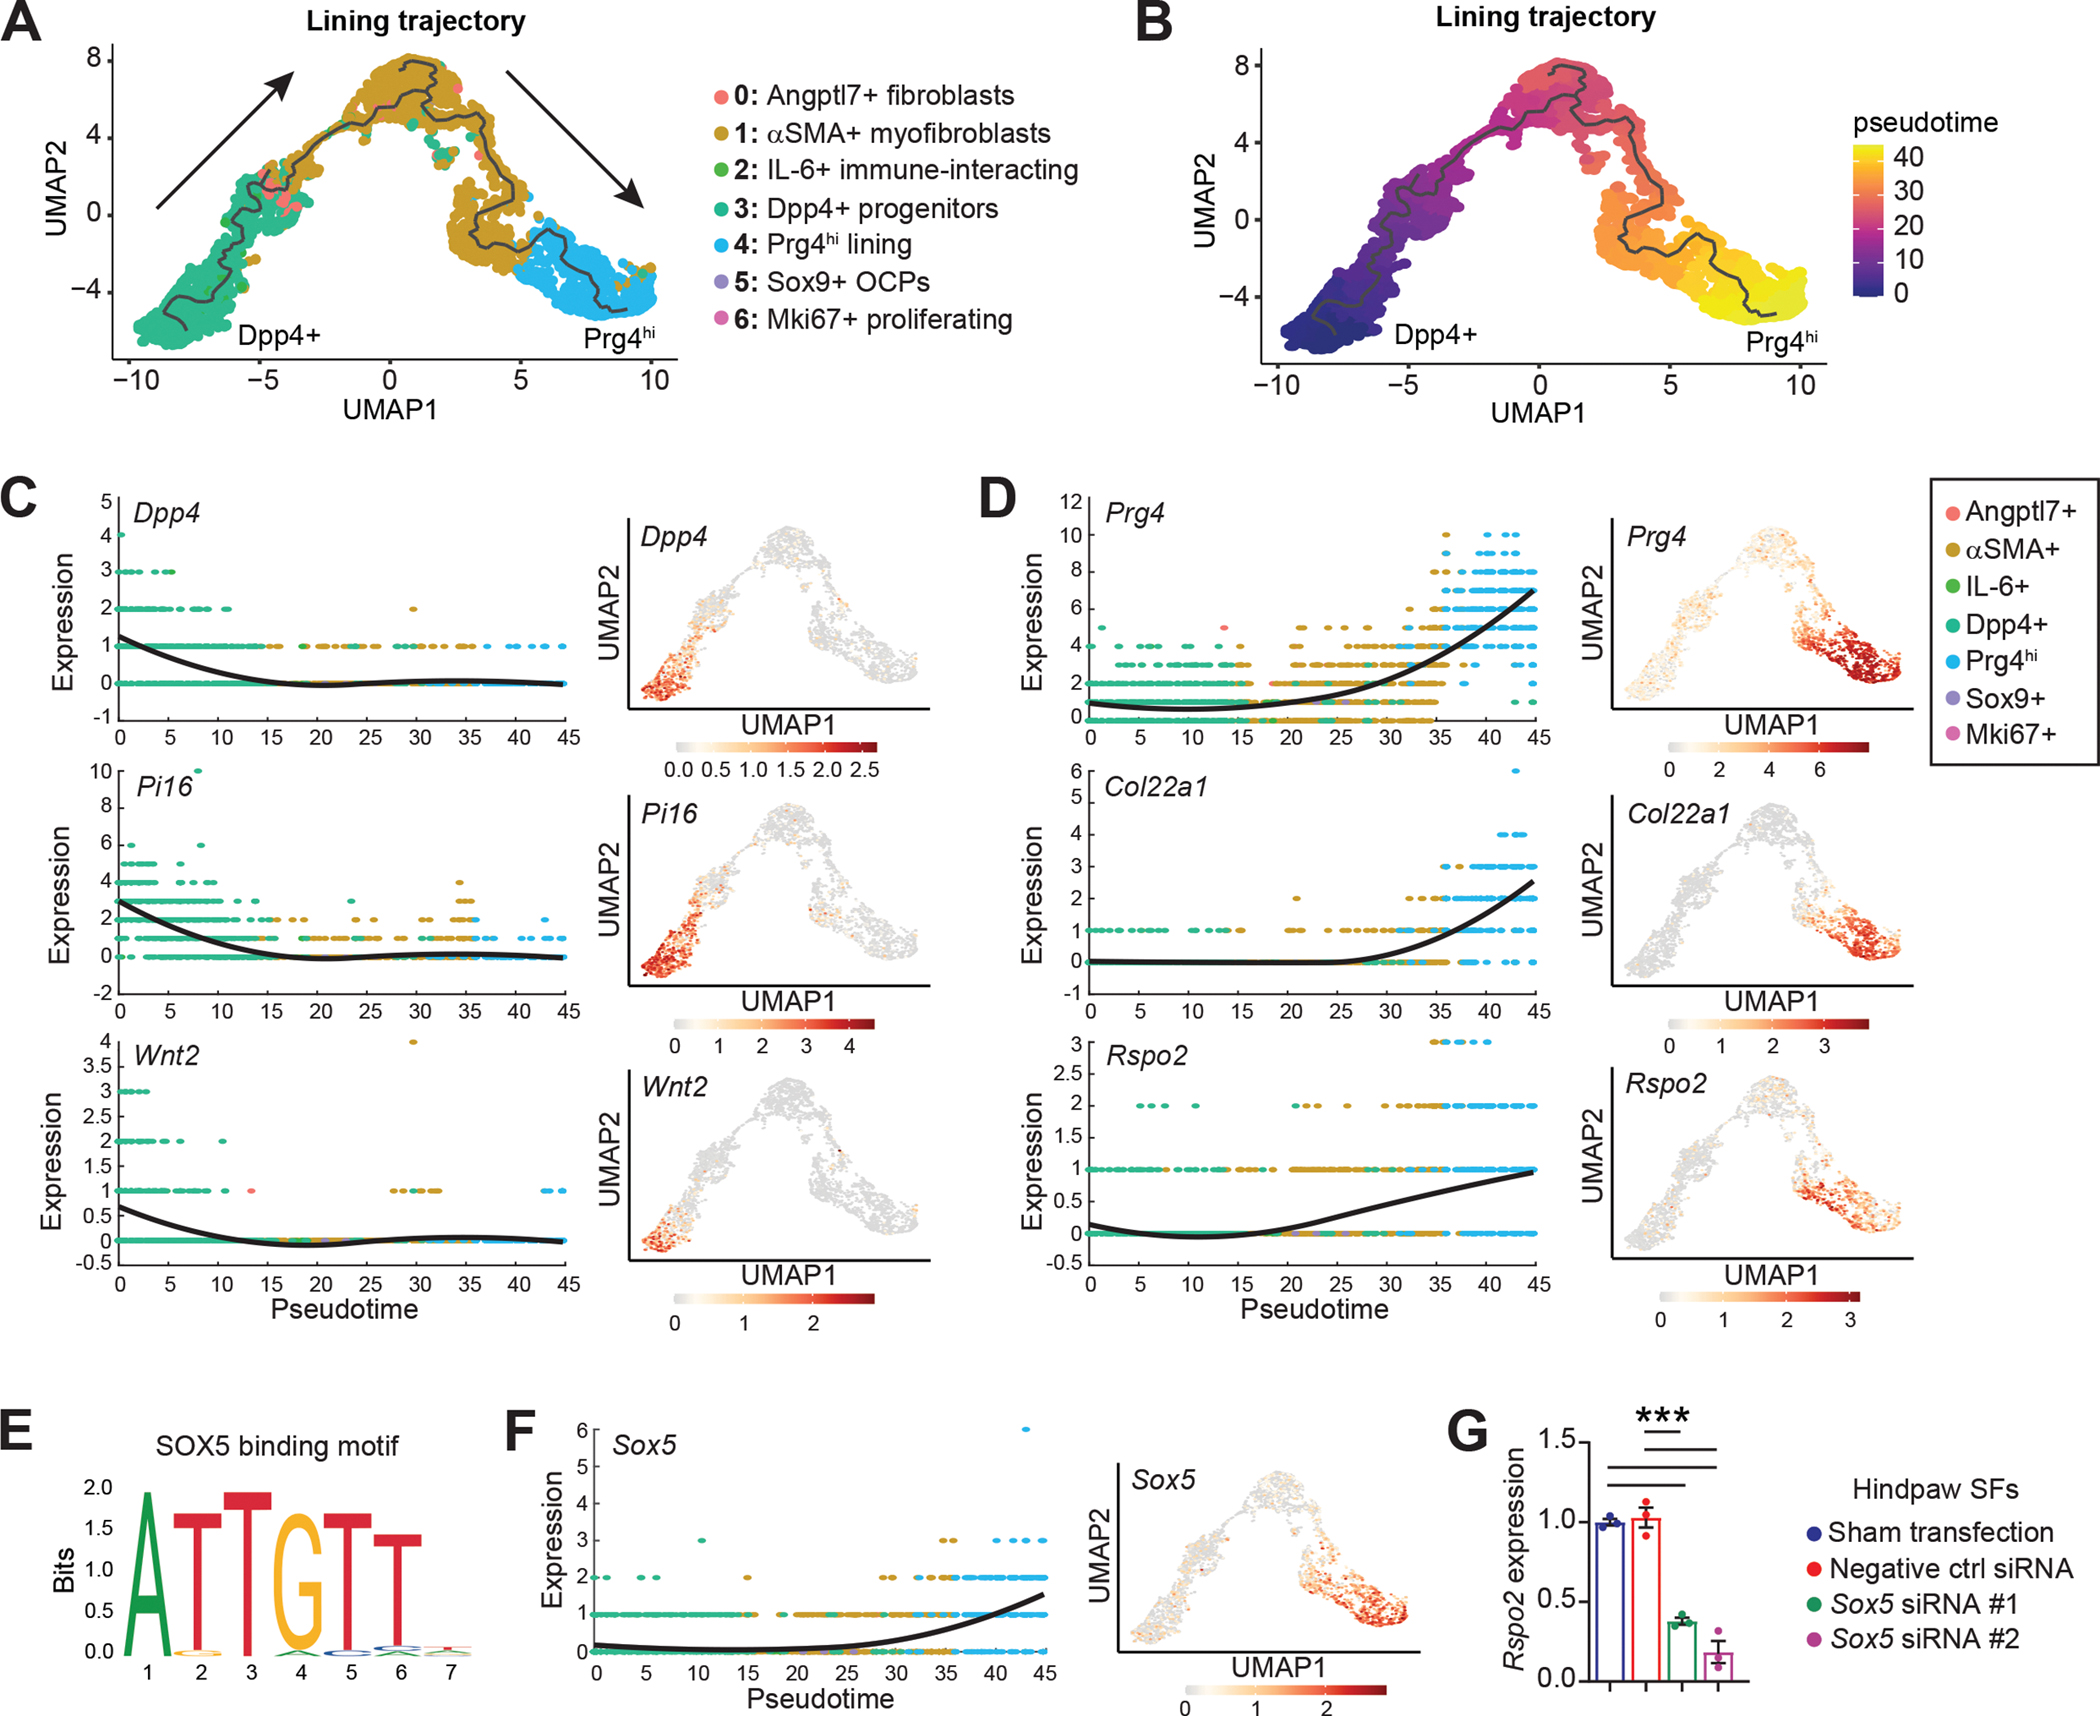
Results: We uncovered seven distinct functional subsets of synovial fibroblasts in healthy and injured synovium, and defined their temporal dynamics in early and established PTOA. Wnt/β-catenin signalling was overactive in PTOA synovium, and Rspo2 was strongly induced after injury and secreted exclusively by Prg4hi lining fibroblasts. Trajectory analyses predicted that Prg4hi lining fibroblasts arise from a pool of Dpp4+ mesenchymal progenitors in synovium, with SOX5 identified as a potential regulator of this emergence. We also showed that Rspo2 orchestrated pathological crosstalk between synovial fibroblasts, macrophages and chondrocytes.

Conclusions: Synovial fibroblasts assume distinct functional identities during PTOA in mice, and Prg4hi lining fibroblasts secrete Rspo2 that may drive pathological joint crosstalk after injury.

Keywords: fibroblasts; osteoarthritis; synovitis.


Conflict of interest statement

Competing interests: None declared.

Figures

Figure 1.
Figure 1.. Single-cell transcriptomic profiling of synovium reveals cellular heterogeneity in PTOA.
(A) UMAP plots showing reduced dimensionality projections of all synovial cells from Sham, 7d ACLR or 28d ACLR mice (20,422 cells, n=2 biological replicates per condition, each composed of one male and one female). Cell types are grouped by color and designated numbers, with annotations on the right. Major cell groups have dashed outlines. (B) Violin plots of synovial cell type marker genes. (C) Proportional breakdown of major synovial cell types in each condition. (D) Total abundance of major synovial cell types in each condition. (E) Global gene expression across conditions from pseudo-bulk analysis of scRNA-seq data of all synovial cells. (F) River plot from CellChat analysis showing outgoing signaling patterns from major synovial cell types and the pathways comprising each pattern (contribution score for each pathway is shown on the right). ACLR: anterior cruciate ligament rupture (injury model).
Figure 2.
Figure 2.. Identification of functionally distinct synovial fibroblast subsets.
(A) UMAP plot showing SFs and related cell types integrated across conditions using canonical correlation analysis (n=2 biological replicates per condition, as in Figure 1). Clusters have designated numbers and colors corresponding to their annotation (top). (B) SF UMAP plots split by condition. (C) UMAP plot of SFs showing cluster borders with colored, dashed outlines (left), and feature plots of marker genes used to designate the naming of each cluster. Color scales represent relative expression for each gene individually. (D) Violin plots showing expression levels of common SF marker genes across clusters. (E) Proportional breakdown (%) of each cluster across condition. (F) Total abundance (#) of cells in each cluster across conditions. (G) Fold change (relative to Sham) of cell number (#) in each cluster at 7d and 28d ACLR. (H) Pathway analysis using Gene Ontology (GO) Biological Processes showing unique functional terms for each cluster and the direction of each term. (I) River plot showing CellChat analysis of outgoing signaling patterns from SF subsets and the pathways comprising each pattern, and the contribution score of each pathway on the right. FDR: false discovery rate.
Figure 3.
Figure 3.. Canonical Wnt/β-catenin signaling is activated in synovium during PTOA.
(A-B) Circle plots showing canonical Wnt signaling communication between all synovial cell types (A) or SFs only (B), with directionality indicated by arrowheads. Lines are color-coded by source cell type and line width is proportional to interaction strength. (C) Pathway analysis using GO Biological Processes showing enriched canonical Wnt signaling terms in each SF cluster compared to all non-SFs. (D) Bubble plot showing expression levels of each Wnt ligand gene across major synovial cell types, and the proportion of cells in each cluster expressing the gene. Some Wnt ligand genes were not detected. (E) Heatmap showing Wnt ligand gene expression (z-score) in all synovial cells from Sham, 7d ACLR or 28d ACLR conditions. (F-J) Flow cytometry assessment of injured or contralateral (contra) synovium from Wnt-GFP reporter mice 7d ACLR (n=4 mice). (F) Total number of Wnt-GFP+ synovial cells. (G) Median fluorescence intensity (MFI) of GFP for all synovial cells. (H) Overlay of Wnt-GFP+ cells (green) from contra and 7d ACLR synovium showing their expression of CD31 and CD45. CD31− CD45− cells represent predominantly SFs in synovium. Green values represent the percentage of Wnt-GFP+ cells in each gate. (I) Total number of CD31− CD45− synovial cells that were Wnt-GFP+. (J) MFI of GFP for CD31− CD45− synovial cells. Paired two-tailed student’s t-tests were used for F, G, I, and J, where *P<0.05, **P<0.01. Error bars are mean ± SEM. qval: P value adjusted for false discovery rate.
Figure 4.
Figure 4.. The canonical Wnt agonist R-spondin 2 is strongly and selectively induced during PTOA.
(A) Immunofluorescent staining of R-spondin 2 (RSPO2) in joint sections from Sham, 3d or 28d ACLR. A negative control with only secondary antibody (Ab) staining is included (left). Nuclei were counterstained with Hoechst 33342. White arrowheads indicate areas of RSPO2 expression. Representative images are shown from n=3 mice per condition. FP: fat pad; S: synovium; F: femur; T: tibia; M: meniscus; OP: osteophyte. (B) Qualitative grading of RSPO2 staining in (A) for synovium, cartilage, subchondral bone (SCB), and meniscus. (C) RSPO2 protein levels in synovial fluid from contralateral (contra) and 28d ACLR (n=6 mice), measured by ELISA. Amount of RSPO2 was normalized to total protein in each synovial fluid sample. (D-E) Assessment of RSPO2+ cells from contra, 7d ACLR or 28d ACLR synovium by flow cytometry (n=3 mice per condition). (D) Total number of RSPO2+ cells in synovium. (E) Expression of CD31 and CD45 in RSPO2+ synovial cells. Mean percentage of RSPO2+ cells in the CD31− CD45− gate is shown in red ± SEM. (F) Feature plot showing expression of Rspo2 in all synovial cells by scRNA-seq. Lining SFs are outlined. (G) Violin plots of Rspo2, the sublining SF marker Thy1, and the lining marker Prg4 across SF subsets. (H) Circle plot showing Rspo signaling communication between SF subsets, with directionality indicated by arrowheads. Lines are color-coded by source cell type and line width is proportional to interaction strength. (I) Relative contribution of Rspo pathway ligand-receptor pairs for the circle plot of SFs in (H). For (B), one-way ANOVA with multiple comparisons and Tukey’s post-hoc correction was used to assess significance in each tissue compartment (*P<0.05, **P<0.01, ***P<0.001 compared to Sham; #P<0.05 compared to 3d ACLR). For (C), a paired two-tailed student’s t-test was used with **P<0.01. For (D), a two-way ANOVA with multiple comparisons and Tukey’s post-hoc correction was used, where *P<0.05, **P<0.01 compared to the corresponding contralateral. For B-D, error bars are mean ± SEM.
Figure 5.
Figure 5.. Synovial lining fibroblasts arise from Dpp4+ mesenchymal progenitors.
(A) Trajectory analysis of Prg4hi lining SFs. The black line represents the trajectory calculated by Monocle3 and cells are color-coded according to their cluster. Arrows indicate progression of pseudotime derived from (B). (B) Pseudotime plot for the Dpp4+ to Prg4hi lining SF trajectory in (A), calculated using Monocle3 (C-D) Pseudotime regression plots (left) and the corresponding feature plots mapped onto the lining trajectory UMAP (right), for genes associated with the (C) Dpp4+ root (Dpp4, Pi16, Wnt2) or (D) Prg4hi terminus (Prg4, Col22a1, Rspo2) of the trajectory. (E-F) Transcription factor motif analysis in Module 2 (from Figure S10A) of the Prg4hi lining trajectory, using RcisTarget. (E) Binding motif for SOX5 (JASPAR_MA0087.1). (F) Pseudotime regression plot (left) and feature plot (right) for Sox5 in the Dpp4+ to Prg4hi trajectory.(G) Hindpaw SFs were transfected with a negative control siRNA, siRNA for Sox5 (#1 and #2), or untransfected (Sham), then Rspo2 expression assessed after 48 h (n=3 biological replicates). Atp5b was used as the housekeeper gene, and the Sham transfection condition was set to 1. For G, one-way ANOVA with multiple comparisons and Tukey’s post hoc testing was performed where ***P<0.001. Error bars are mean ± SEM.
Figure 6.
Figure 6.. R-spondin 2 is sufficient to induce some pathological features in healthy joints of mice.
(A) Experimental design. Male and female C57Bl6/J mice (n=5) were given intra-articular injections with R-spondin 2 (RSPO2, 200 ng/mL, right limb) or PBS (left limb) for five consecutive days. 28 days later, knee hyperalgesia and matrix metalloproteinase (MMP) activity were assessed, then whole joint histological sections were graded for OA severity and synovitis. (B) Knee hyperalgesia testing of contralateral (contra, PBS-treated) or RSPO2-treated limbs 28d after first injection. Paired limbs are connected by lines. (C) MMP activity as measured by near-infrared imaging of MMPSense680 probe. Representative intensity image (left) and quantitation of signal (right). Paired limbs are connected by lines. (D-G) PTOA (D) and synovitis (F) severity scoring(63, 64) for contralateral versus RSPO2-injected limbs, with paired limbs connected by lines. Safranin O/Fast Green stained sections imaged at 10x magnification that are representative of (E) PTOA score or (G) synovitis score. Highlighted features are proteoglycan and matrix loss (black arrows), synovial lining hyperplasia (green arrows), synovial fibrosis (blue arrows), sub-synovial inflammatory infiltrate (red arrows), and cortical bone erosion (black outline arrows). Scale bar: 100 μm. For B, C, D and F, paired two-tailed student’s t-tests were used, where **P<0.01. F: femur; T: tibia; M: meniscus; S: synovium.
Figure 7.
Figure 7.. R-spondin 2 orchestrates pathological crosstalk between joint-resident cell types.
(A) Secreted RSPO2 protein levels in conditioned medium from cultured knee-derived SFs treated for 48 h with vehicle (veh), TNFα (10 ng/mL) or IL-1β (10 ng/mL). (B) Feature plots of Lgr receptors (Lgr4–6) in SFs. Color scales are not equivalent between plots. Cluster borders are shown on the right. (C) Hindpaw-derived SFs from Wnt-GFP reporter mice were treated with veh or RSPO2 (200 ng/mL) for 24 h. SFs were analyzed by flow cytometry to assess Wnt signaling activity (Wnt-GFP MFI, left) and the total percentage of Wnt-GFP+ cells (right). WT SFs (no reporter) were used as a negative control. Two biological replicates were performed. (D) Hindpaw-derived SFs were treated for 4 h with veh, C59 (0.25 μM), RSPO2 (200 ng/mL), or CHIR99021 (10 μM) on 1.5 kPa Ibidi soft substrate dishes (n=3 biological replicates). Immunocytochemical staining of non-phosphorylated/active β-catenin was performed to assess nuclear localization. Left: percentage of cells with nuclei positively stained for β-catenin. Right: Nuclear β-catenin staining intensity. (E) Hindpaw-derived SFs were treated for 24 h with veh, RSPO2 (200 ng/mL), Mianserin (20 μM), or RSPO2+Mianserin (n=8–10 biological replicates). Expression of Axin2, Lef1 and Rspo2 was normalized to Atp5b levels, and veh samples were set to 1. (F) Bone marrow-derived macrophages (BMDM) were treated for 8 h with veh or RSPO2 (200 ng/mL) (n=3 biological replicates). Expression of Axin2, Lef1, Il1b, Tnf, Mrc1 and Il10 were normalized to Gapdh levels, and veh samples were set to 1. (G) Schematic showing experimental design of SF-BMDM conditioned media treatment in (H). (H) Hindpaw-derived SFs were treated with vehicle, RPSO2 (200 ng/mL), Mianserin (20 μM), or RSPO2+Mianserin. After 6 h, treatment media was removed, cells were washed and replenished with normal SF media for another 18 h (24 h total). SF conditioned media was harvested and directly treated to BMDM for 8 h in tandem with M0 polarization (PBS, middle), M1 polarization (10 ng/mL IL-1β, left), or M2 polarization (10 ng/mL IL-4, right) (n=3 biological replicates per condition). A composite M1:M2 polarization score was calculated based on the expression of M1 (Il1b, Il6, Nos2) and M2 (Mrc1, Il10, Arg1) genes by qPCR. Gapdh was used as the housekeeper gene. For A, E and H, one-way ANOVA with multiple comparisons and Tukey’s post hoc testing was performed where *P<0.05, **P<0.01, ***P<0.001. For D and E, paired two-tailed student’s t-tests were performed where *P<0.05. Error bars are mean ± SEM. n.s.: not significant.

Comment in

References

    1. Lieberthal J, Sambamurthy N, Scanzello CR. Inflammation in joint injury and post-traumatic osteoarthritis. Osteoarthr. Cartil. 2015;23(11):1825–34. - PMC - PubMed
    1. Zhang L, Xing R, Huang Z, Ding L, Zhang L, Li M, et al. Synovial Fibrosis Involvement in Osteoarthritis. Front. Med. 2021;8. - PMC - PubMed
    1. Blom AB, van Lent PL, Holthuysen AE, van der Kraan PM, Roth J, van Rooijen N, et al. Synovial lining macrophages mediate osteophyte formation during experimental osteoarthritis. Osteoarthr. Cartil. 2004;12(8):627–35. - PubMed
    1. Wei K, Korsunsky I, Marshall JL, Gao A, Watts GFM, Major T, et al. Notch signalling drives synovial fibroblast identity and arthritis pathology. Nature. 2020;582(7811):259–64. - PMC - PubMed
    1. Zhang F, Wei K, Slowikowski K, Fonseka CY, Rao DA, Kelly S, et al. Defining inflammatory cell states in rheumatoid arthritis joint synovial tissues by integrating single-cell transcriptomics and mass cytometry. Nat. Immunol. 2019;20(7):928–42. - PMC - PubMed