. 2022 Sep 29;13(1):5731.
doi: 10.1038/s41467-022-33397-4.

Deciphering microbial gene function using natural language processing

Affiliations

Deciphering microbial gene function using natural language processing

Danielle Miller et al. Nat Commun. .

Abstract

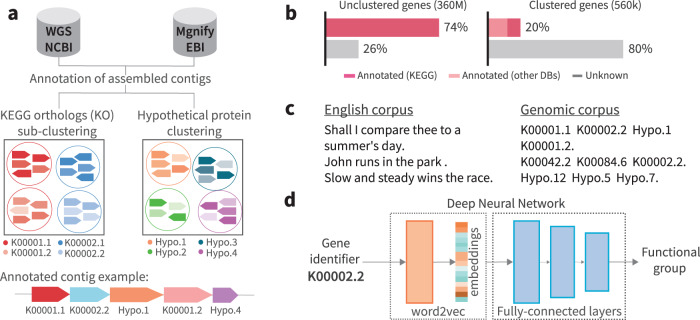
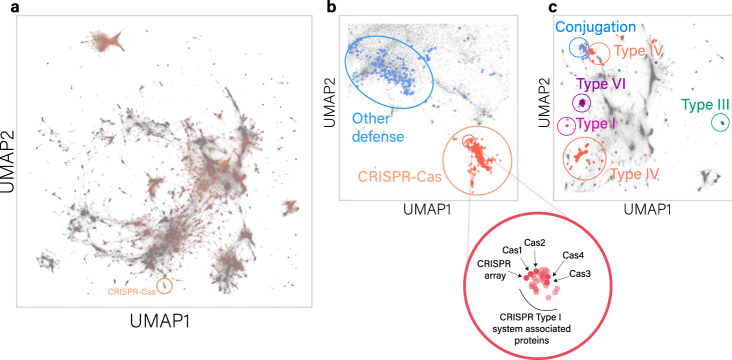
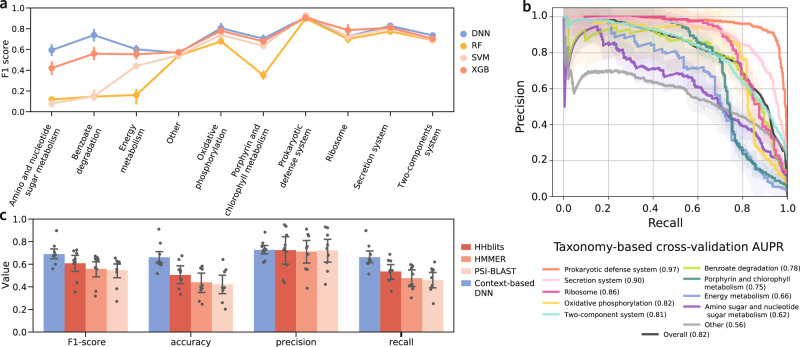
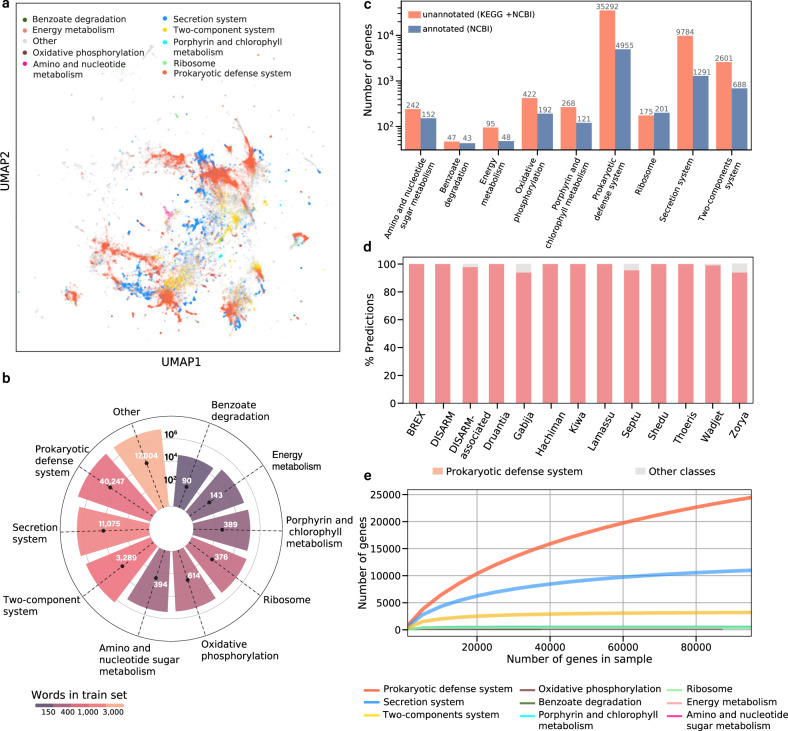
Revealing the function of uncharacterized genes is a fundamental challenge in an era of ever-increasing volumes of sequencing data. Here, we present a concept for tackling this challenge using deep learning methodologies adopted from natural language processing (NLP). We repurpose NLP algorithms to model "gene semantics" based on a biological corpus of more than 360 million microbial genes within their genomic context. We use the language models to predict functional categories for 56,617 genes and find that out of 1369 genes associated with recently discovered defense systems, 98% are inferred correctly. We then systematically evaluate the "discovery potential" of different functional categories, pinpointing those with the most genes yet to be characterized. Finally, we demonstrate our method's ability to discover systems associated with microbial interaction and defense. Our results highlight that combining microbial genomics and language models is a promising avenue for revealing gene functions in microbes.


Conflict of interest statement

The authors declare no competing interests.

Figures

Fig. 1
Fig. 1. Model workflow.
a Data processing and annotation. Assembled contigs from public databases were downloaded and underwent gene calling and annotation. Both annotated and unannotated genes were clustered into gene families. b Distribution of annotated and hypothetical genes in the corpus. The left bar chart represents all ~360 million genes used in the corpus. The right bar chart represents ~560,000 unique gene families (i.e., the corpus “vocabulary”). c A comparison between English and genomic corpora. The “sentences” in the genomic corpus are contigs, which are composed of gene families identifiers as “words”. d Embedding generation and function prediction pipeline. Embeddings (numeric vector representations) are generated by the word2vec algorithm and serve as the input to a deep neural network for gene function classification.
Fig. 2
Fig. 2. A two-dimensional representation of the space spanned by gene annotation embeddings.
a Global gene embedding space, including all 563,589 gene families. Each dot in the space represents a gene family, where light red dots represent annotated families and gray dots represent unannotated gene families. The orange circle marks the region that contains most CRISPR-Cas genes (magnified in panel b alongside other defense genes). b Regions of defense systems clusters marked in circles: cas genes are in light red, and light blue dots represent known prokaryotic defense genes. The red circle focuses on the upper CRISPR cluster, enriched with type I CRISPR-Cas system genes. c The region encompassing most annotated secretion system clusters color-coded by system type. Source data are provided as a Source Data file.
Fig. 3
Fig. 3. Embedding-based function prediction performance assessment and benchmarking.
a Classifier comparison. F1 scores were obtained for each category using the leave-one-taxonomic-group-out cross-validation. Each dot represents the average with error bars of ±1 SD obtained from the n = 5 folds. DNN deep neural network, RF random forest, SVM support vector machine, XGB XGBoost. b Precision–recall curves per functional category calculated using leave-one-taxonomic-group-out cross-validation (see also Supplementary Fig. 2). The “Overall” group refers to the micro-average of all categories combined (i.e., aggregating the predictions of all categories to compute the average). The numeric values of the areas under the curves are denoted for each functional category in the figure legend in parenthesis. Each category line presents the micro-average of the cross-validation folds with ±1 SD. c Comparison of our approach against remote-homology search approaches, based on leave-one-KO-out cross-validation. Evaluation metrics were obtained for each of the nine functional categories that are indicated by gray dots. Bar height is the average score with error bars of ±1 SD. Source data are provided as a Source Data file.
Fig. 4
Fig. 4. Functional prediction of hypothetical gene families.
a The complete prediction space. The gene families are color-coded based on the predicted functional categories. b Predictions per functional category. Each bar represents the total number of hypothetical genes assigned to a category. The black dot represents the number of hypothetical gene families that received the category prediction. The number of predicted families is explicitly stated next to each dot. Bars are color-coded by the number of words per functional category used to train the model. c The number of genes that received reliable predictions in each category, divided into genes with and without informative annotation in NCBI NR. d Functional prediction for gene families belonging to recently discovered defense systems. e Rarefaction analysis. Each line corresponds to a functional category. The x-axis represents the number of sampled genes, and the y-axis states the number of gene families with a predicted functional category in the subsample. Source data are provided as a Source Data file.
Fig. 5
Fig. 5. Predicted systems.
For all gene operons, known annotations are denoted below the gene illustration, and domains of unannotated genes are marked with arrows above the gene. a Predicted secretion-related operons abundant in three Clostridium genera. The genes that were predicted by our approach are marked by the yellow/orange gradient coloring. b A distant variant of the type IV pilus system in two representatives of the Veillonella genus. The genes predicted by our method are colored in shades of blue. The pil genes are annotated type IV pilus genes. c Candidate defense system found in multiple bacteria, with representatives from four genomes. d The bacterial distribution of the systems presented in c. The upper panel includes the bacterial tree of life, color-coded by the presence of each system’s type. The lower panel illustrates the taxonomic distribution of each system on the order level. Source data are provided as a Source Data file.

References

    1. Rappé MS, Giovannoni SJ. The uncultured microbial majority. Annu Rev. Microbiol. 2003;57:369–394. - PubMed
    1. Parks DH, et al. Recovery of nearly 8,000 metagenome-assembled genomes substantially expands the tree of life. Nat. Microbiol. 2017;2:1533–1542. - PubMed
    1. Burstein D, et al. New CRISPR–Cas systems from uncultivated microbes. Nature. 2017;542:237–241. - PMC - PubMed
    1. Pawlowski AC, et al. A diverse intrinsic antibiotic resistome from a cave bacterium. Nat. Commun. 2016;7:13803. - PMC - PubMed
    1. Fridman CM, Keppel K, Gerlic M, Bosis E, Salomon D. A comparative genomics methodology reveals a widespread family of membrane-disrupting T6SS effectors. Nat. Commun. 2020;11:1085. - PMC - PubMed

Publication types