. 2022 Nov;6(11):1634-1643.
doi: 10.1038/s41559-022-01885-x. Epub 2022 Sep 29.

Divergent evolutionary trajectories of bryophytes and tracheophytes from a complex common ancestor of land plants

Affiliations

Divergent evolutionary trajectories of bryophytes and tracheophytes from a complex common ancestor of land plants

Brogan J Harris et al. Nat Ecol Evol. 2022 Nov.

Abstract

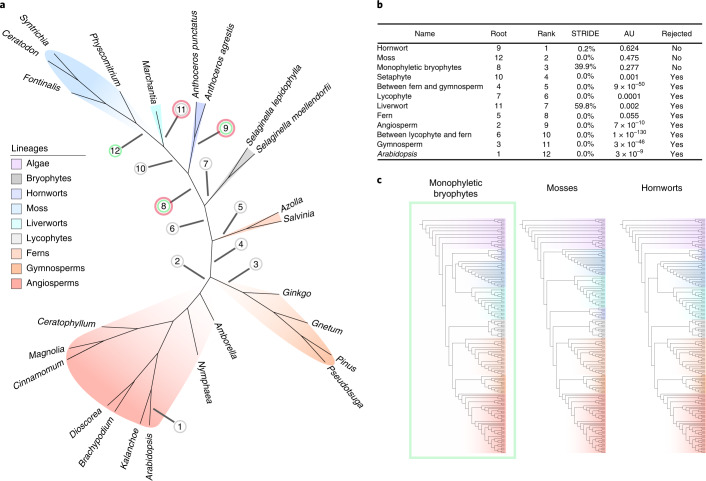
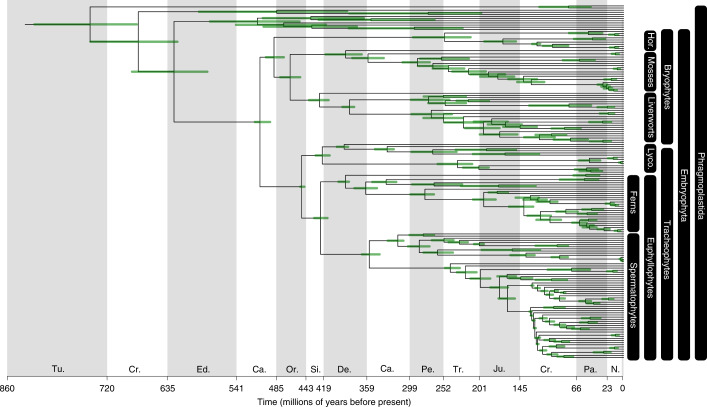
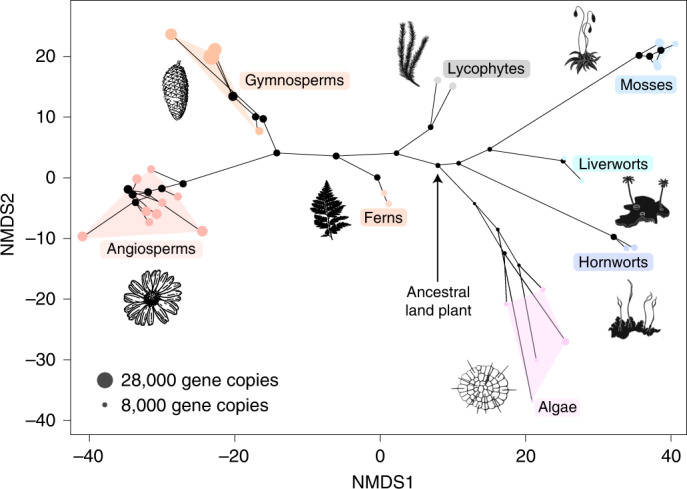
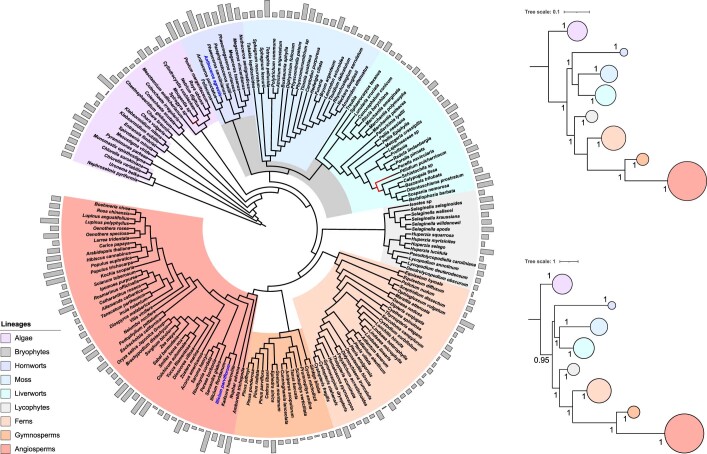
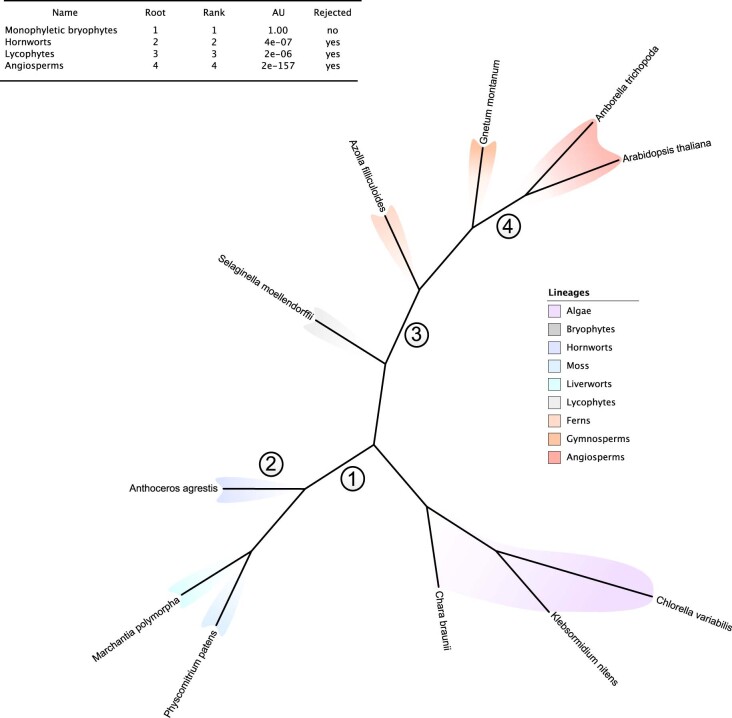
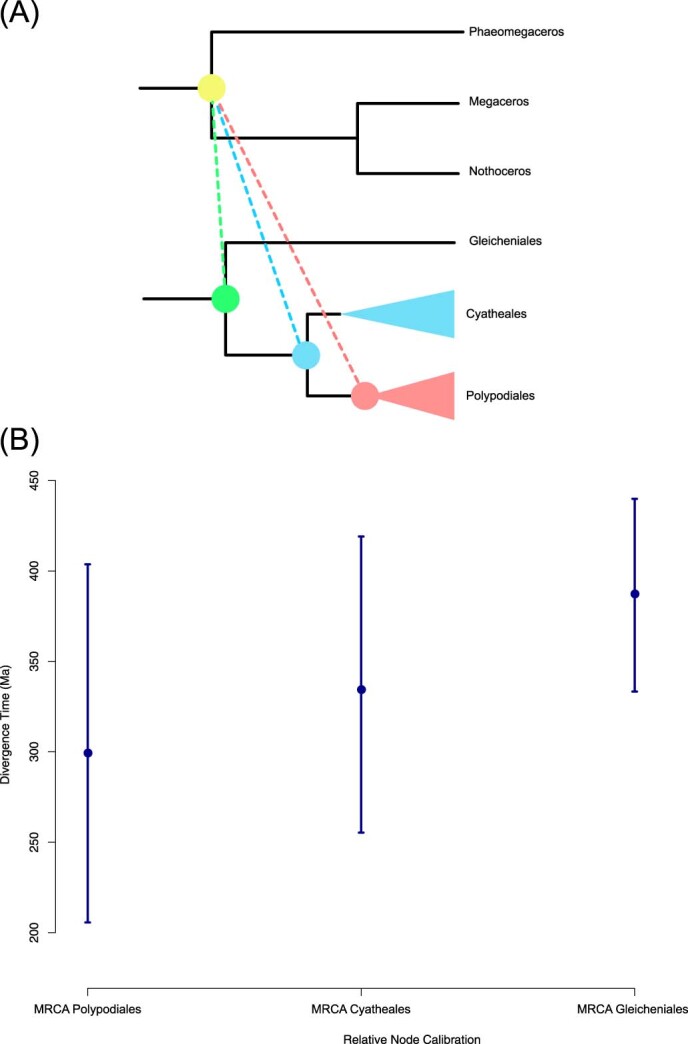
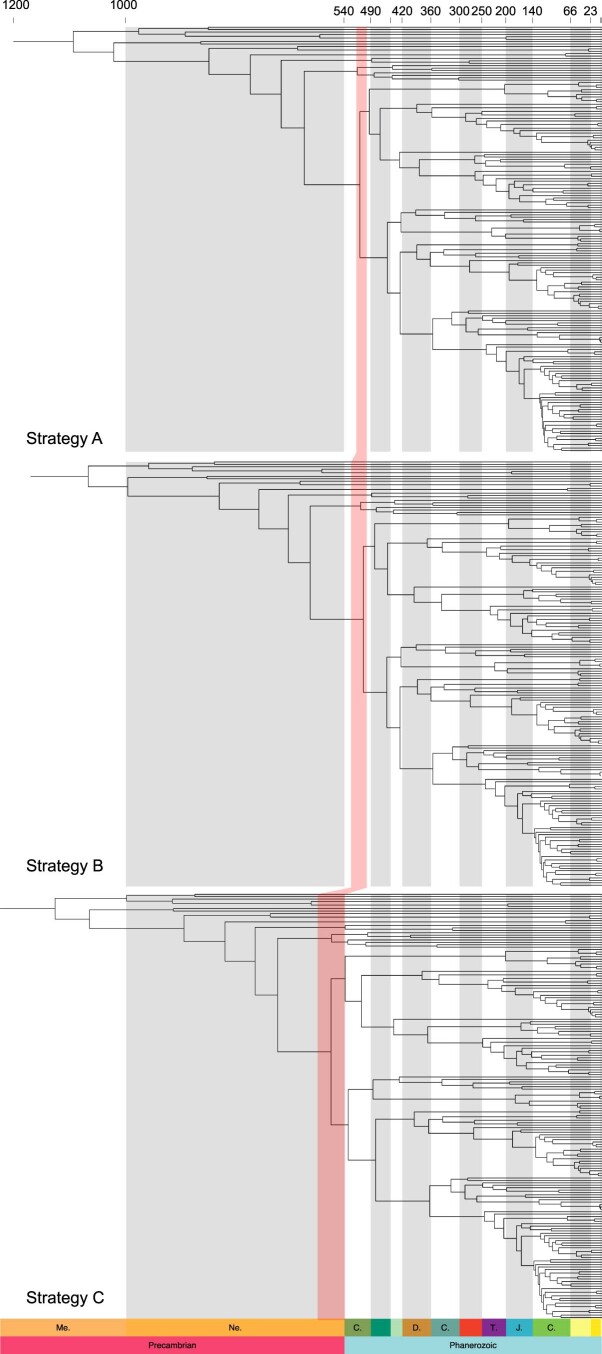
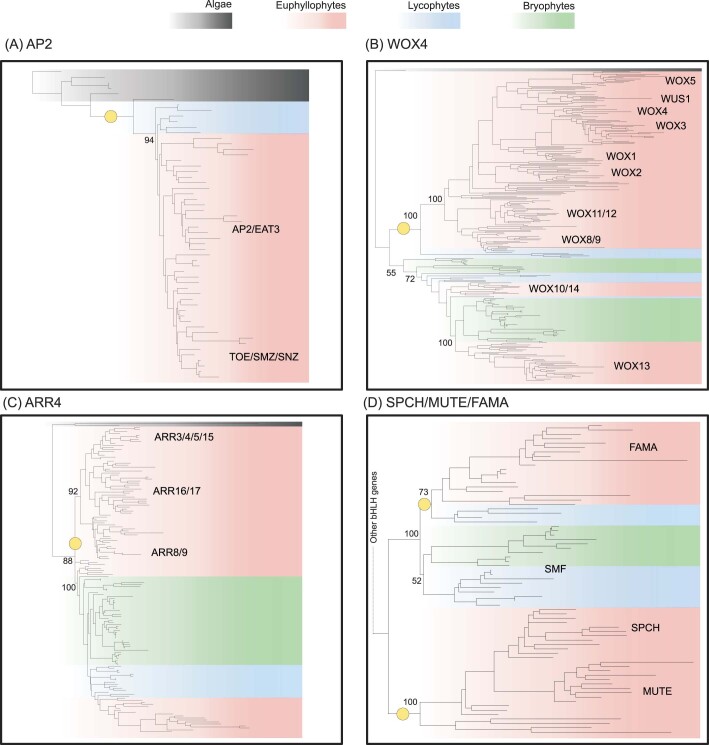
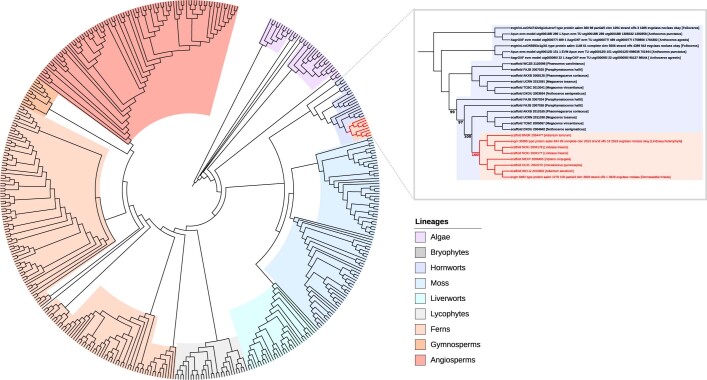
The origin of plants and their colonization of land fundamentally transformed the terrestrial environment. Here we elucidate the basis of this formative episode in Earth history through patterns of lineage, gene and genome evolution. We use new fossil calibrations, a relative clade age calibration (informed by horizontal gene transfer) and new phylogenomic methods for mapping gene family origins. Distinct rooting strategies resolve tracheophytes (vascular plants) and bryophytes (non-vascular plants) as monophyletic sister groups that diverged during the Cambrian, 515-494 million years ago. The embryophyte stem is characterized by a burst of gene innovation, while bryophytes subsequently experienced an equally dramatic episode of reductive genome evolution in which they lost genes associated with the elaboration of vasculature and the stomatal complex. Overall, our analyses reveal that extant tracheophytes and bryophytes are both highly derived from a more complex ancestral land plant. Understanding the origin of land plants requires tracing character evolution across a diversity of modern lineages.


Conflict of interest statement

The authors declare no competing interests.

Figures

Fig. 1
Fig. 1. Investigating the root of embryophytes using outgroup-free rooting.
a, An unrooted maximum likelihood tree was inferred from an alignment of 24 species and 249 single-copy orthogroups under the LG + C60 + G4 + F model. Twelve candidate root positions for embryophytes were investigated using both ALE and STRIDE. For the ALE analysis, the unrooted tree was rooted in each of the 12 positions and scaled to geological time on the basis of the results of the divergence time analysis, and 18,560 gene clusters were reconciled using the ALEml algorithm. The green circles highlight supported roots following the ALE analysis, while the red circles denote supported nodes in the STRIDE analysis. b, The likelihood of the 12 embryophyte roots was assessed with an AU test. The AU test significantly rejected 9 of the 12 roots, with roots on hornworts, moss and monophyletic bryophytes (root positions 9, 12 and 8, respectively) comprising the credible set. c, Phylogenetic trees constrained to the credible roots were inferred in IQ-TREE under the LG + C60 + G + F model. An AU test was used to evaluate the likelihood of each of the constrained trees, with the root resulting in monophyletic bryophytes being the only one not to be significantly rejected.
Fig. 2
Fig. 2. The timescale of land plant evolution.
Divergence times in millions of years as inferred using a molecular clock model, 68 fossil calibrations and an HGT. The inference that the common ancestor of embryophytes lived during the Cambrian is robust to the choice of maximum age constraints (Supplementary Methods). The divergence times of hornworts are constrained by an HGT into polypod ferns, with the result that the hornwort crown is inferred to have diverged during the Permian–Triassic. The nodes are positioned on the mean age, and the bars represent the 95% highest posterior density.
Fig. 3
Fig. 3. Gene content reconstruction of the ancestral embryophyte.
a, Ancestral gene content was inferred for the internal branches of the embryophyte tree. A maximum likelihood tree was inferred from an alignment of 30 species of plants and algae, comprising 185 single-copy orthologues and 71,855 sites, under the LG + C60 + G4 + F model in IQ-TREE, and rooted in accordance with our previous phylogenetic analysis. A timescale for the tree was then calculated using a subset of 18 applicable fossil calibrations in MCMCtree. We reconciled 20,822 gene family clusters, inferred using Markov clustering, against the rooted dated species tree using the ALEml algorithm. The summed copy number of each gene family (under each branch) was determined using custom Python code (branchwise_number_of_events.py). Branches with reduced copies from the ancestral node are coloured in red. The numbers of DTL events are represented by purple, blue and red circles, respectively. The sizes of the circles are proportional to the summed number of events (the scale is indicated by the grey circle). b, The number of DTL events scaled by time for four clade-defining branches in the embryophyte tree. c, The number of shared gene families between the ancestral embryophyte, liverwort and angiosperm. The ancestral embryophyte shares more gene families with the ancestral angiosperm than with the ancestral liverwort.
Fig. 4
Fig. 4. Genome disparity analysis demonstrates that the gene content of both tracheophytes and bryophytes is highly derived.
Non-metric multidimensional scaling (NMDS) analysis of the presence and absence of gene families. The presence or absence of each gene family was determined from the ALE analysis for each tip and internal node in the phylogeny. The presence/absence data were used to calculate the Euclidean distances between species and nodes, which were then ordinated using NMDS. Branches were drawn between the nodes of the tree, with convex hulls fitting around members of each major lineage of land plants.
Extended Data Fig. 1
Extended Data Fig. 1. Phylogenetic analysis of land plants provides robust support for the monophyly of bryophytes.
a, phylogenetic tree inferred from a concatenated alignment of 30919 sites consisting of 160 single copy orthogroups using the CAT-GTR model (Blanquart and Lartillot, 2008). Branch colour is proportional to the posterior probability; black branches received maximum support, and red received less than maximum and greater values than 0.9. The grey bars assigned to each species are proportional to the percentage of gaps in the alignment. Species with more than 50% gaps in the alignment have their labels coloured blue. The branches of the tree are not drawn to scale. b, Summarised maximum likelihood tree inferred from the same alignment as above using the LG + C60 + G4 + F model, which accounts for site heterogeneity in the substitution process. All major nodes received maximum boot strap support. c, Phylogenetic tree inferred using the ASTRAL; gene trees were inferred from the 160 single copy orthogroups used to construct the concatenate. All branches except the one defining bryophytes received maximum coalescent support, albeit the branch still received strong support (0.95). The size of the circles in both a and b are proportional to sample size of the lineage they represent.
Extended Data Fig. 2
Extended Data Fig. 2. Additional outgroup-free rooting analyses.
Unrooted maximum likelihood tree inferred from an alignment of 11 species and single copy orthogroups under the LG + C60 + G4 + F model. Four candidate root positions for embryophytes were investigated using ALE. For the ALE analysis, the unrooted tree was rooted in each of the twelve positions and scaled to geological time based on the results of the divergence time analysis and gene clusters were reconciled using the ALEml algorithm. The likelihood of the four embryophyte roots was assessed with an approximate unbiased (AU) test. The AU test significantly rejected 3 out of the 4 roots, favouring only a root between bryophytes and tracheophytes.
Extended Data Fig. 3
Extended Data Fig. 3. Alternative placements of the NEOCHROME constraint.
The NEOCHROME horizontal gene transfer is predicted to have occurred from hornworts into the ancestor of polypod ferns. However, topological uncertainty in the NEOCHROME gene tree allows the possibility that the transfer could have occurred into a more ancient lineage (A). We placed the relative node calibration such that hornworts must be more ancient than (i) Polypodiales (ii) Cyatheales + Polypodiales and (iii) Gleicheniales+Cyatheales+Polypodiales. The 95% highest posterior density (HPD) for the molecular clock analysis under each scenario is shown as a bar in (B), with a dot for the mean age. 95% HPDs were calculated from 2,000 post-burnin samples over 2,000,000 MCMC generations.
Extended Data Fig. 4
Extended Data Fig. 4. The effect of alternative calibration strategies on the age of crown group embryophytes.
Calibrations were altered by variously relaxing maximum age calibrations on the age of embryophytes (Strategy B) and embryophytes and tracheophytes (Strategy C). The width of the red band across the phylogenies represents the 95% highest posterior density (HPD) interval. 95% HPDs were calculated from 2,000 post-burnin samples over 2,000,000 MCMC generations.
Extended Data Fig. 5
Extended Data Fig. 5. Functional annotation of gene family changes between the ancestral embryophyte, bryophytes and tracheophytes.
Left, overall change in GO term frequency between the ancestral embryophyte and the ancestral bryophyte/tracheophyte. GO terms on average become less frequent in bryophytes. Right, change in the frequency of specific GO terms between the ancestral embryophyte and the ancestral bryophyte/tracheophyte. Bryophytes have a reduction in gene families associated with shoot and root development, while we see an increase in gene families associated with these GO terms in the tracheophyte ancestor.
Extended Data Fig. 6
Extended Data Fig. 6. Phylogenetic trees of key losses on the bryophyte stem.
Gene trees were constructed from BLAST searches of an expanded taxon set. Each gene tree was inferred under the best-fitting model in IQ-TREE determined via the Bayesian Information Criterion. The trees were rooted using algal outgroups. In each case, the branches where bryophytes appear to have undergone loss are marked by a yellow dot.
Extended Data Fig. 7
Extended Data Fig. 7. Phylogenetic tree highlighting the horizontal transfer of the chimeric neochrome photoreceptor (NEO).
The Arabidopsis thaliana protein sequence for PHOT1 was used to BLAST a database of 177 species of plant and transcriptomes. The homologous sequences were aligned with MAFFT and trimmed with BMGE. A maximum likelihood tree was inferred in IQ-TREE under the best fitting substitution model inferred with Bayesian Inference Criterion. 8 fern genes were resolved within the hornworts and were inferred to have undergone horizontal gene transfer (coloured red). This transfer was previously characterised (Li et al., 2014), and we corroborate this finding with maximum bootstrap support.

Similar articles

Cited by

References

    1. Berry, J. A., Beerling, D. J. & Franks, P. J. Stomata: key players in the Earth system, past and present. Curr. Opin. Plant Biol.10.1016/j.pbi.2010.04.013 (2010). - PubMed
    1. Pires, N. D. & Dolan, L. Morphological evolution in land plants: new designs with old genes. Phil. Trans. R. Soc. B10.1098/rstb.2011.0252 (2012). - PMC - PubMed
    1. Wellman CH, Strother PK. The terrestrial biota prior to the origin of land plants (embryophytes): a review of the evidence. Palaeontology. 2015;58:601–627.
    1. Christenhusz, M. J. M. & Byng, J. W. The number of known plants species in the world and its annual increase. Phytotaxa10.11646/phytotaxa.261.3.1 (2016).
    1. de Vries, J. & Archibald, J. M. Plant evolution: landmarks on the path to terrestrial life. N. Phytol. 10.1111/nph.14975 (2018). - PubMed

Publication types