. 2022 Sep 29;9(1):589.
doi: 10.1038/s41597-022-01699-3.

Optical emissivity dataset of multi-material heterogeneous designs generated with automated figure extraction

Affiliations

Optical emissivity dataset of multi-material heterogeneous designs generated with automated figure extraction

Viktoriia Baibakova et al. Sci Data. .

Abstract

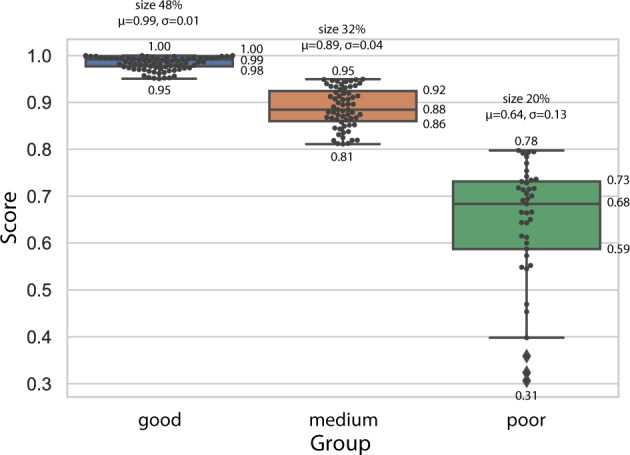
Optical device design is typically an iterative optimization process based on a good initial guess from prior reports. Optical properties databases are useful in this process but difficult to compile because their parsing requires finding relevant papers and manually converting graphical emissivity curves to data tables. Here, we present two contributions: one is a dataset of thermal emissivity records with design-related parameters, and the other is a software tool for automated colored curve data extraction from scientific plots. We manually collected 64 papers with 176 figures reporting thermal emissivity and automatically retrieved 153 colored curve data records. The automated figure analysis software pipeline uses Faster R-CNN for axes and legend object detection, EasyOCR for axes numbering recognition, and k-means clustering for colored curve retrieval. Additionally, we manually extracted geometry, materials, and method information from the text to add necessary metadata to each emissivity curve. Finally, we analyzed the dataset to determine the dominant classes of emissivity curves and determine the underlying design parameters leading to a type of emissivity profile.


Conflict of interest statement

The authors declare no competing interests.

Figures

Fig. 1
Fig. 1
The overall pipeline of data collection and organization into dataset. The data is retrieved from a corpus of 64 manually collected relevant papers (gray). There are three categories of data retrieval: blue - automated extraction of the general article information from text; green - manual extraction of the design-related parameters; and orange - automated curve raw data extraction embedded in semi-automatic figure analysis.
Fig. 2
Fig. 2
Information extraction from the source paper to the dataset record. Colors correspond to the category of extraction: blue - automated text analysis; green - manual text analysis; orange - automated figure analysis. Information is taken from different parts of an article; for example, materials are listed in the figure description and within the figure itself. This example uses the work of Zeyghami et al..
Fig. 3
Fig. 3
Examples of axes and legend labeling and trained CNN model performance. The x-axis is outlined in light green, the y-axis in cyan, and the legend in dark magenta. (a,b) Examples of hand-labeling using LabelImg software. Boxes depict the identified regions. Note that in b, the y-axis label includes just the portion with numbers and not the entire axis line for subsequent axis scale extraction; see text for details. (cf) Examples of output of trained object detection model. Boxes demonstrate the detection results. For a: Copyright 1999–2021 John Wiley and Sons, Inc. All rights reserved. For b: reprinted from Timans, P. J. (1992). The experimental determination of the temperature dependence of the total emissivity of GaAs using a new temperature measurement technique. Journal of applied physics, 72(2), 660–670, with the permission of AIP Publishing. For c: Reprinted from Nefzaoui, E., Drevillon, J., and Joulain, K. (2012). Selective emitters design and optimization for thermophotovoltaic applications. Journal of Applied Physics, 111(8), 084316, with the permission of AIP Publishing.
Fig. 4
Fig. 4
The pipeline for extracting axis scale and curves of different colors from figures. (a) Original image with detected x-axis (light green box), y-axis (cyan box), and legend (dark magenta box). Along the edges of the original image, we show the detected axes regions, the axes scale numbers as detected by EasyOCR, and assigned green ticks. (b) On top is a color-isolated image that is the original image after removing the axes, legend, and black/gray objects. On the bottom is a color-isolated image palette with cluster centers determined by k-means clustering. (c) Data clusters of each color from the palette. Clusters 3 and 5 were accepted as they contain a single curve data. Cluster 4 was rejected as it contained only noise. After extracting the pixel coordinates of clusters 3 and 5, we matched them with EasyOCR cleaned output and converted to units of measurement.
Fig. 5
Fig. 5
Several example curves and comparison between automated (black dots for correct points and yellow crosses for multiple y points) and manual (cyan) extraction. The red line on the bottom depicts the unconfident area, demonstrating the portion of the curve where an extraction has failed (gaps, multiple y values). The scores were calculated with Eq. 1. Top left: good extraction, score 1.00, the algorithm correctly captured the entire curve region. Top right: medium quality of extraction, score 0.91, the record has a few gaps and multiple y points. Bottom left: poor extraction, score 0.72, the original curve has dashed style; many multiple y points created by text comment. Bottom right: poor extraction, the lowest score of 0.31; many gaps caused by overlapping, multiple y points due to text comment.
Fig. 6
Fig. 6
Statistical analysis of extracted curve data records grouped as good, medium, and poor. Each point represents one curve, and scores show the quality of the extraction. Scores were calculated with the Eq. 1. A mean μ and standard deviation σ values are given on top, along with the relative size of each group.
Fig. 7
Fig. 7
The distribution of design-related parameters (geometry, materials) in the dataset. The innermost circle corresponds to geometry. The outer ring depicts the used materials with colors reflecting the composition: the color is dark for single material devices and light for sandwich structures. There are 32 distinct materials. In total, there are 60% sandwich and 40% single material structures. The most used material overall is tungsten, which has desirable properties for optical devices.
Fig. 8
Fig. 8
Curves classes with similar emissivity behavior and distribution of corresponding metadata. Curves were clustered with unsupervised learning using the DBSCAN algorithm. Curves are plotted with partial transparency such that dark areas indicate overlap of curves. The x-axis is in logarithm scale for better visualization. Pie charts in the insets show the distribution of geometry and composition per class. Bar charts in the insets depict distinct material frequencies normalized per class size (i.e., if the bin height is 1, the material is present in every record in the class).

References

    1. Fritts CE. On a new form of selenium cell, and some electrical discoveries made by its use. American Journal of Science. 1883;s3-26:465–472. doi: 10.2475/ajs.s3-26.156.465. - DOI
    1. Solomon ML, et al. Nanophotonic platforms for chiral sensing and separation. Accounts of chemical research. 2020;53:588–598. - PubMed
    1. Ito T, Okazaki S. Pushing the limits of lithography. Nature. 2000;406:1027–1031. - PubMed
    1. Krebs, H.-U. et al. Pulsed laser deposition (pld)–a versatile thin film technique. In Advances in Solid State Physics, 505–518 (Springer, 2003).
    1. Kunz, K. S. & Luebbers, R. J. The finite difference time domain method for electromagnetics (CRC press, 1993).