. 2022 Sep 29;39(12):223.
doi: 10.1007/s12032-022-01825-6.

Philadelphia-negative myeloproliferative neoplasms display alterations in monocyte subpopulations frequency and immunophenotype

Affiliations

Philadelphia-negative myeloproliferative neoplasms display alterations in monocyte subpopulations frequency and immunophenotype

Vitor Leonardo Bassan et al. Med Oncol. .

Abstract

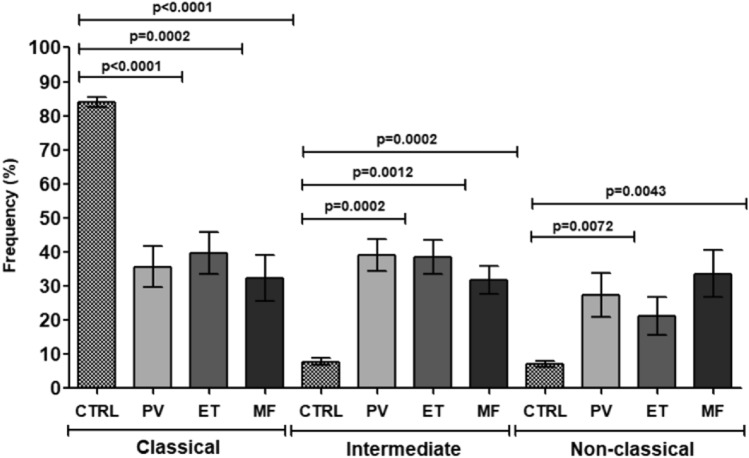
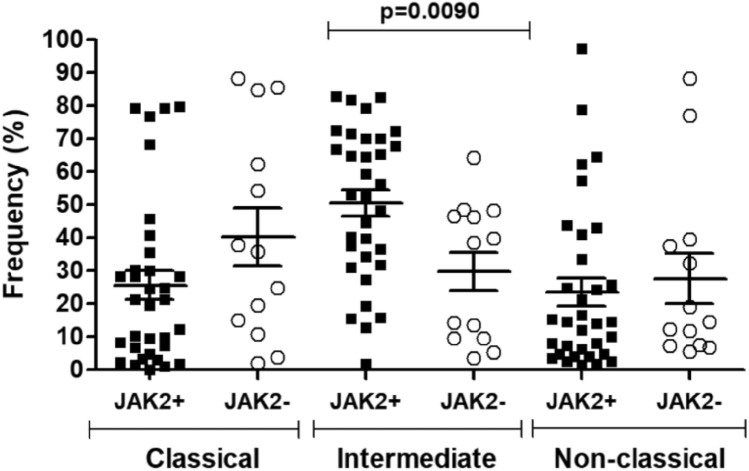
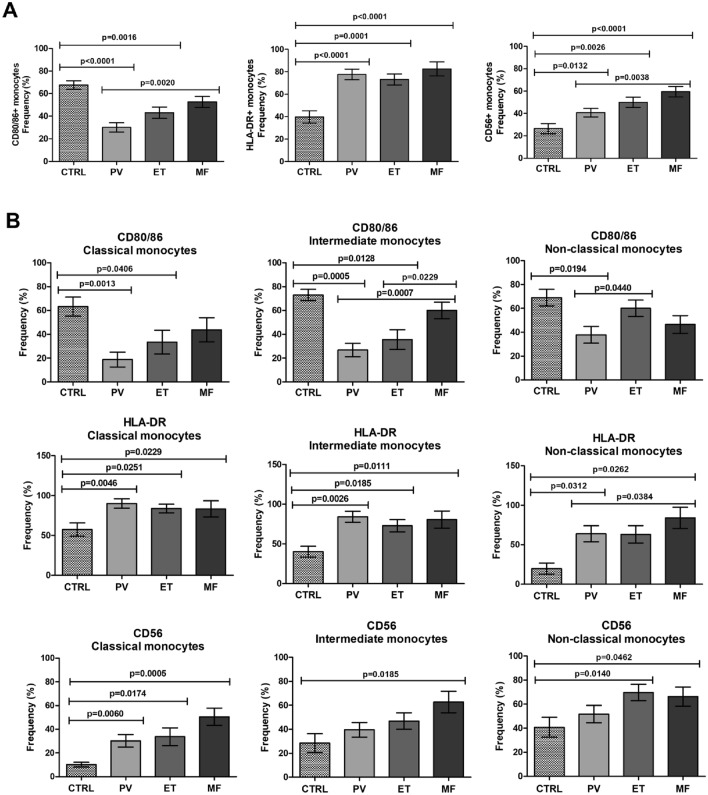
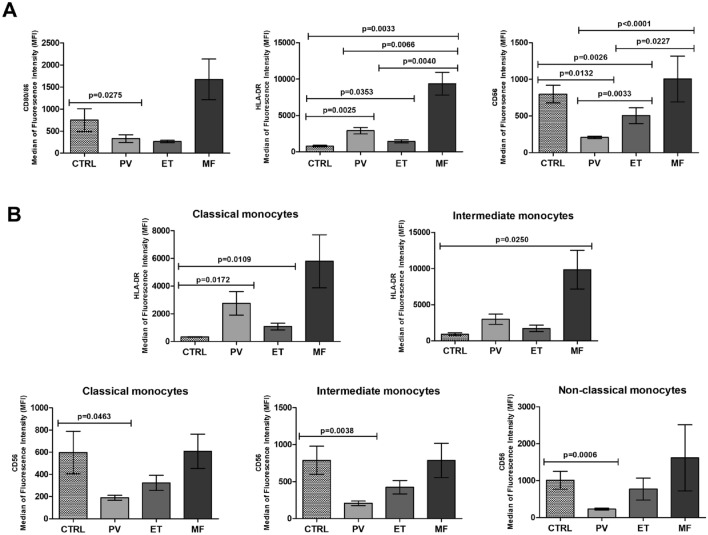
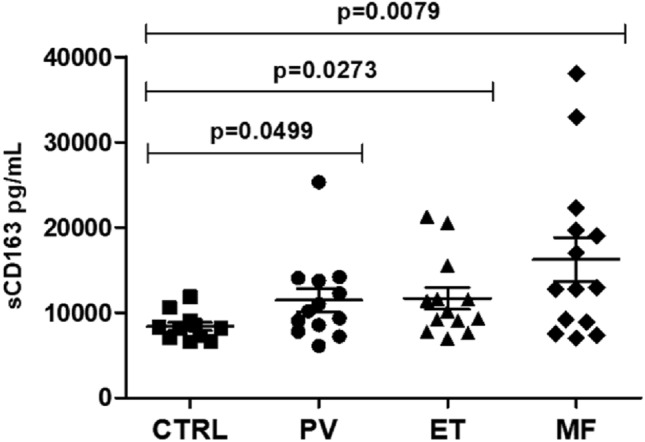
Philadelphia-negative myeloproliferative neoplasms (MPN) are clonal hematological diseases associated with driver mutations in JAK2, CALR, and MPL genes. Moreover, several evidence suggests that chronic inflammation and alterations in stromal and immune cells may contribute to MPN's pathophysiology. We evaluated the frequency and the immunophenotype of peripheral blood monocyte subpopulations in patients with polycythemia vera (PV), essential thrombocythemia (ET), and primary myelofibrosis (MF). Peripheral blood monocytes from PV (n = 16), ET (n = 16), and MF (n = 15) patients and healthy donors (n = 10) were isolated and submitted to immunophenotyping to determine the frequency of monocyte subpopulations and surface markers expression density. Plasma samples were used to measure the levels of soluble CD163, a biomarker of monocyte activity. PV, ET, and MF patients presented increased frequency of intermediate and non-classical monocytes and reduced frequency of classical monocytes compared to controls. Positivity for JAK2 mutation was significantly associated with the percentage of intermediate monocytes. PV, ET, and MF patients presented high-activated monocytes, evidenced by higher HLA-DR expression and increased soluble CD163 levels. The three MPN categories presented increased frequency of CD56+ aberrant monocytes, and PV and ET patients presented reduced frequency of CD80/86+ monocytes. Therefore, alterations in monocyte subpopulations frequency and surface markers expression pattern may contribute to oncoinflammation and may be associated with the pathophysiology of MPN.

Keywords: Flow cytometry; Immune cells; Inflammation; Monocytes; Myeloproliferative neoplasms; Pathophysiology.


Conflict of interest statement

The authors have no conflict of interest to declare.

Figures

Fig. 1
Fig. 1
Percentage of monocyte subpopulations in myeloproliferative neoplasms (MPN). Polycythemia vera (PV), essential thrombocythemia (ET), and primary myelofibrosis (MF) patients presented lower frequency of classical monocytes (p < 0.0001, p = 0.0002, p < 0.0001, respectively); PV, ET, and MF presented increased intermediate monocytes frequency (p = 0.0002, p = 0.0012, p = 0.0002, respectively). PV and MF patients presented increased frequency of non-classical monocytes compared to the controls (p = 0.0072, p = 0.0043, respectively). Statistical differences were calculated using ANOVA non-parametric test and considered significant when p < 0.05. The results were expressed in mean and standard deviation
Fig. 2
Fig. 2
Frequency of monocyte subpopulations according to JAK2 mutation status in myeloproliferative neoplasms (MPN). The percentage of classical, intermediate, and non-classical monocytes in MPN patients was shown according to positivity for JAK2V617F mutation and plotted in the scatter plot. JAK2-positive MPN patients presented higher frequency of intermediate monocytes than JAK2-negative patients (p = 0.0090). Statistical differences were calculated using the Mann–Whitney test and considered significant when p < 0.05
Fig. 3
Fig. 3
Surface markers distribution in monocytes subpopulations in myeloproliferative neoplasms (MPN). The percentage of classical, intermediate, and non-classical monocytes expressing the surface markers CD80/86, HLA-DR and CD56 was calculated in patients with polycythemia vera (PV), essential thrombocythemia (ET), and primary myelofibrosis (MF) and control subjects (CTRL). AC Percentage of CD80/86+ monocytes in PV, ET and MF. DF Percentage of HLA-DR+ monocytes in PV, ET and MF. GI Frequency of CD56+ monocytes in PV, ET and MF. Statistical differences were calculated using ANOVA non-parametric test and considered significant when p < 0.05. The results were expressed in mean and standard deviation
Fig. 4
Fig. 4
Frequency of CD64, CD80/86, HLA-DR, and CD56-positive monocytes in myeloproliferative neoplasms (MPN). The percentage of monocytes positive for surface markers was analyzed in total monocyte population and its subpopulations. A Frequency of monocytes in the total monocyte population expressing CD64, CD80/86, HLA-DR, and CD56 in patients with polycythemia vera (PV), essential thrombocythemia (ET), and primary myelofibrosis (MF), and control subjects (CTRL). B Frequency of monocytes in the classical, intermediate, and non-classical monocyte subpopulations expressing CD64, CD80/86, HLA-DR, and CD56 in patients with PV, ET, and MF, and CTRL. The results were expressed as mean and standard deviation. Statistical differences were determined using ANOVA non-parametric test and considered significant when p < 0.05
Fig. 5
Fig. 5
Expression of CD64, CD80/86, HLA-DR, and CD56 in myeloproliferative neoplasms (MPN) monocytes. The median of fluorescence intensity (MFI) was calculated to determine surface antigen density in monocytes from control subjects (CTRL) and patients with polycythemia vera (PV), essential thrombocythemia (ET), and primary myelofibrosis (MF). A CD64, CD80/86, HLA-DR, and CD56 expression in total monocytes population. B CD64, CD80/86, HLA-DR, and CD56 expression in classical, intermediate, and non-classical monocyte subpopulations. The results were expressed as mean and standard deviation. Statistical differences were determined using ANOVA non-parametric test and considered significant when p < 0.05
Fig. 6
Fig. 6
Quantification of soluble CD163 (sCD163) in myeloproliferative neoplasms (MPN). The plasma concentration of the monocyte activity biomarker sCD163 in patients with polycythemia vera (PV, n = 13), essential thrombocythemia (ET, n = 13), primary myelofibrosis (MF, n = 14), and control subjects (CTRL, n = 11) was plotted in the scatter plot. The MPN patients presented higher plasma concentration of sCD163 than CTRL group (PV: p = 0.0499; ET: p = 0.0273; MF: p = 0.0079). Statistical differences were determined using ANOVA non-parametric test and considered significant when p < 0.05

Similar articles

Cited by

References

    1. Vainchenker W, Kralovics R. Genetic basis and molecular pathophysiology of classical myeloproliferative neoplasms. Blood. 2017;129(6):667–679. doi: 10.1182/blood-2016-10-695940. - DOI - PubMed
    1. Greenfield G, McMullin MF, Mills K. Molecular pathogenesis of the myeloproliferative neoplasms. J Hematol Oncol. 2021;14(1):103. doi: 10.1186/s13045-021-01116-z. - DOI - PMC - PubMed
    1. Arber DA, Orazi A, Hasserjian R, et al. The 2016 revision to the World Health Organization classification of myeloid neoplasms and acute leukemia. Blood. 2016;127(20):2391–2405. doi: 10.1182/blood-2016-03-643544. - DOI - PubMed
    1. Spivak JL. Myeloproliferative neoplasms. N Engl J Med. 2017;376:2168–2181. doi: 10.1056/NEJMra1406186. - DOI - PubMed
    1. Agarwal A, Morrone K, Bartenstein M, et al. Bone marrow fibrosis in primary myelofibrosis: pathogenic mechanisms and the role of TGF-β. Stem Cell Investig. 2016;3:5. doi: 10.3978/j.issn.2306-9759.2016.02.03. - DOI - PMC - PubMed