. 2022 Oct;54(10):1479-1492.
doi: 10.1038/s41588-022-01187-9. Epub 2022 Sep 29.

Identifying disease-critical cell types and cellular processes by integrating single-cell RNA-sequencing and human genetics

Affiliations

Identifying disease-critical cell types and cellular processes by integrating single-cell RNA-sequencing and human genetics

Karthik A Jagadeesh et al. Nat Genet. 2022 Oct.

Abstract

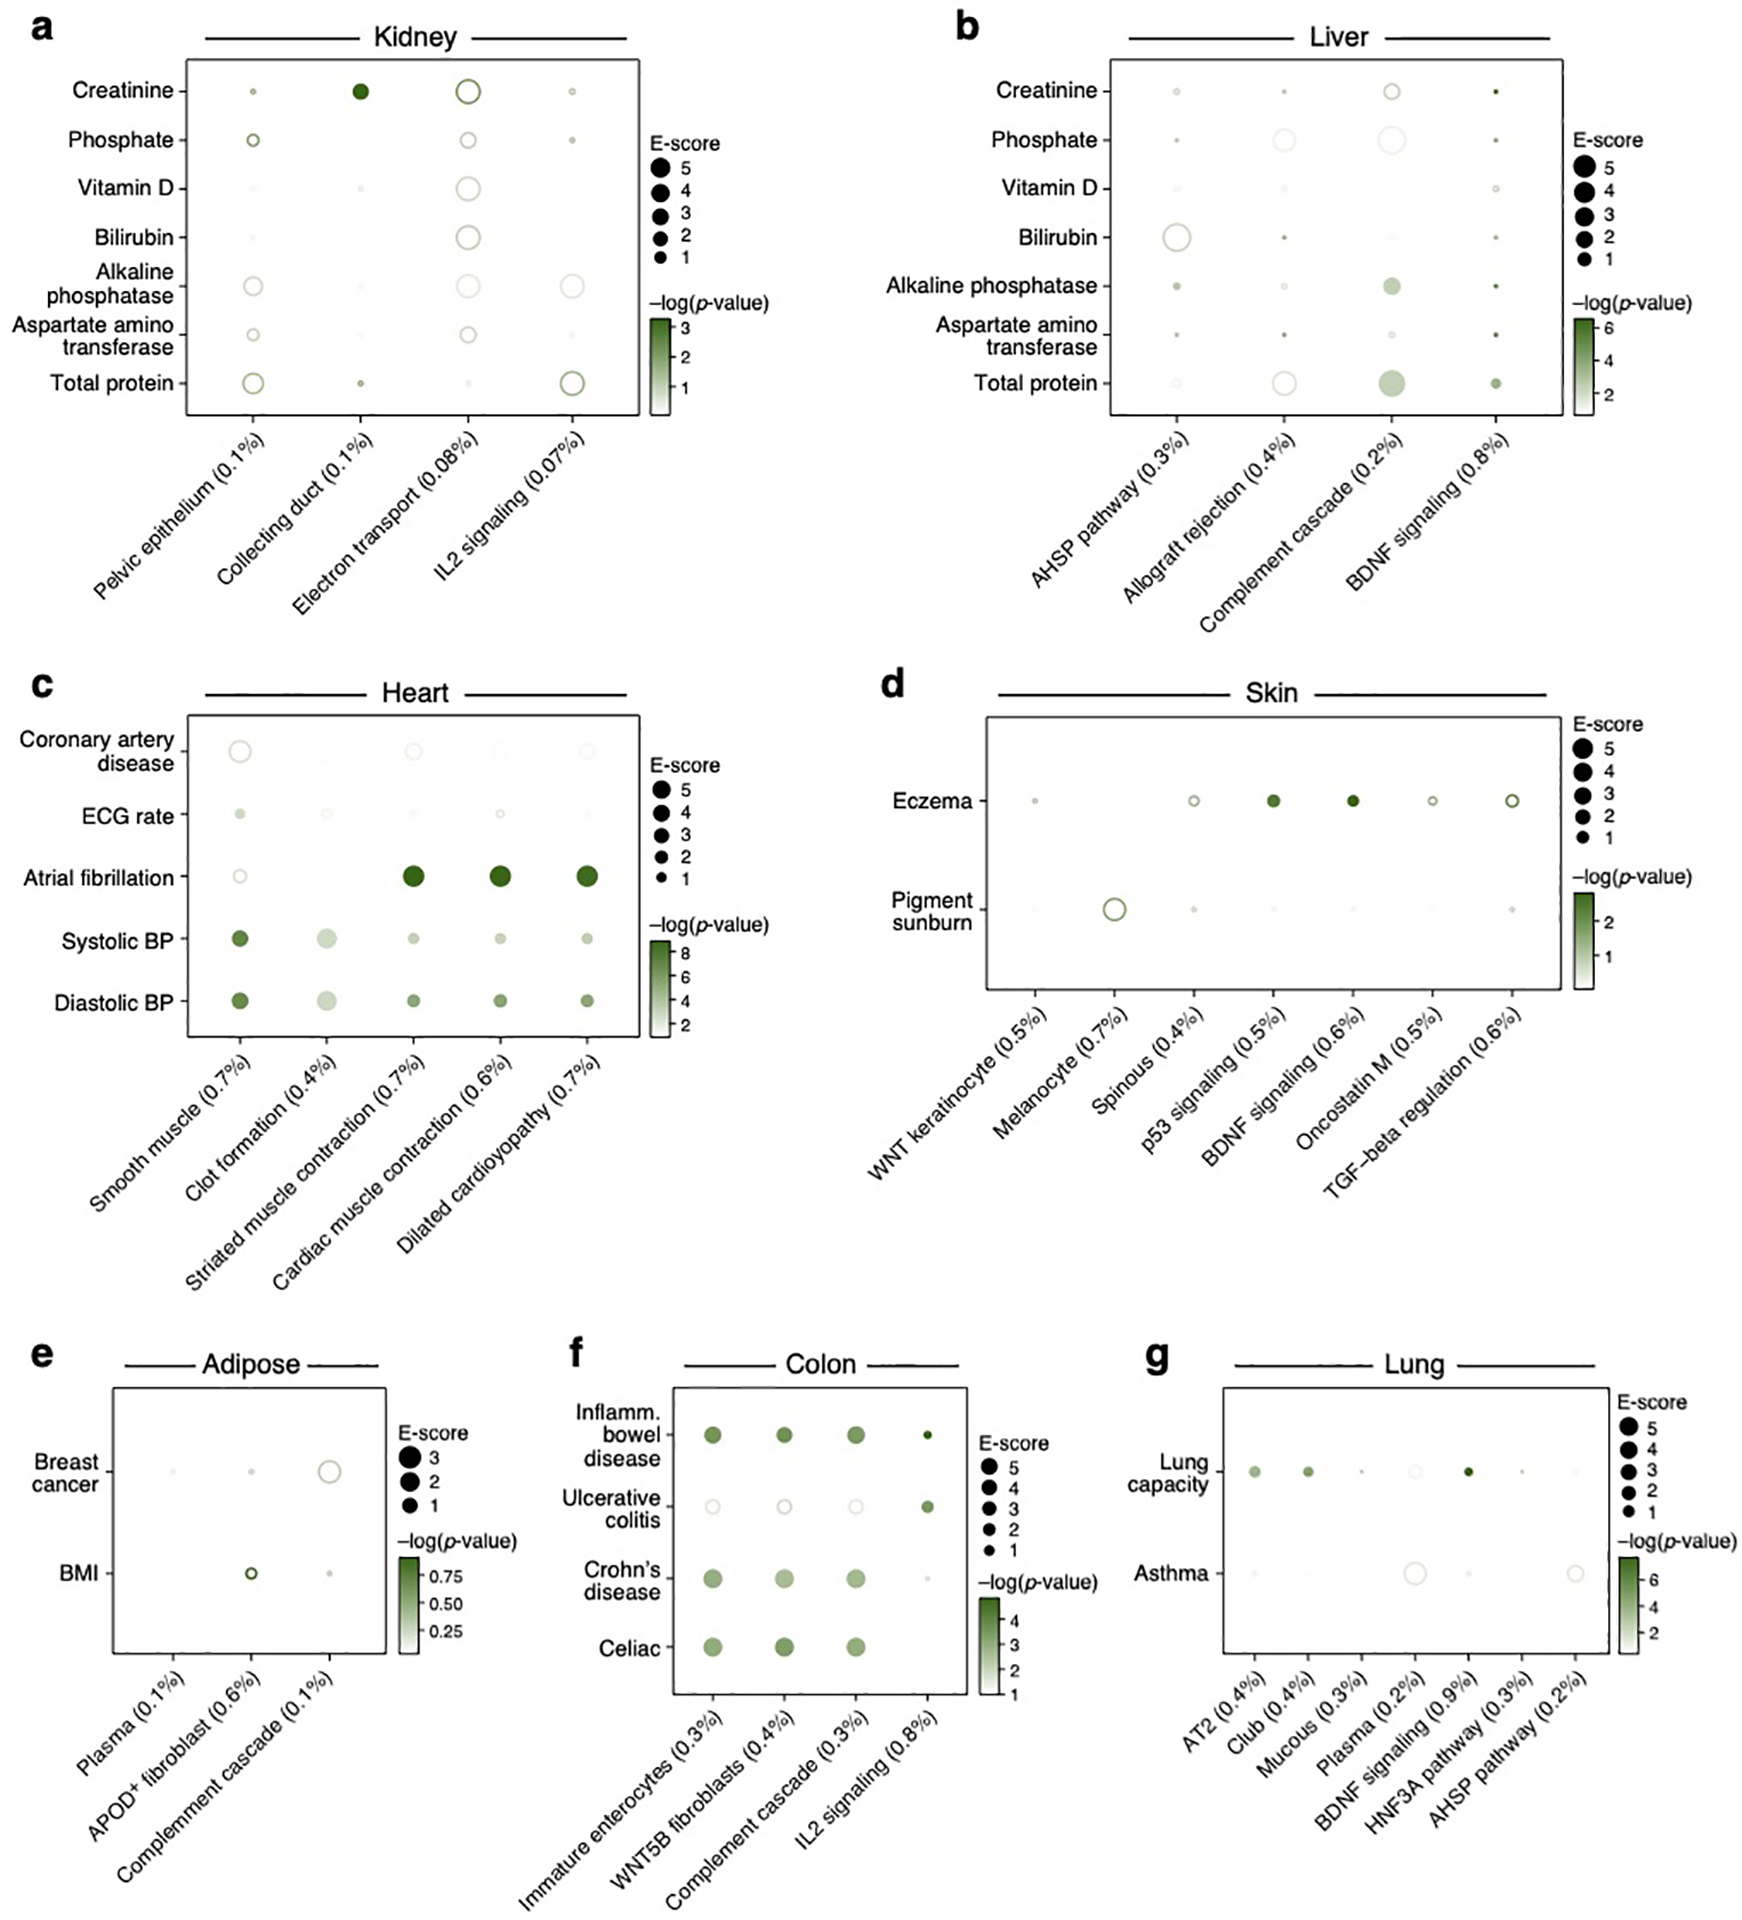
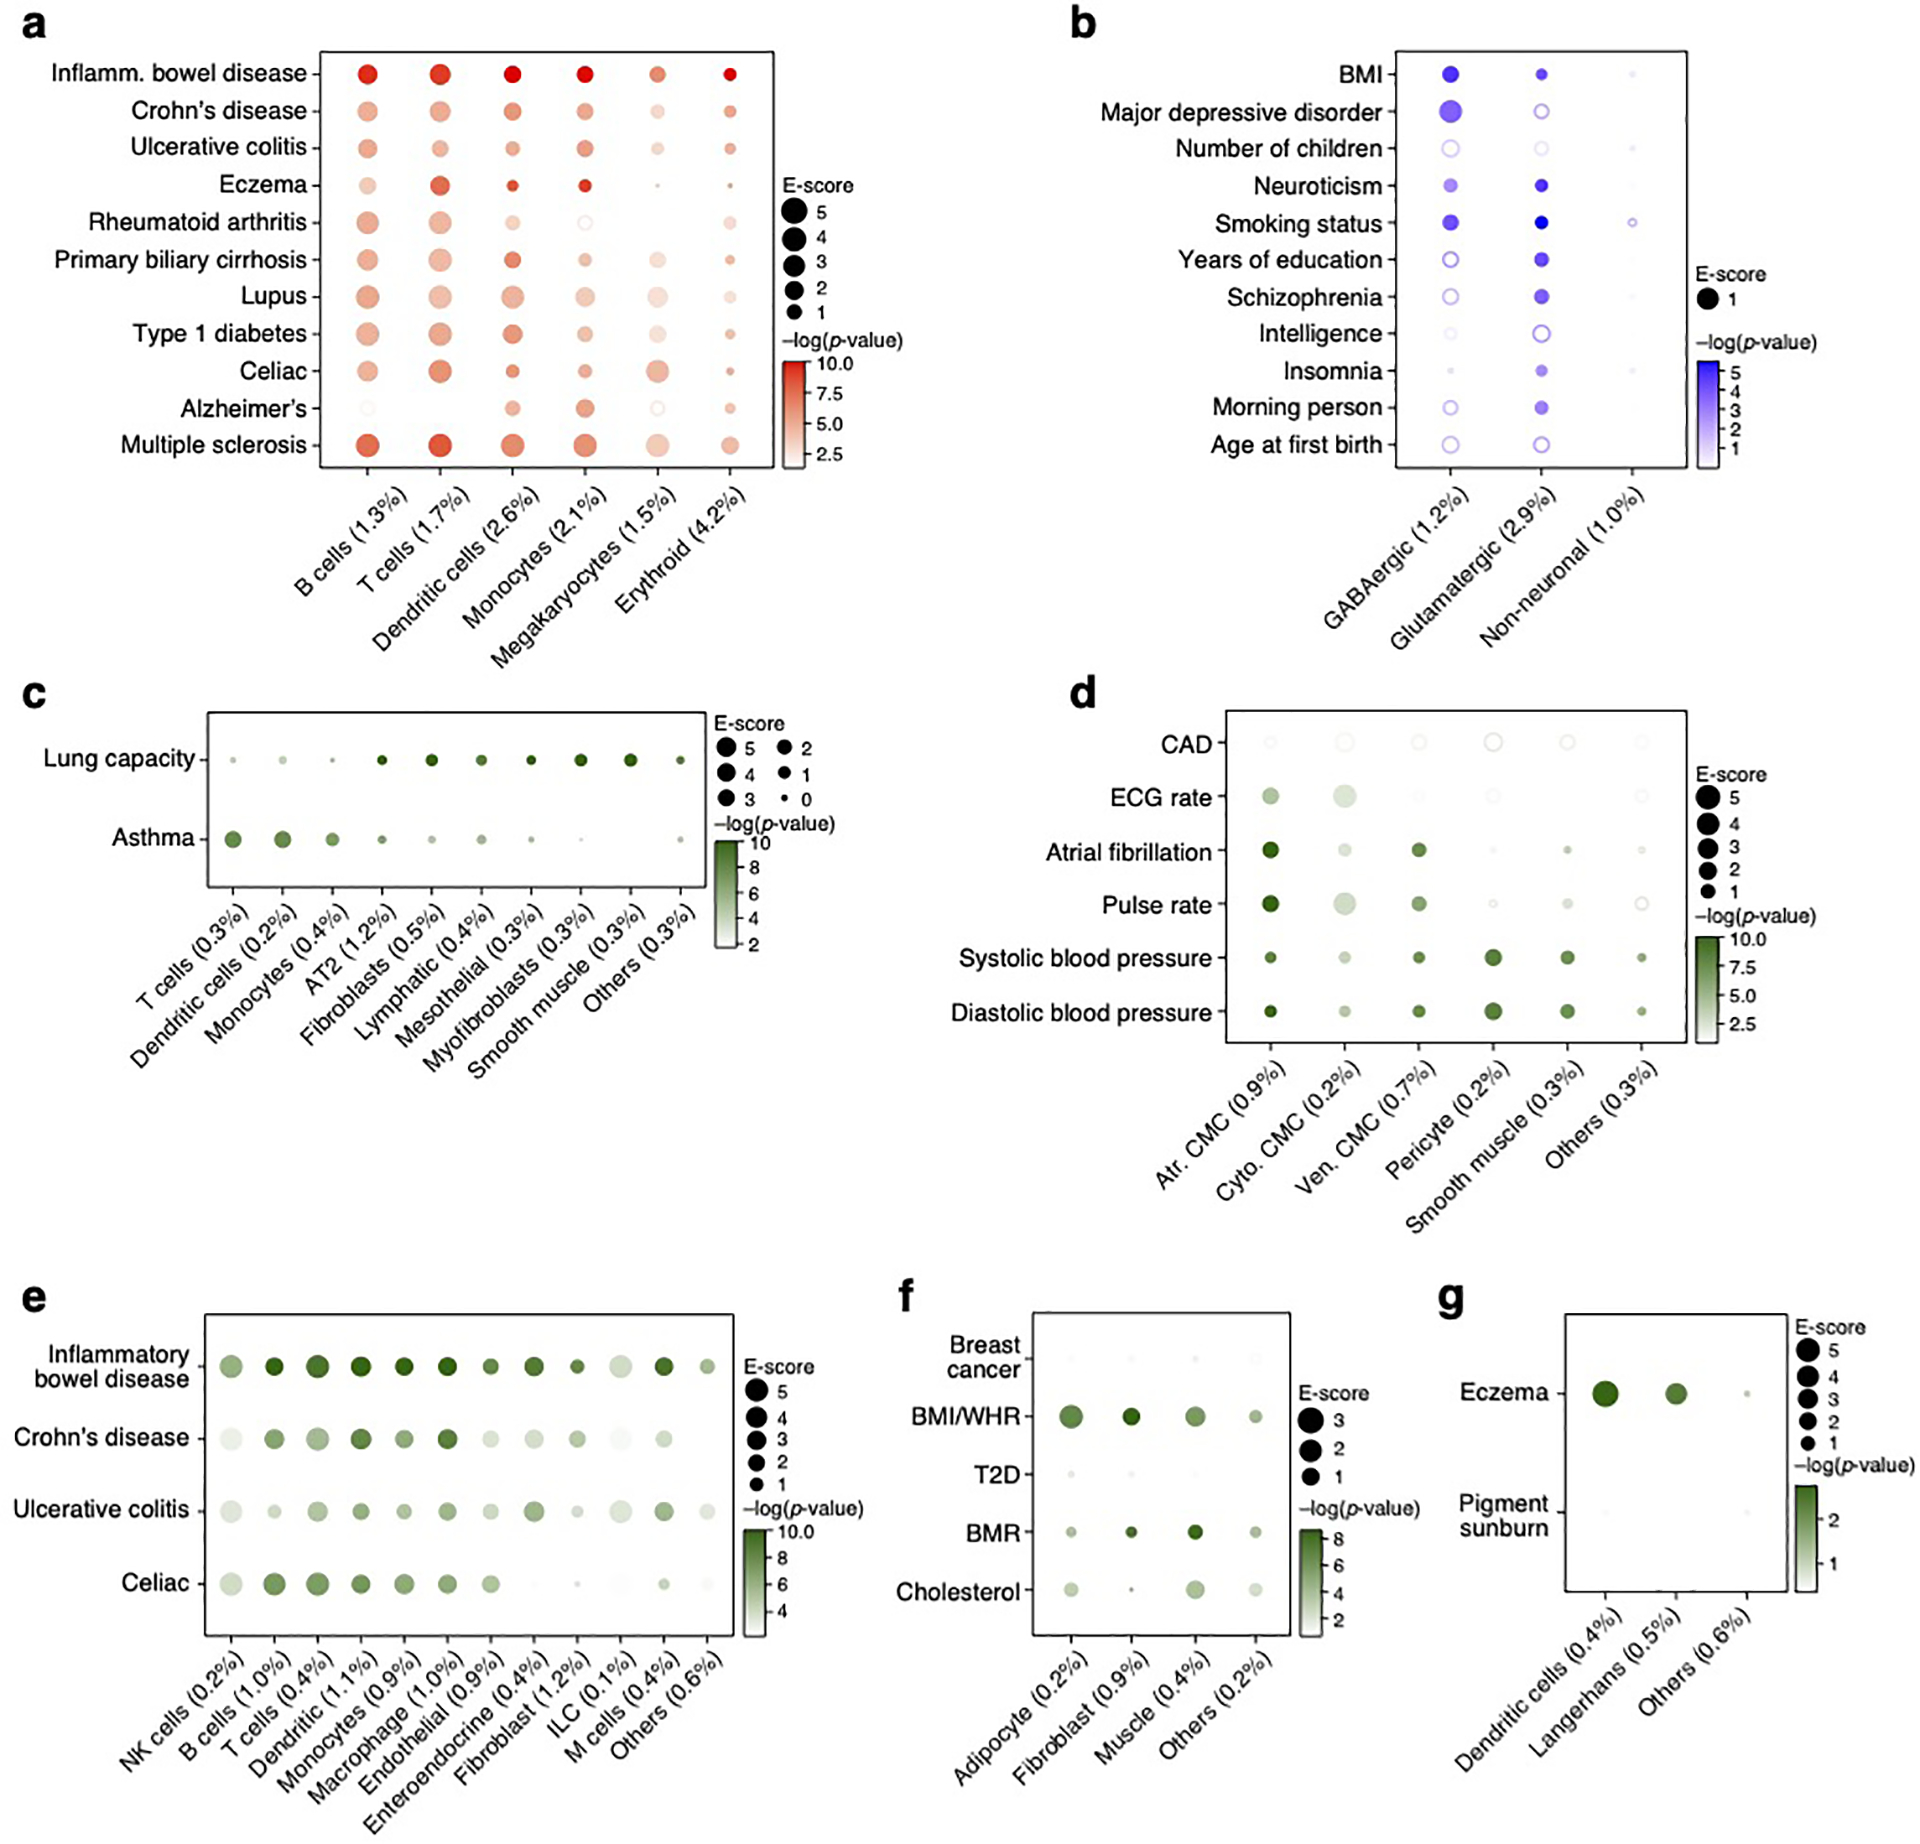
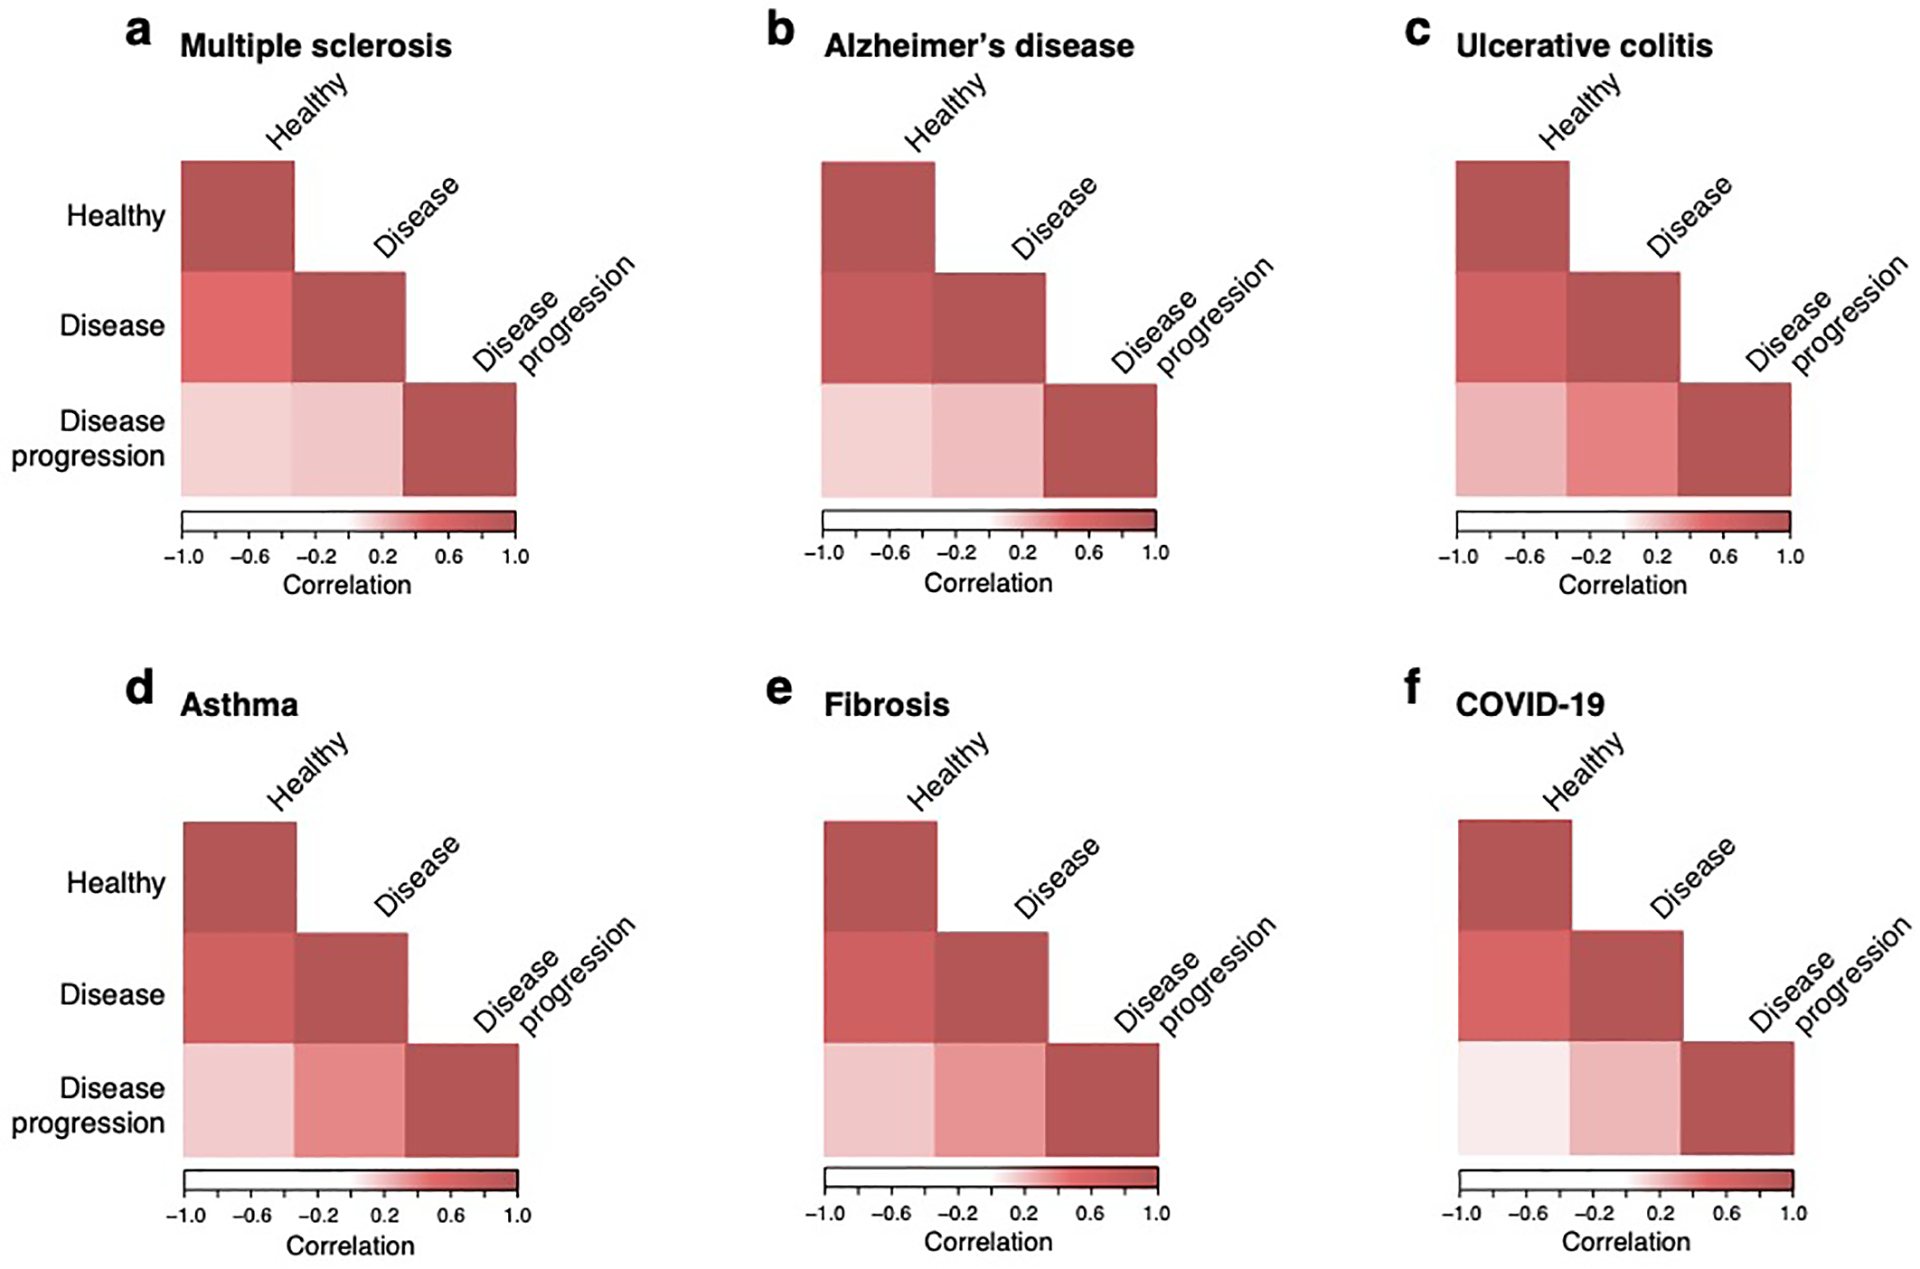
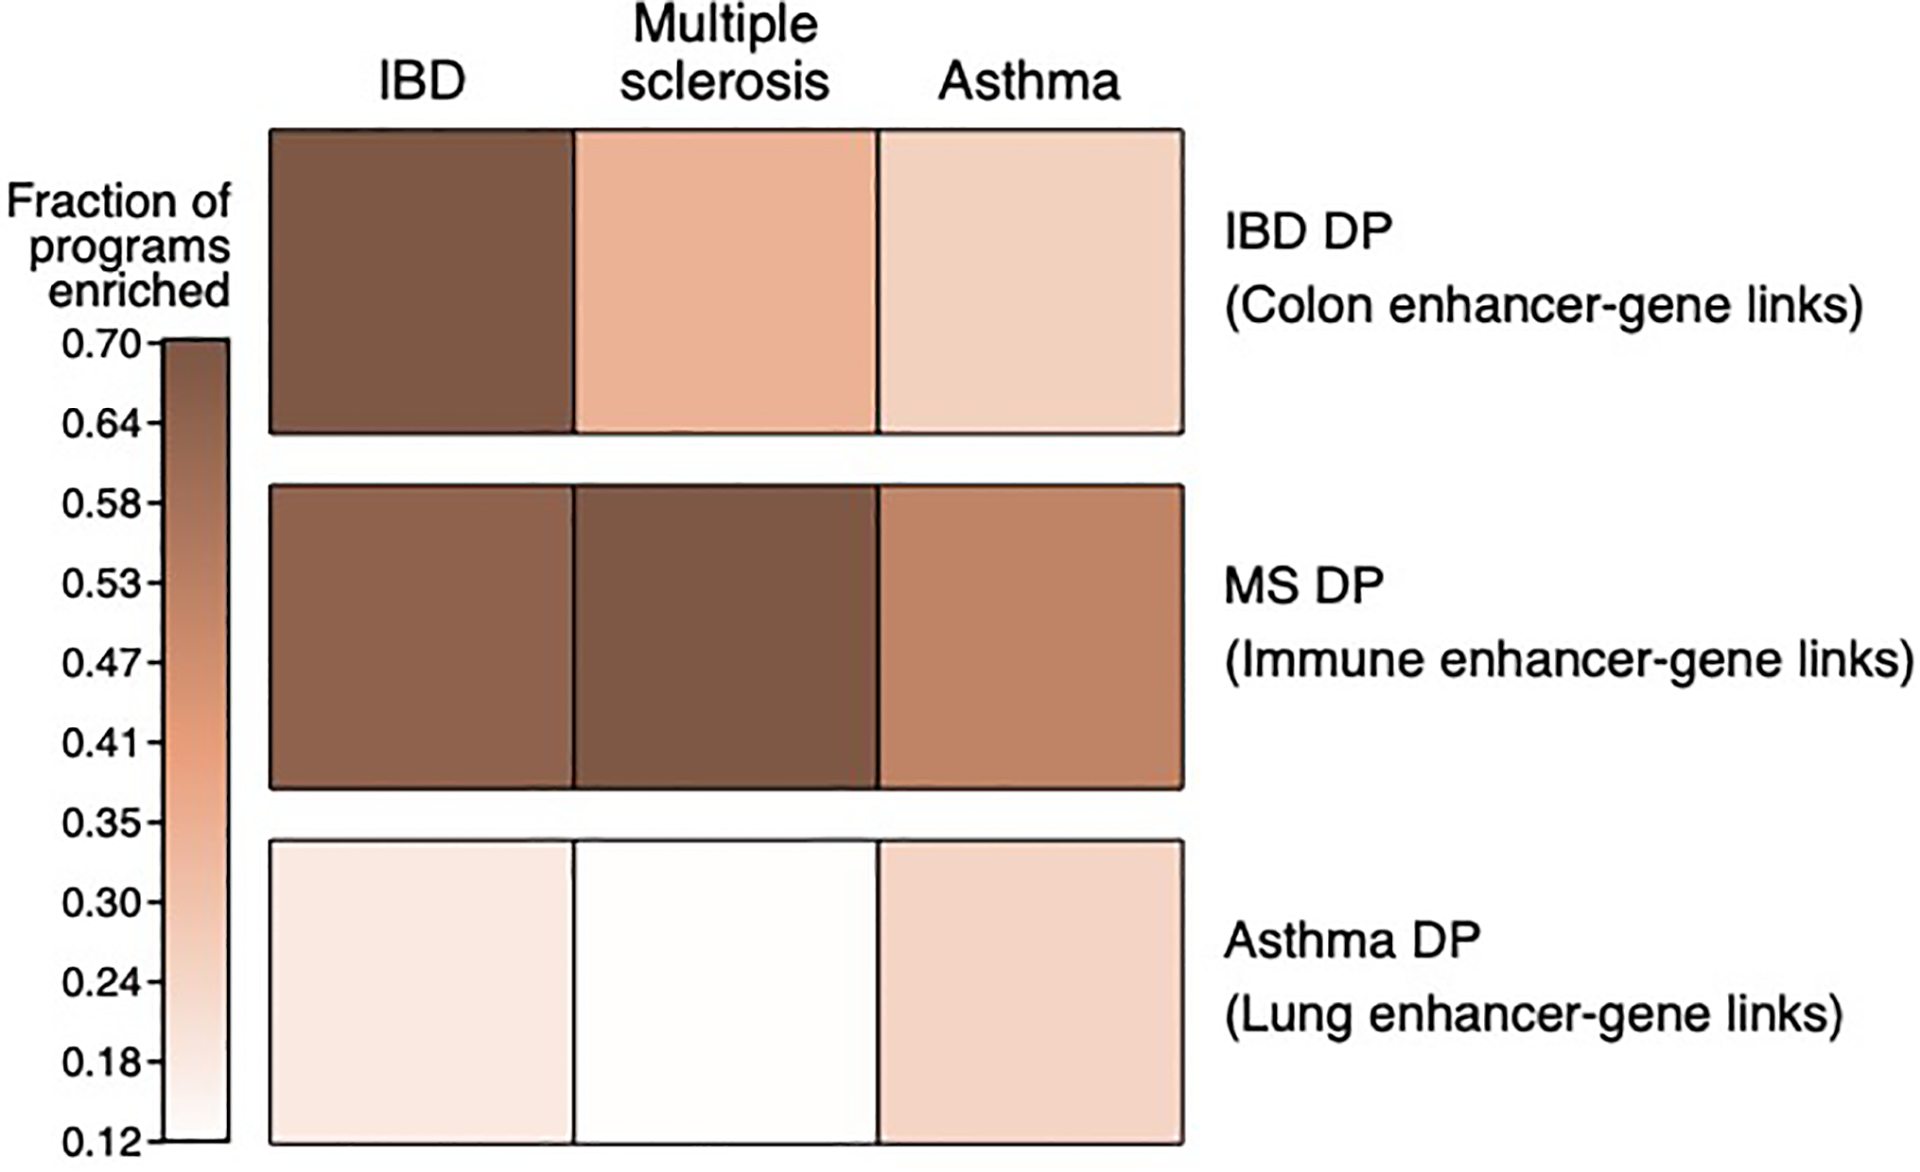
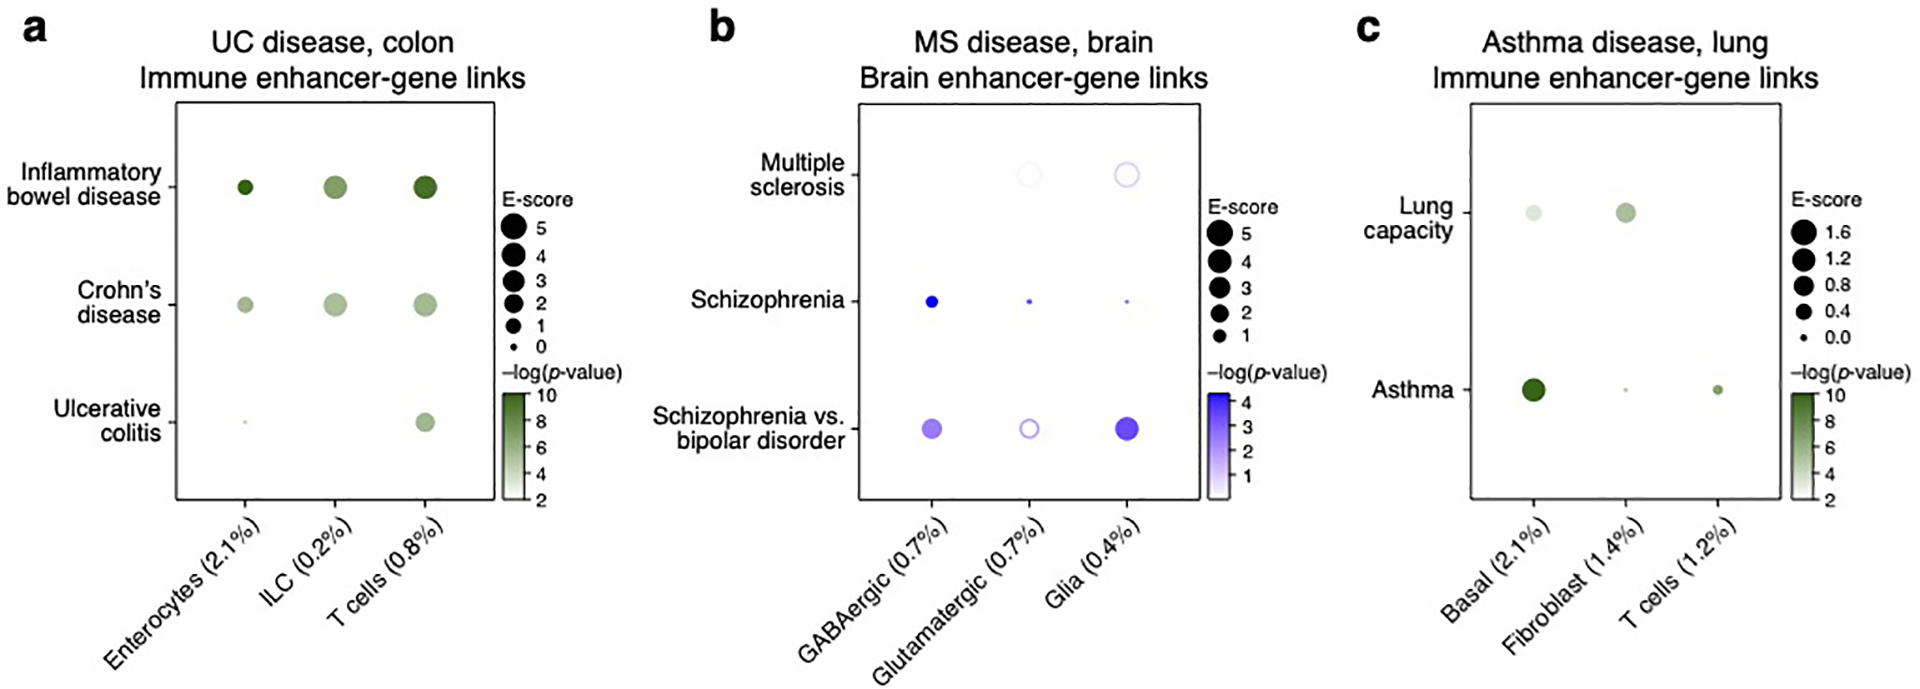
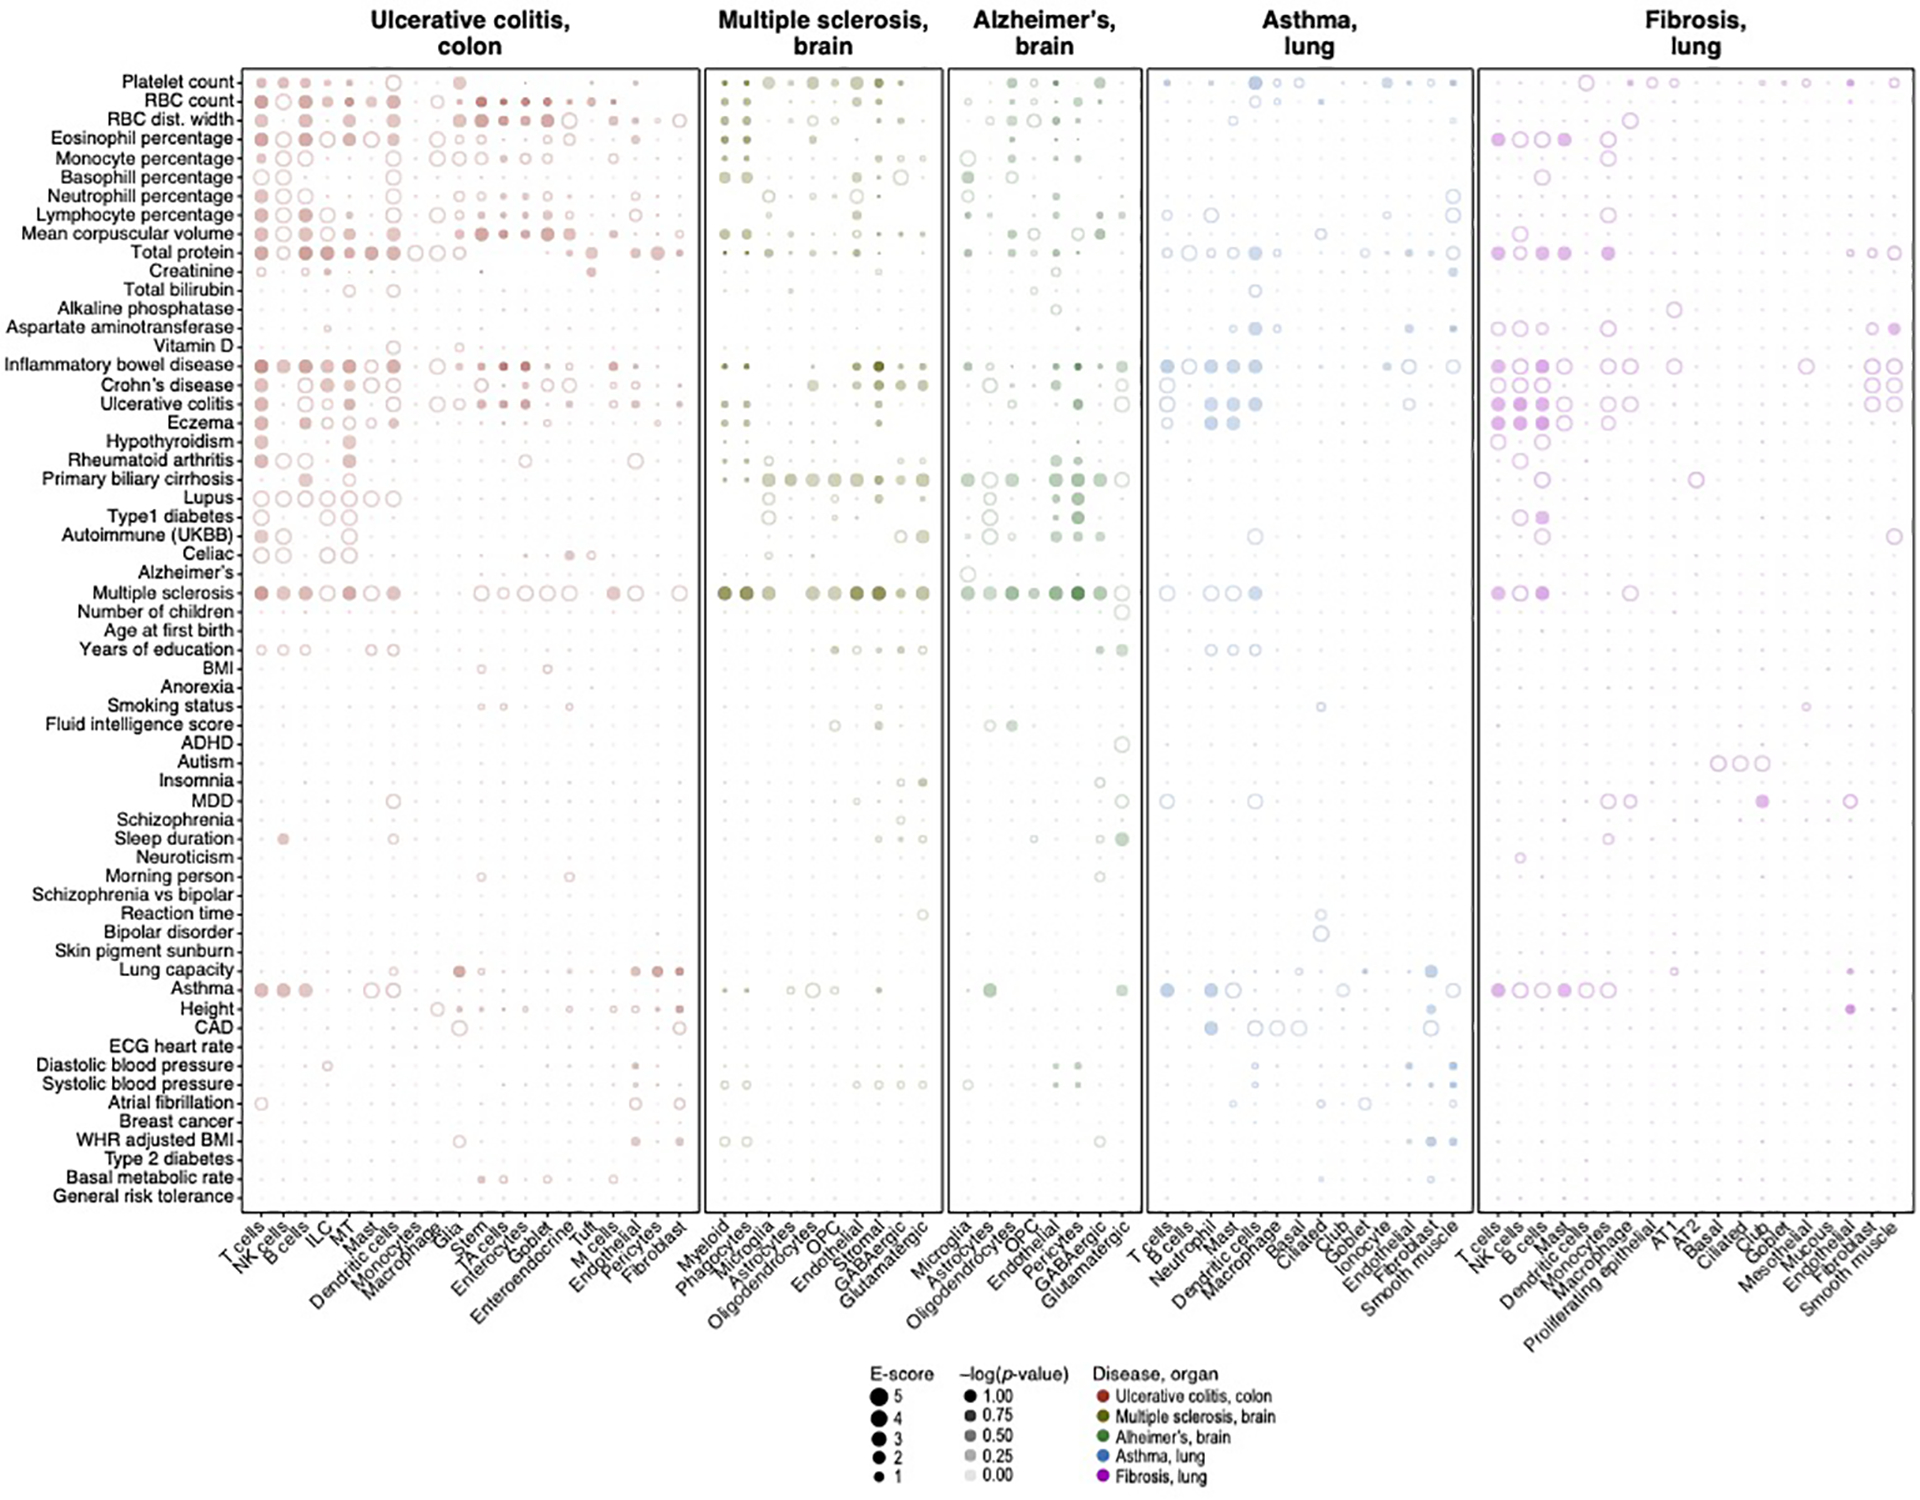
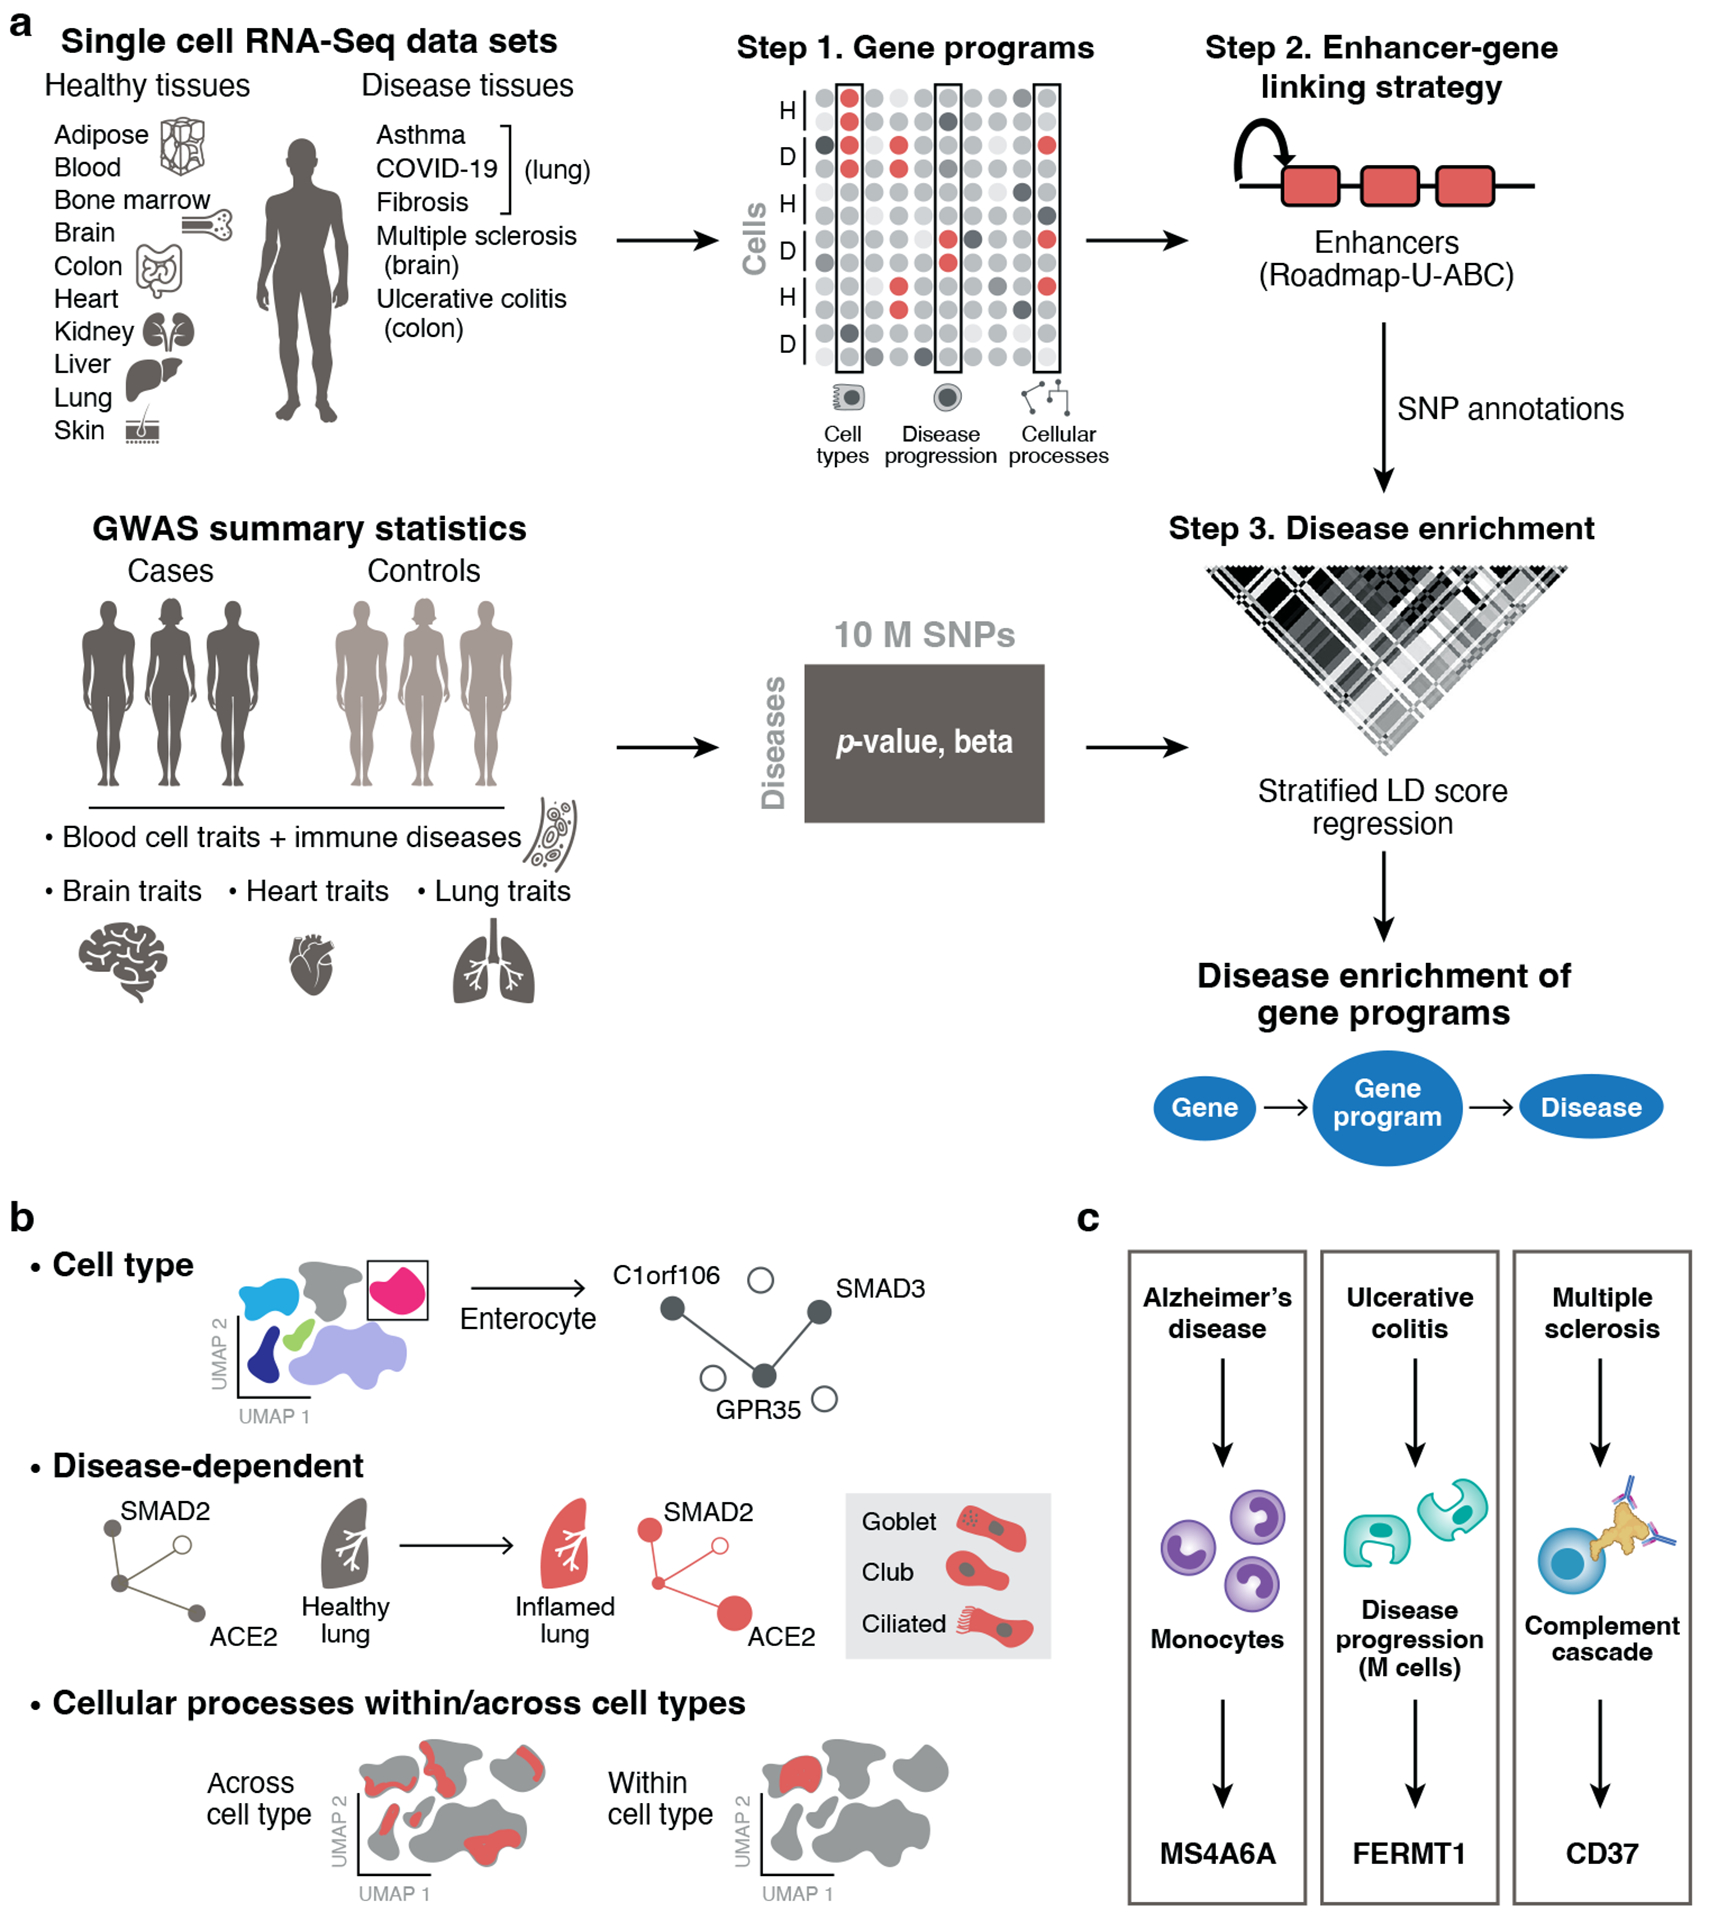
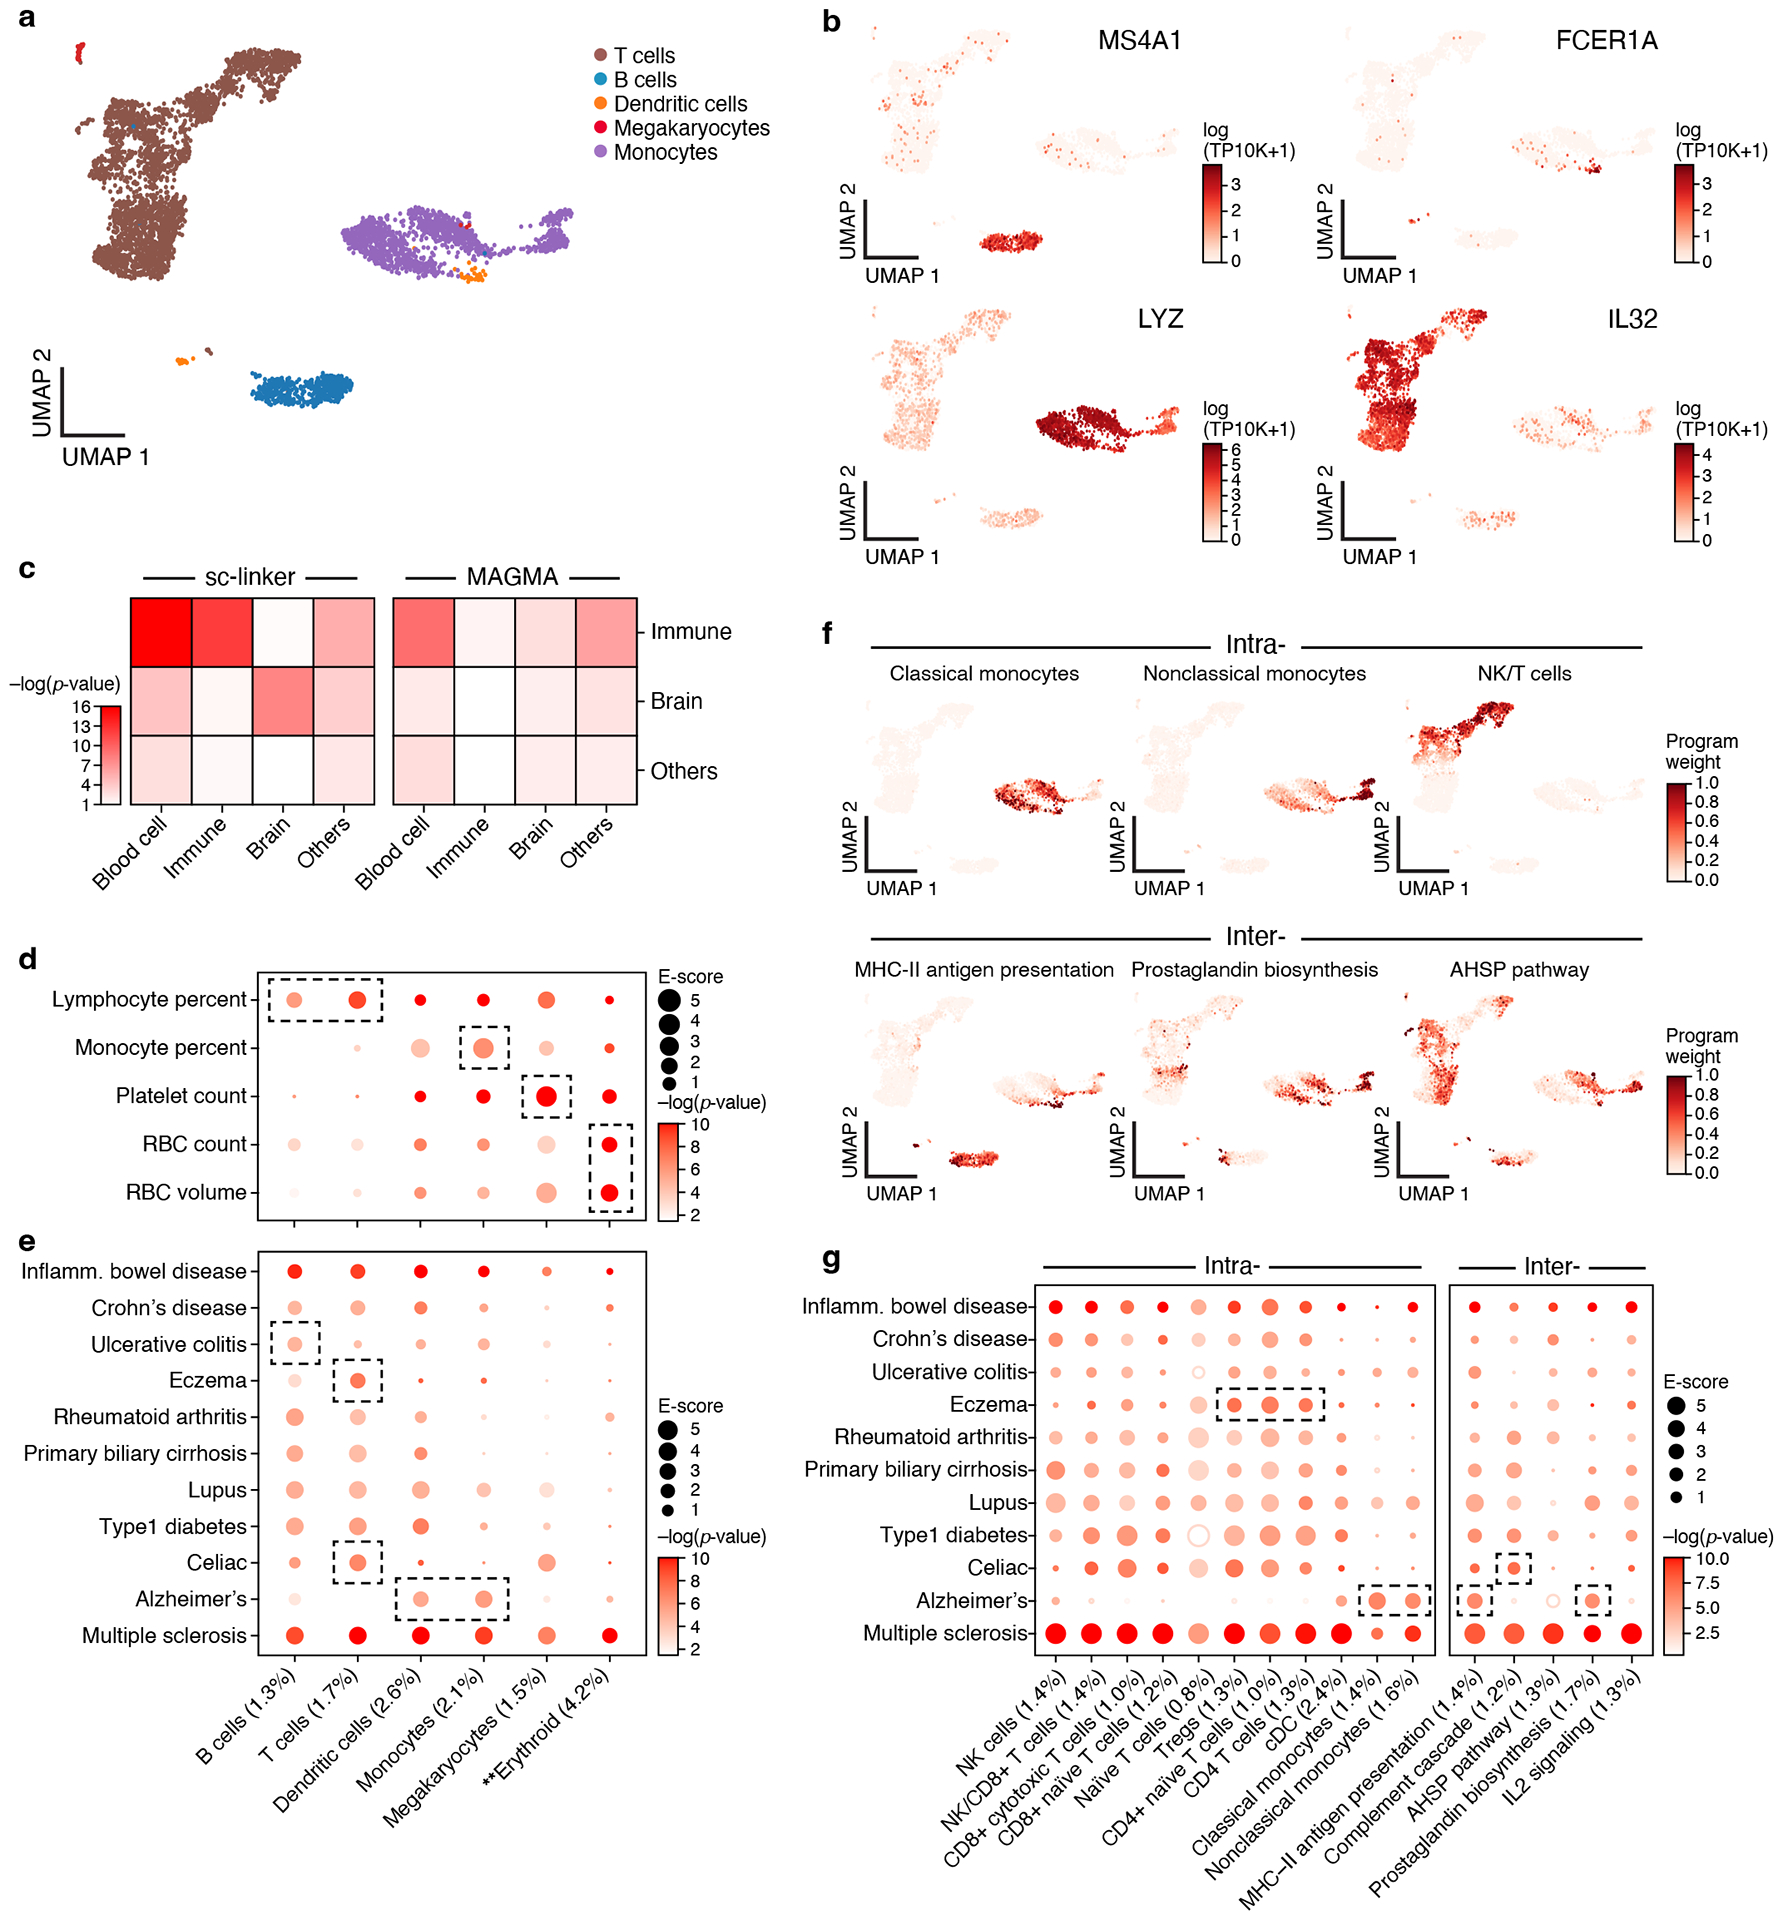
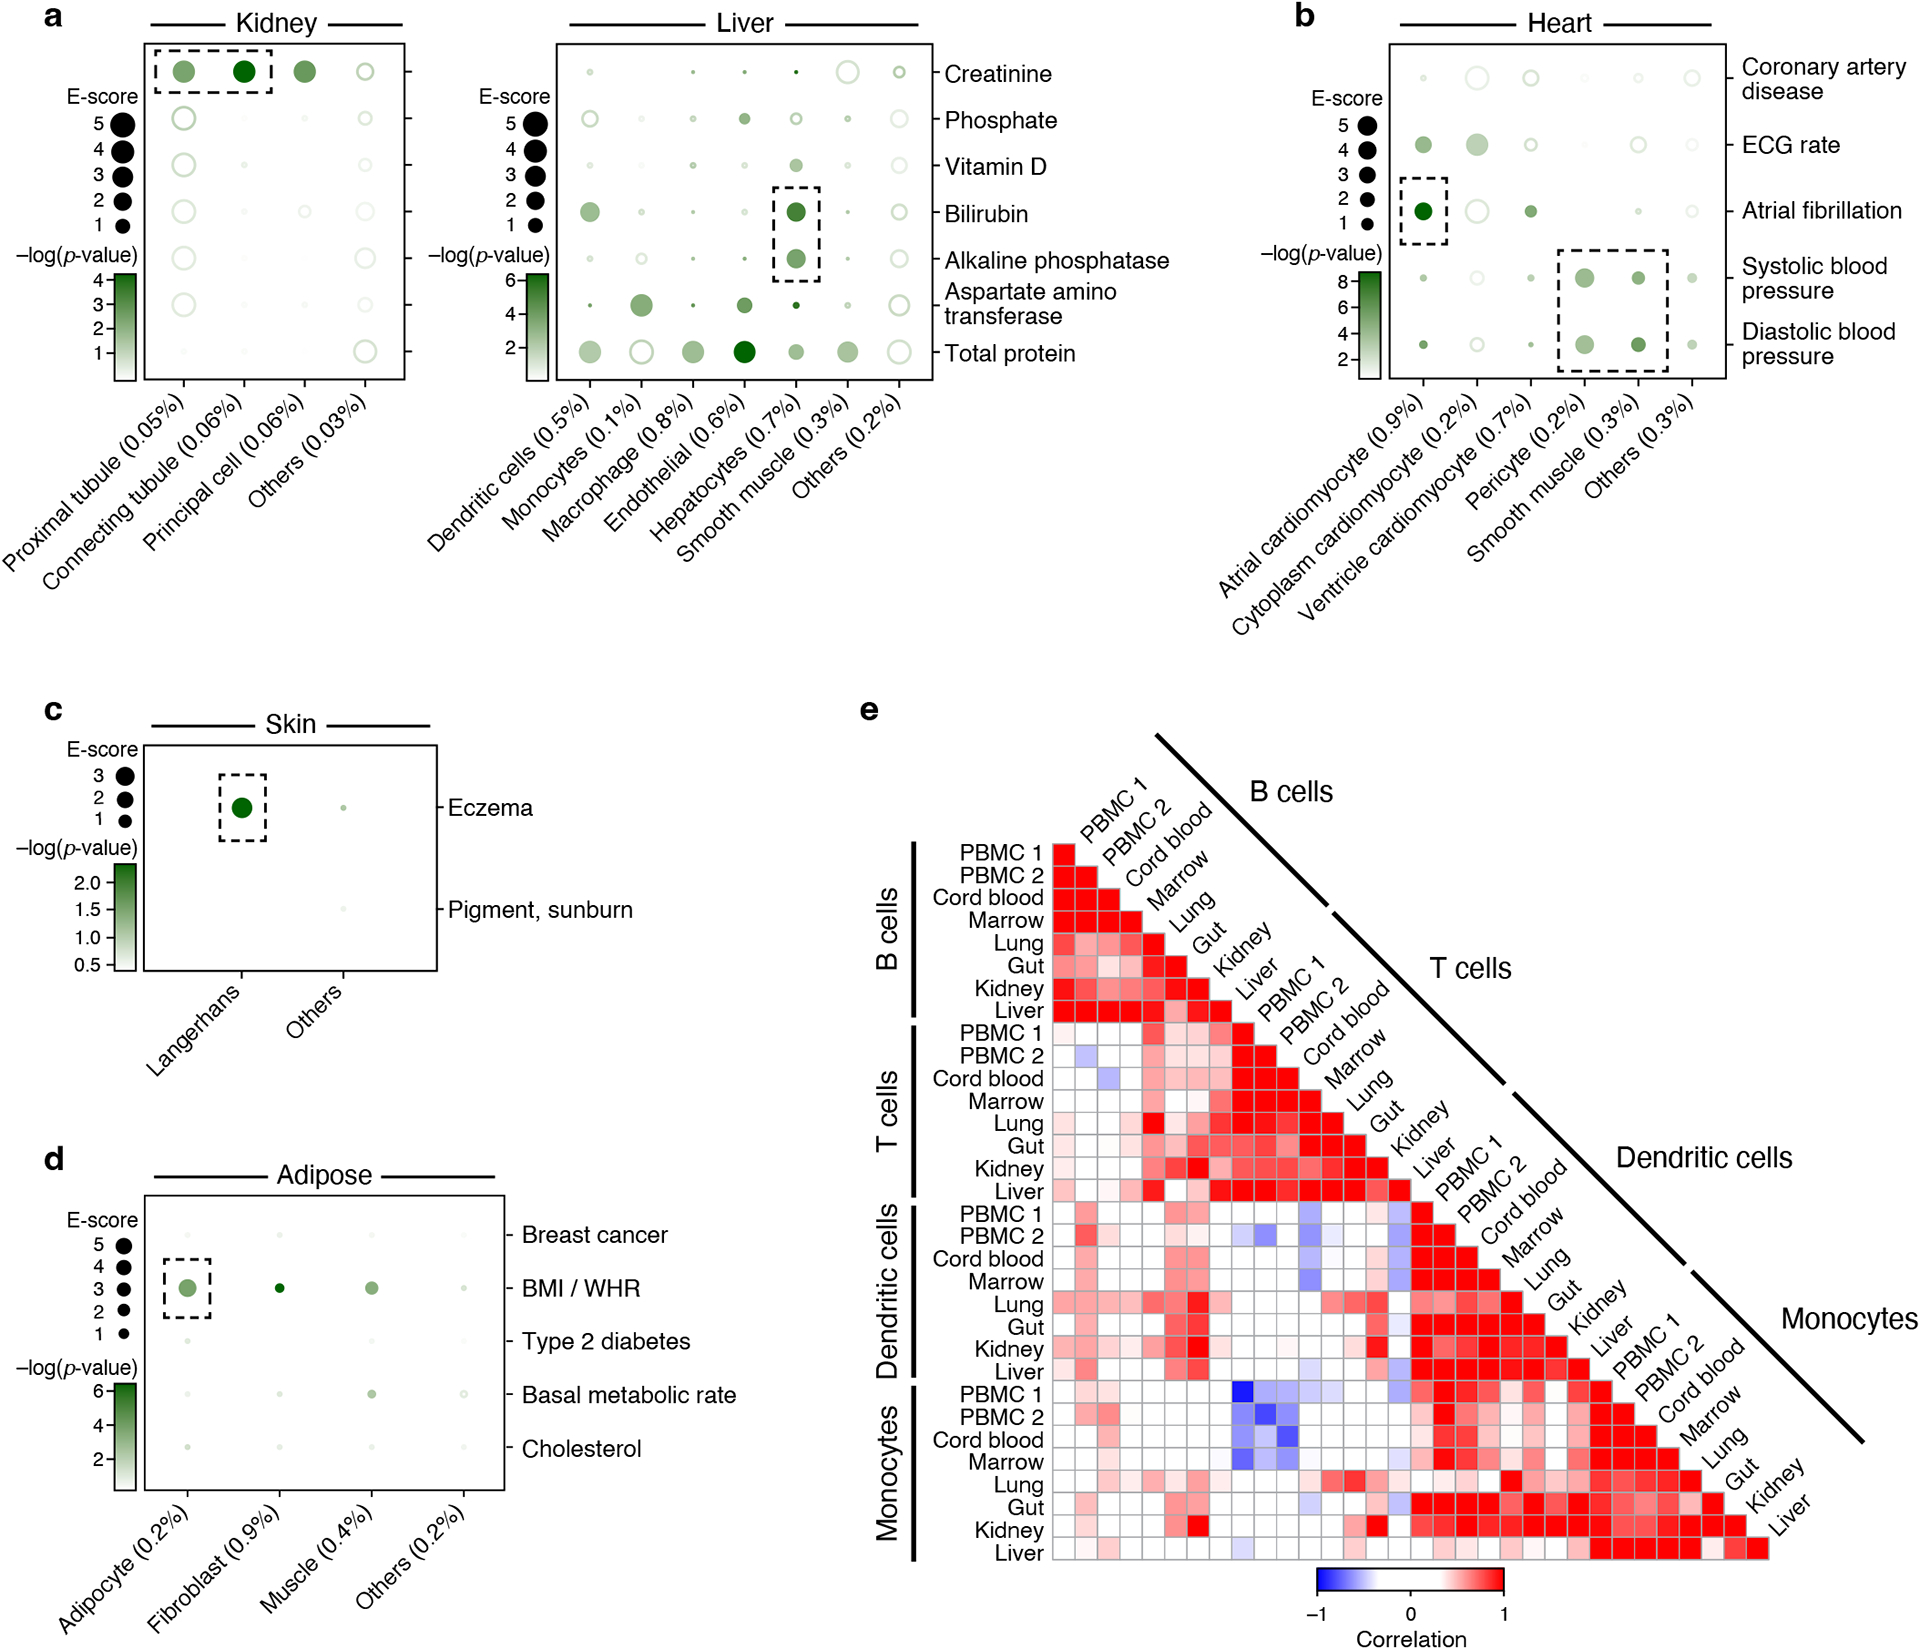
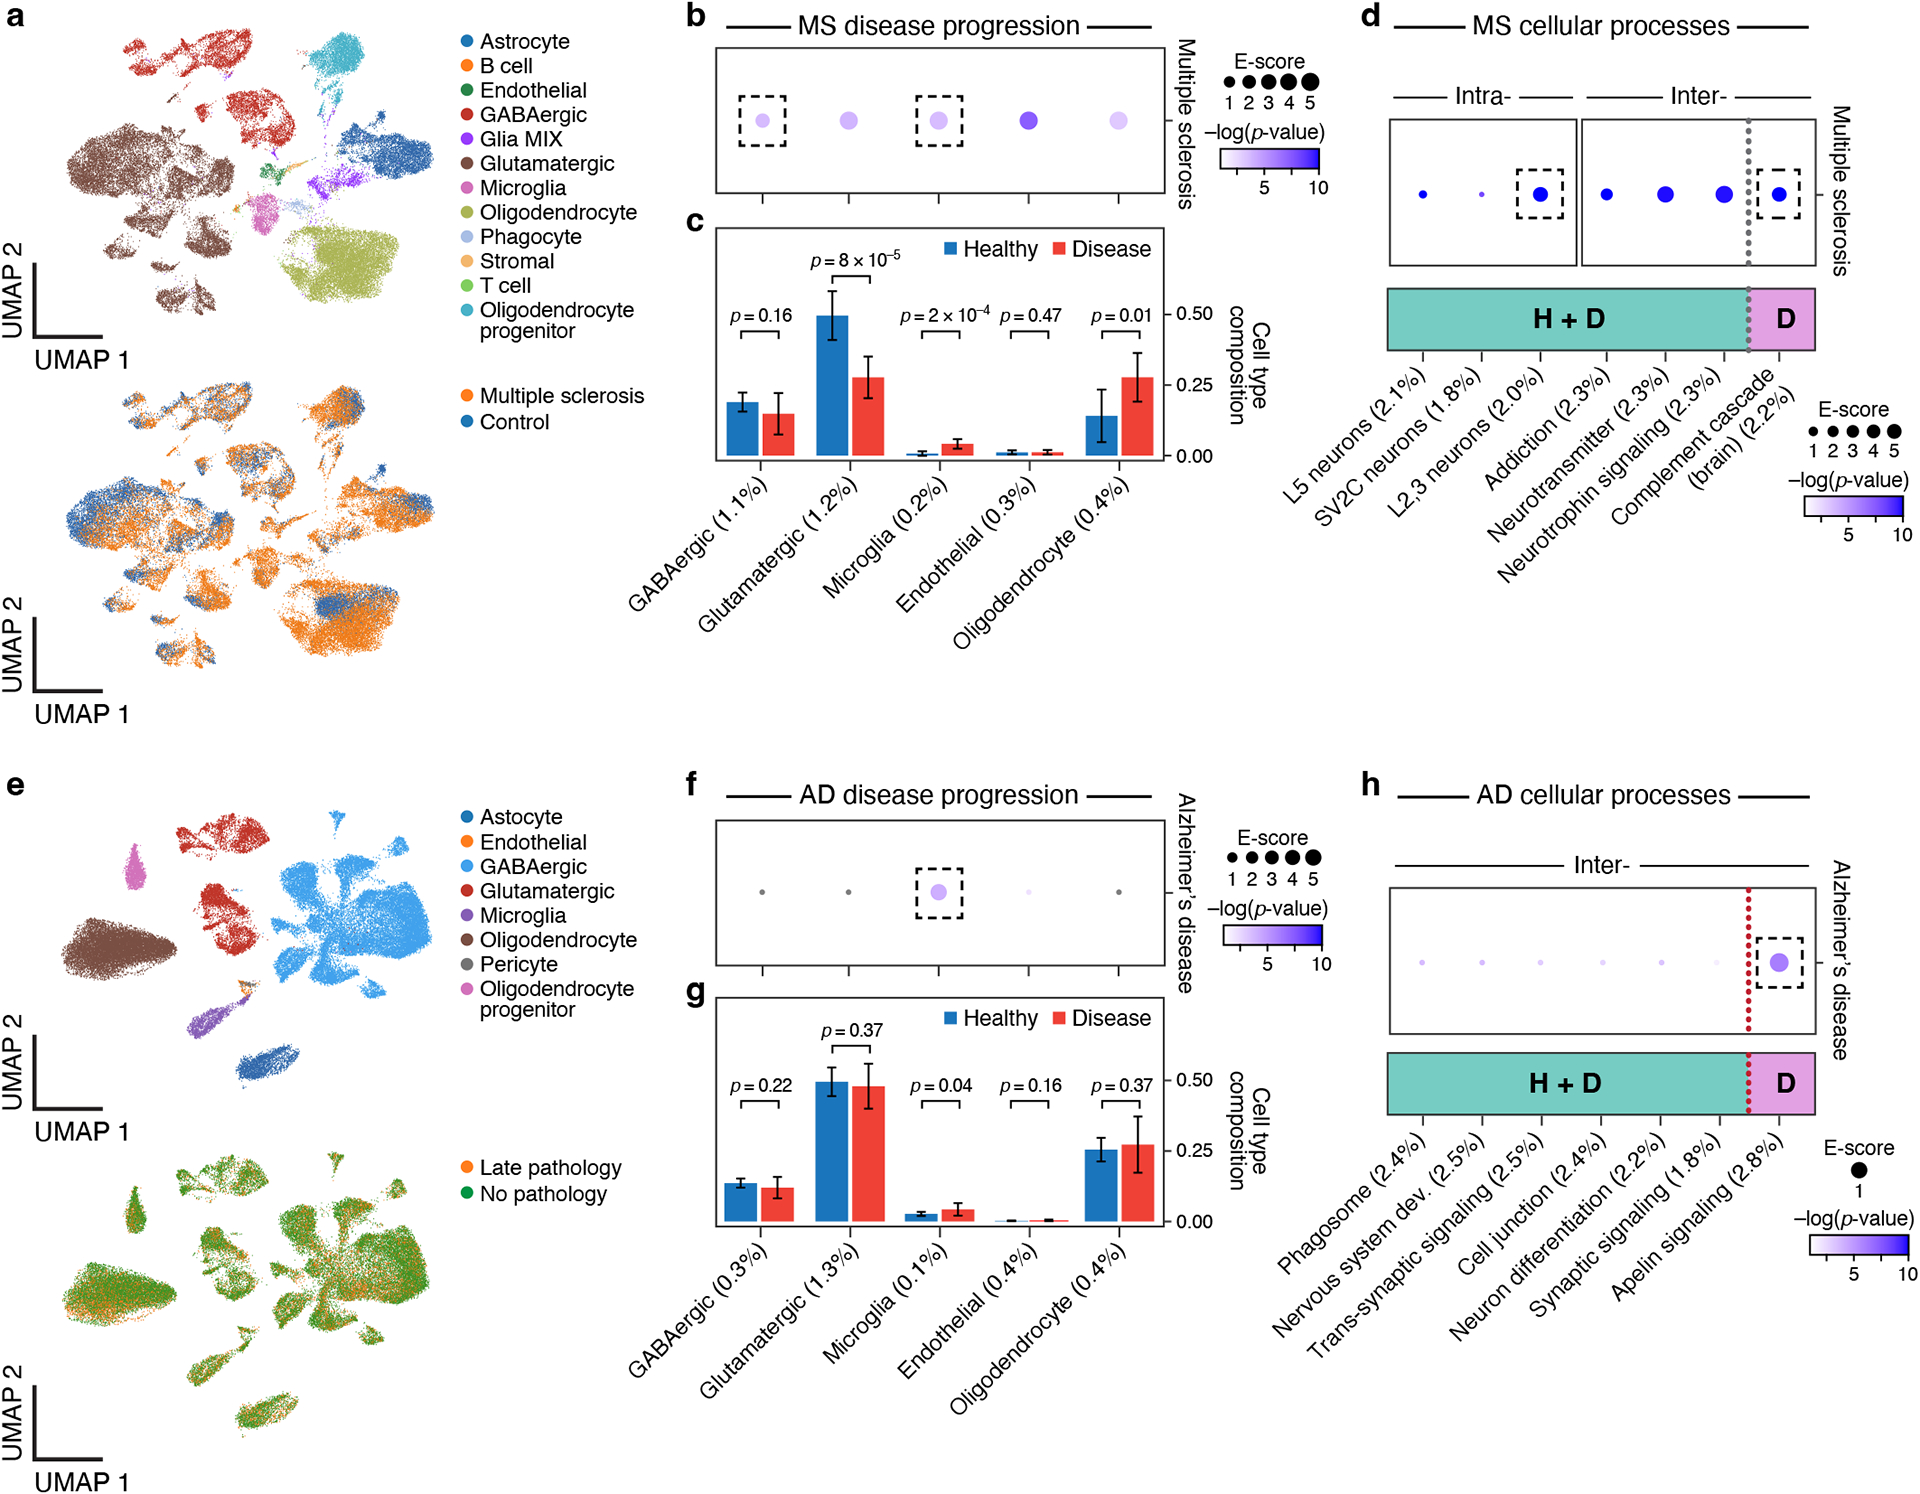
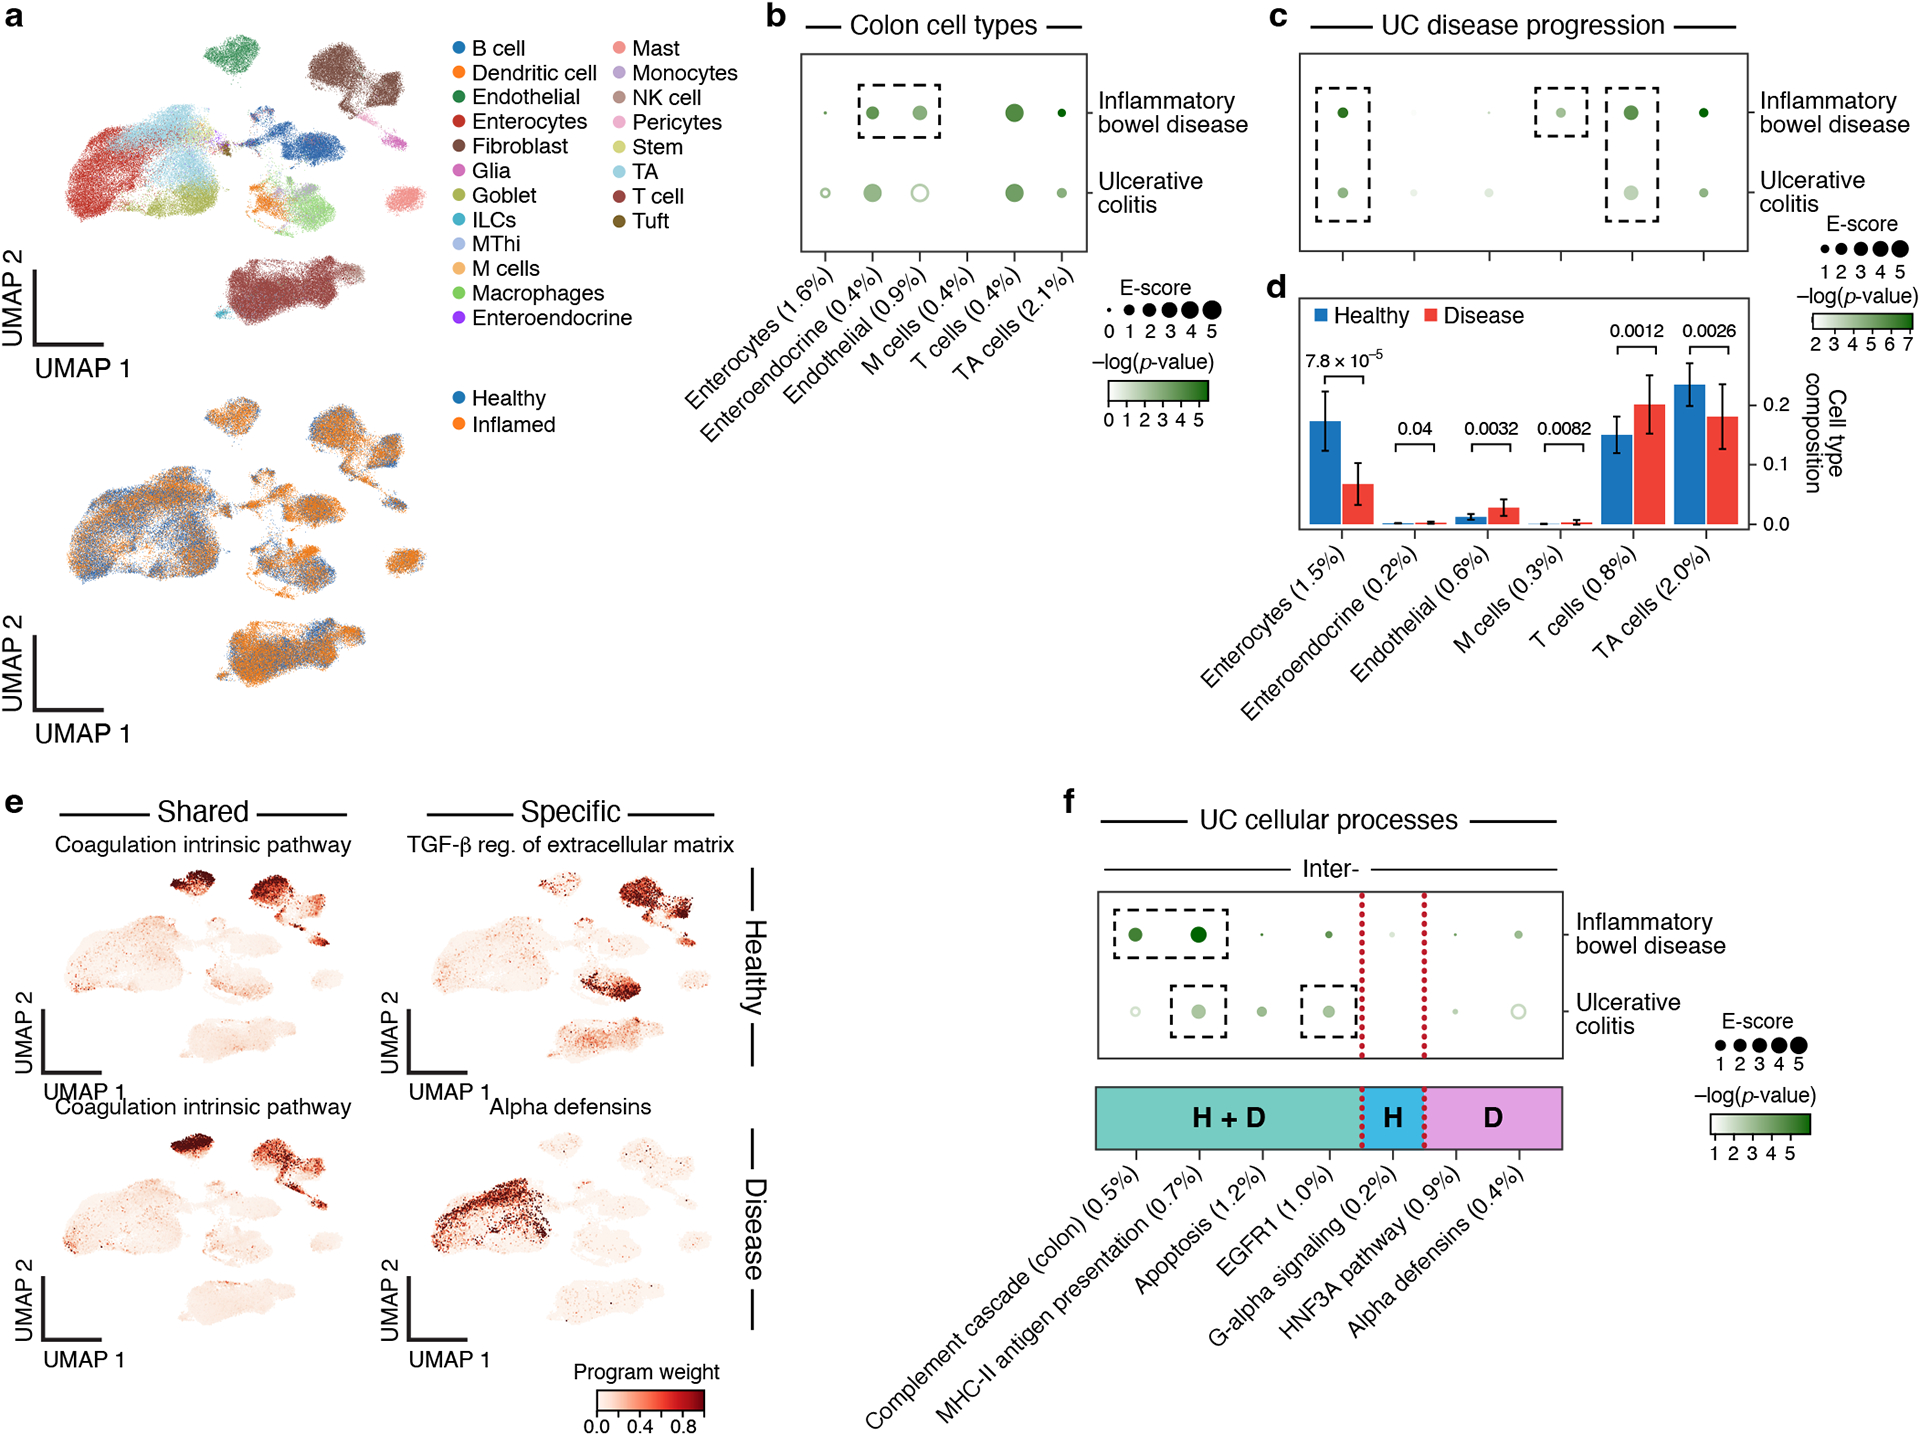
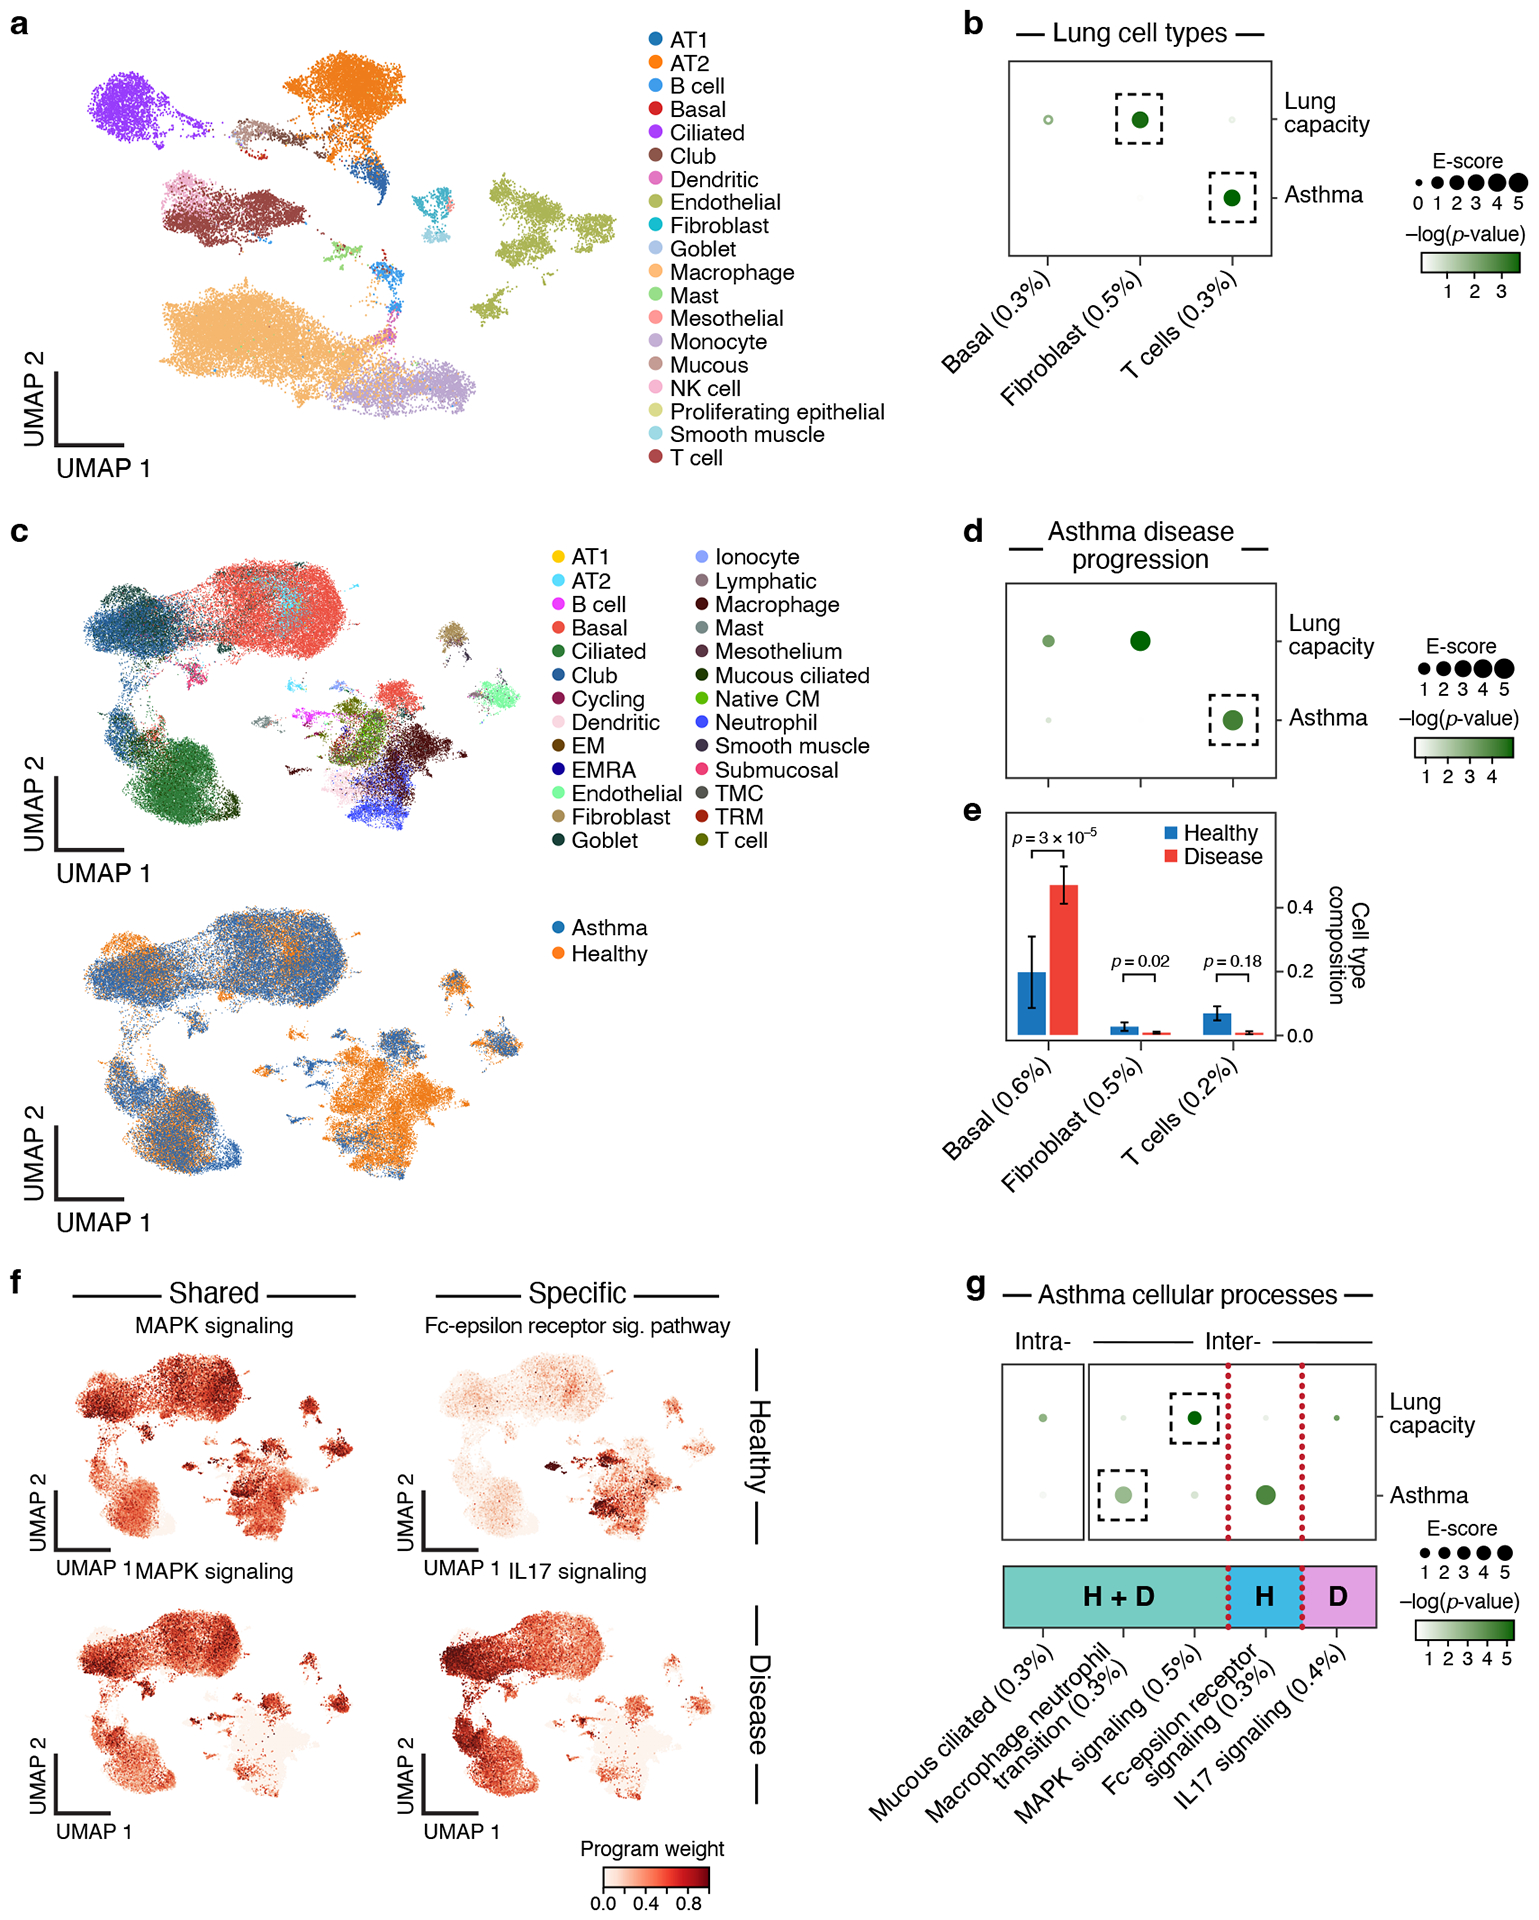
Genome-wide association studies provide a powerful means of identifying loci and genes contributing to disease, but in many cases, the related cell types/states through which genes confer disease risk remain unknown. Deciphering such relationships is important for identifying pathogenic processes and developing therapeutics. In the present study, we introduce sc-linker, a framework for integrating single-cell RNA-sequencing, epigenomic SNP-to-gene maps and genome-wide association study summary statistics to infer the underlying cell types and processes by which genetic variants influence disease. The inferred disease enrichments recapitulated known biology and highlighted notable cell-disease relationships, including γ-aminobutyric acid-ergic neurons in major depressive disorder, a disease-dependent M-cell program in ulcerative colitis and a disease-specific complement cascade process in multiple sclerosis. In autoimmune disease, both healthy and disease-dependent immune cell-type programs were associated, whereas only disease-dependent epithelial cell programs were prominent, suggesting a role in disease response rather than initiation. Our framework provides a powerful approach for identifying the cell types and cellular processes by which genetic variants influence disease.


Conflict of interest statement

COMPETING INTERESTS

A.R. is a co-founder and equity holder of Celsius Therapeutics, an equity holder in Immunitas, and was an SAB member of ThermoFisher Scientific, Syros Pharmaceuticals, Neogene Therapeutics and Asimov. From August 1, 2020, A.R. is an employee of Genentech. The remaining authors declare no competing interests.

Figures

Extended Data Fig. 1.
Extended Data Fig. 1.. Single-cell RNA-seq datasets.
UMAP embedding of scRNA-seq profiles (dots) colored by cell type annotations from 12 datasets (labels on top).
Extended Data Fig. 2.
Extended Data Fig. 2.. Standardized effect sizes of immune and brain cell type programs.
Standardized effect size (τ*) (dot size) and significance (−log10(P-value), dot color) of the heritability enrichment of immune (a,b) or brain (c) cell type programs (columns) for blood cell traits (a), immune disease traits (b), or neurological/psychological related traits (c), based on SNP annotations generated with the Roadmap∪ABC-immune (a,b) or Roadmap∪ABC-brain (c) enhancer-gene linking strategy. Numerical results are reported in Supplementary Data 1. Details for all traits analyzed are in Supplementary Table 2.
Extended Data Fig. 3.
Extended Data Fig. 3.. Linking cell type programs to diseases and traits across all analyzed tissues.
Magnitude (E-score, dot size) and significance (−log10(P-value), dot color) of the heritability enrichment of cell type programs (columns) from each of nine tissues (color code, legend) for GWAS summary statistics of diverse traits and diseases (rows), based on the Roadmap∪ABC enhancer-gene linking strategy for the corresponding tissue. Details for all traits analyzed are in Supplementary Table 2. See Data Availability for higher resolution version of this figure.
Extended Data Fig. 4.
Extended Data Fig. 4.. Cross trait analysis of cell type enrichments.
Pearson correlation coefficient (colorbar) between the cell type enrichment profiles of each pair of traits (rows, columns), clustered (dashed lines) hierarchically. Trait clusters labeled by their overall cell type enrichments.
Extended Data Fig. 5.
Extended Data Fig. 5.. Linking cellular process programs to relevant diseases and traits in each of six tissues.
Magnitude (E-score, dot size) and significance (−log10(P-value), dot color) of the heritability enrichment of cellular process programs (columns; obtained by NMF) in each of seven tissues (label on top) for traits relevant in that tissue (rows) using the Roadmap∪ABC strategy for the corresponding tissue. Details for all traits analyzed are in Supplementary Table 2.
Extended Data Fig. 6.
Extended Data Fig. 6.. Analysis of cell type programs using a non-tissue-specific enhancer-gene linking strategy.
Magnitude (E-score, dot size) and significance (−log10(P-value), dot color) of the heritability enrichment of immune (a), brain (b), lung (c), heart (d), colon (e), adipose (f) and skin (g) cell type programs (columns) for traits relevant in that tissue (rows) using a non-tissue-specific Roadmap∪ABC strategy. Details for all traits analyzed are in Supplementary Table 2.
Extended Data Fig. 7.
Extended Data Fig. 7.. Disease-dependent programs have low correlations with healthy and disease cell type programs.
Pearson correlation coefficient (color bar) of gene program membership vectors between healthy cell type, disease cell type and disease-dependent programs in scRNA-seq studies from a disease tissue (label on top) and the corresponding healthy tissue.
Extended Data Fig. 8.
Extended Data Fig. 8.. Disease specificity of disease-dependent programs.
Proportion of disease-dependent programs with a −log10(P-value) of enrichment score (p.E-score) > 3 in IBD, MS and asthma GWAS summary statistics (column) for disease-dependent programs from IBD, MS and asthma (columns), when combined with tissue-specific Roadmap∪ABC (row).
Extended Data Fig. 9.
Extended Data Fig. 9.. Analysis of disease-dependent programs using alternative Roadmap∪ABC enhancer-gene linking strategies.
Magnitude (E-score, dot size) and significance (−log10(P-value), dot color) of the heritability enrichment of disease-dependent programs (columns) in UC (colon cells) using Roadmap∪ABC-immune (a), asthma (lung cells) using Roadmap∪ABC-immune (b), and MS (brain cells) using Roadmap∪ABC-brain (c). Details for all traits analyzed are in Supplementary Table 2.
Extended Data Fig. 10.
Extended Data Fig. 10.. Analysis of disease-dependent programs across all tissues and traits.
Magnitude (E-score, dot size) and significance (−log10(P-value), dot color) of the heritability enrichment of disease-dependent programs (columns) from UC, MS, Alzheimer’s, asthma and pulmonary fibrosis (labels on top, color code, legend), for GWAS summary statistics of diverse traits and diseases (rows), based on the Roadmap∪ABC enhancer-gene linking strategy for the corresponding tissue. Details for all traits analyzed are in Supplementary Table 2. See Data Availability for higher resolution version of this figure.
Figure 1.
Figure 1.. Approach for identifying disease-critical cell types and cellular processes by integration of single-cell profiles and human genetics.
a. sc-linker framework. Left: Input. scRNA-seq (top) and GWAS (bottom) data. Middle and right: Step 1: Deriving cell type, disease-dependent, and cellular process gene programs from scRNA-seq (top) and associating SNPs with traits from human GWAS (bottom). Step 2: Generation of SNP annotations. Gene programs are linked to SNPs by enhancer-gene linking strategies to generate SNP annotations. Step 3: S-LDSC is applied to the resulting SNP annotations to evaluate heritability enrichment for a trait. b. Constructing gene programs. Top: Cell type programs of genes specifically expressed in one cell type vs. others. Middle: disease-dependent programs of genes specifically expressed in cells of the same type in disease vs. healthy samples. Bottom: cellular process programs of genes co-varying either within or across cell subsets; these programs may be healthy-specific, disease-specific, or shared. c. Examples of disease-gene program-gene relationships recovered by our framework.
Figure 2.
Figure 2.. Linking immune cell types and cellular processes to immune-related diseases and blood cell traits.
a,b. Immune cell types. Uniform Manifold Approximation and Projection (UMAP) embedding of peripheral blood mononuclear cell (PBMC) scRNA-seq profiles (dots) colored by cell type annotations (a) or expression of cell-type-specific genes (b). c. Benchmarking of sc-linker vs. MAGMA. Significance (average −log10(p-value)) of association between immune, brain and other tissue cell type programs (rows) and blood cell, immune-related, brain-related and other traits (columns) for sc-linker (left) and MAGMA gene set analysis (right). Other cell types × other diseases/traits are not included in the specificity calculation, due to the broad set of cell types and diseases/traits in this category. For the MAGMA analysis, the gene program is binarized using a threshold=0.95; numerical results for other binarization thresholds and continuous variable based approaches are reported in Supplementary Data 7. d,e. Enrichments of immune cell type programs for blood cell traits and immune-related diseases. Magnitude (E-score, dot size) and significance (−log10(P-value), dot color) of the heritability enrichment of immune cell type programs (columns) for blood cell traits (rows, d) or immune-related diseases (rows, e). f. Examples of inter- and intra-cell type cellular process programs. UMAP of PBMC (as in a), colored by each program weight (color bar) from non-negative matrix factorization (NMF). g. Enrichments of immune cellular process programs for immune-related diseases. Magnitude (E-score, dot size) and significance (−log10(p-value), dot color) of the heritability enrichment of cellular process programs (columns) for immune-related diseases (rows). In panels d,e,g, the size of each corresponding SNP annotation (% of SNPs) is reported in parentheses, and the dashed boxes denote results that are highlighted in the main text. Numerical results are reported in Supplementary Data 1,3. Further details of all diseases and traits analyzed are provided in Supplementary Table 2. **Erythroid cells were observed in only bone marrow and cord blood datasets.
Figure 3.
Figure 3.. Linking neuron cell subsets and cellular processes to brain-related diseases and traits.
a,b. Major brain cell types. UMAP embedding of brain scRNA-seq profiles (dots) colored by cell type annotations (a) or expression of cell-type-specific genes (b). c. Enrichments of brain cell type programs for brain-related diseases and traits. Magnitude (E-score, dot size) and significance (−log10(P-value), dot color) of the heritability enrichment of brain cell type programs (columns) for brain-related diseases and traits (rows). d. Comparison of immune vs. brain cell type programs, enhancer-gene linking strategies, and diseases/traits. Magnitude (E-score and SE) of the heritability enrichment of immune vs. brain cell type programs (columns) constructed using immune vs. brain enhancer-gene linking strategies (left and right panels) for immune-related (n=11) vs. brain-related (n=11) diseases and traits (top and bottom panels). Data are presented as mean values +/− SEM. e. Examples of inter- and intra-cell type cellular processes. UMAP (as in a), colored by each program weight (color bar) from non-negative matrix factorization (NMF). f. Enrichments of brain cellular process programs for brain-related diseases and traits. Each of the cellular process programs is constructed using NMF to decompose the cells by genes matrix into two matrices, cells by programs and programs by genes. Magnitude (E-score, dot size) and significance (−log10(P-value), dot color) of the heritability enrichment of cellular process programs (columns) for brain-related diseases and traits (rows). In panels c and f, the size of each corresponding SNP annotation (% of SNPs) is reported in parentheses. Numerical results are reported in Supplementary Data 1,3. Further details of all diseases and traits analyzed are provided in Supplementary Table 2.
Figure 4.
Figure 4.. Linking cell types from diverse human tissues to disease.
a-d. Enrichments of cell type programs for corresponding diseases and traits. Magnitude (E-score, dot size) and significance (−log10(P-value), dot color) of the heritability enrichment of cell type programs (columns) for diseases and traits relevant to the corresponding tissue (rows) for kidney and liver (a), heart (b), skin (c) and adipose (d). The size of each corresponding SNP annotation (% of SNPs) is reported in parentheses. Numerical results are reported in Supplementary Data 1. Further details of all traits analyzed are provided in Supplementary Table 2. e. Correlation of immune cell type programs across tissues. Pearson correlation coefficients (color bar) of gene-level program memberships for immune cell type programs across different tissues (rows, columns), grouped by cell type (labels).
Figure 5.
Figure 5.. Linking MS and AD disease-dependent and cellular process programs to MS and AD.
a. UMAP embedding of scRNA-seq profiles (dots) from MS and healthy brain tissue, colored by cell type annotations (top) or disease status (bottom). b. Enrichments of MS disease-dependent programs for MS. Magnitude (E-score, dot size) and significance (−log10(P-value), dot color) of the heritability enrichment of MS disease-dependent programs (columns), based on the Roadmap∪ABC-immune enhancer-gene linking strategy. c. Proportion (mean and SE) of the corresponding cell types (columns) in healthy (blue) and MS (red) n=21 biologically independent brain samples. P-value: one-sided Fisher’s exact test. d. Enrichments of MS cellular process programs for MS. Magnitude (E-score, dot size) and significance (−log10(P-value), dot color) of the heritability enrichment of intra-cell type (left) or inter-cell type (right) cellular processes (healthy-specific (H), MS-specific (D) or shared (H+D)) (columns), based on the Roadmap∪ABC-immune enhancer-gene linking strategy. e. UMAP embedding of scRNA-seq profiles (dots) from AD and healthy brain tissue, colored by cell type annotations (top) or disease status (bottom). f. Enrichments of AD disease-dependent programs for AD. Magnitude (E-score, dot size) and significance (−log10(P-value), dot color) of the heritability enrichment of AD disease-dependent programs (columns), based on the Roadmap∪ABC-immune enhancer-gene linking strategy. g. Proportion (mean and SE) of the corresponding cell types (columns) in healthy (blue) and AD (red) n=48 biologically independent brain samples. P-value: one-sided Fisher’s exact test. h. Enrichments of AD cellular process programs for AD. Magnitude (E-score, dot size) and significance (−log10(P-value), dot color) of the heritability enrichment of inter-cell type cellular processes (AD-specific (D) or shared (H+D)) (columns), based on the Roadmap∪ABC-immune enhancer-gene linking strategy. In panels b,c,d,f,g,h, the size of each corresponding SNP annotation (% of SNPs) is reported in parentheses. Numerical results are reported in Supplementary Data 2,3. Further details of all traits analyzed are provided in Supplementary Table 2.
Figure 6.
Figure 6.. Linking UC disease-dependent and cellular process programs to UC and IBD.
a. UMAP embedding of scRNA-seq profiles (dots) from UC and healthy colon tissue, colored by cell type annotations (top) or disease status (bottom). b. Enrichments of healthy colon cell types for disease. Magnitude (E-score, dot size) and significance (−log10(P-value), dot color) of the heritability enrichment of colon cell type programs (columns) for IBD or UC (rows). Results for additional cell types, including immune cell types in colon, are reported in Extended Data Fig. 3 and Supplementary Data 1. c. Enrichments of UC disease-dependent programs for disease. Magnitude (E-score, dot size) and significance (−log10(P-value), dot color) of the heritability enrichment of UC disease-dependent programs (columns) for IBD or UC (rows). d. Proportion (mean and SE) of the corresponding cell types (columns) in healthy (blue) and UC (red) n=36 biologically independent colon samples. P-value: one sided Fisher’s exact test. e. Examples of shared (healthy and disease), healthy-specific, and disease-specific cellular process programs. UMAP (as in a), colored by each program weight (color bar) from NMF. f. Enrichments of UC cellular process programs for disease. Magnitude (E-score, dot size) and significance (−log10(P-value), dot color) of the heritability enrichment of inter-cell type cellular processes (shared (H+D), healthy-specific (H), or disease-specific (D)) (columns) for IBD or UC (rows). In panels b,c,d,f, the size of each corresponding SNP annotation (% of SNPs) is reported in parentheses. Numerical results are reported in Supplementary Data 1,2,3. Further details of all traits analyzed are provided in Supplementary Table 2.
Figure 7.
Figure 7.. Linking asthma disease-dependent and cellular process programs to asthma and lung capacity.
a. UMAP embedding of healthy lung scRNA-seq profiles (dots) colored by cell type annotations. b. Enrichments of healthy lung cell types for disease. Magnitude (E-score, dot size) and significance (−log10(P-value), dot color) of the heritability enrichment of healthy lung cell type programs (columns) for lung capacity or asthma (rows). c. UMAP embedding of scRNA-seq profiles (dots) from asthma and healthy lung tissue, colored by cell type annotations (top) or disease status (bottom). d. Enrichments of asthma disease-dependent programs for disease. Magnitude (E-score, dot size) and significance (−log10(P-value), dot color) of the heritability enrichment of asthma disease-dependent programs (columns) for lung capacity or asthma (rows). e. Proportion (mean and SE) of the corresponding cell types (columns), in healthy (blue) and asthma (red) n=54 biologically independent lung samples. P-value: one-sided Fisher’s exact test. f. Examples of shared (healthy and disease), healthy-specific, and disease-specific cellular process programs. UMAP (as in c), colored by each program weight (color bar) from NMF. g. Enrichments of asthma cellular process programs for disease. Magnitude (E-score, dot size) and significance (−log10(P-value), dot color) of the heritability enrichment of intra-cell type (left) and inter-cell type (right) cellular processes (shared (H+D), healthy-specific (H), or disease-specific (D)) (columns) for lung capacity and asthma GWAS summary statistics (rows). In panels b,d,e,g, the size of each corresponding SNP annotation (% of SNPs) is reported in parentheses. Numerical results are reported in Supplementary Data 1,2,3. Further details of all traits analyzed are provided in Supplementary Table 2.

Update of

Comment in

References

    1. Consortium, S. W. G. of the P. G. et al. Biological Insights From 108 Schizophrenia-Associated Genetic Loci. Nature 511, 421 (2014). - PMC - PubMed
    1. Visscher PM et al. 10 Years of GWAS Discovery: Biology, Function, and Translation. Am. J. Hum. Genet 101, 5 (2017). - PMC - PubMed
    1. Buniello A et al. The NHGRI-EBI GWAS Catalog of published genome-wide association studies, targeted arrays and summary statistics 2019. Nucleic Acids Res. 47, D1005–D1012 (2019). - PMC - PubMed
    1. Maurano MT et al. Systematic Localization of Common Disease-Associated Variation in Regulatory DNA. Science 337, 1190 (2012). - PMC - PubMed
    1. Price AL, Spencer CCA & Donnelly P Progress and promise in understanding the genetic basis of common diseases. Proc. R. Soc. B Biol. Sci 282, (2015). - PMC - PubMed

Publication types