. 2022 Dec;54(12):1827-1838.
doi: 10.1038/s41588-022-01182-0. Epub 2022 Sep 29.

The NALCN channel regulates metastasis and nonmalignant cell dissemination

Affiliations

The NALCN channel regulates metastasis and nonmalignant cell dissemination

Eric P Rahrmann et al. Nat Genet. 2022 Dec.

Abstract

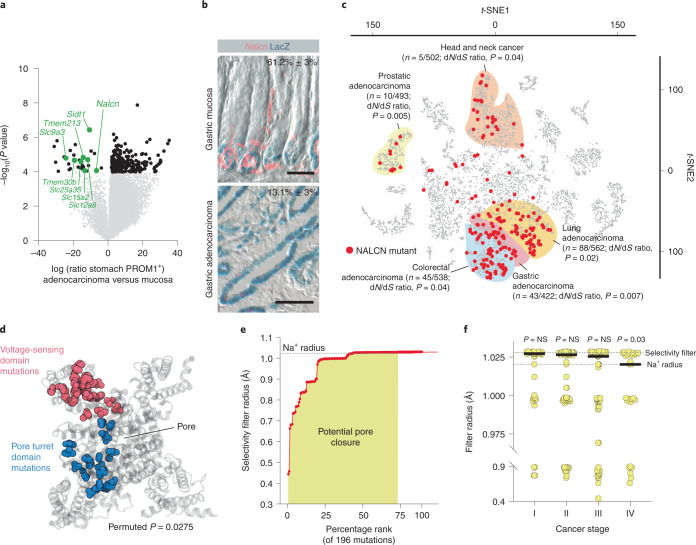
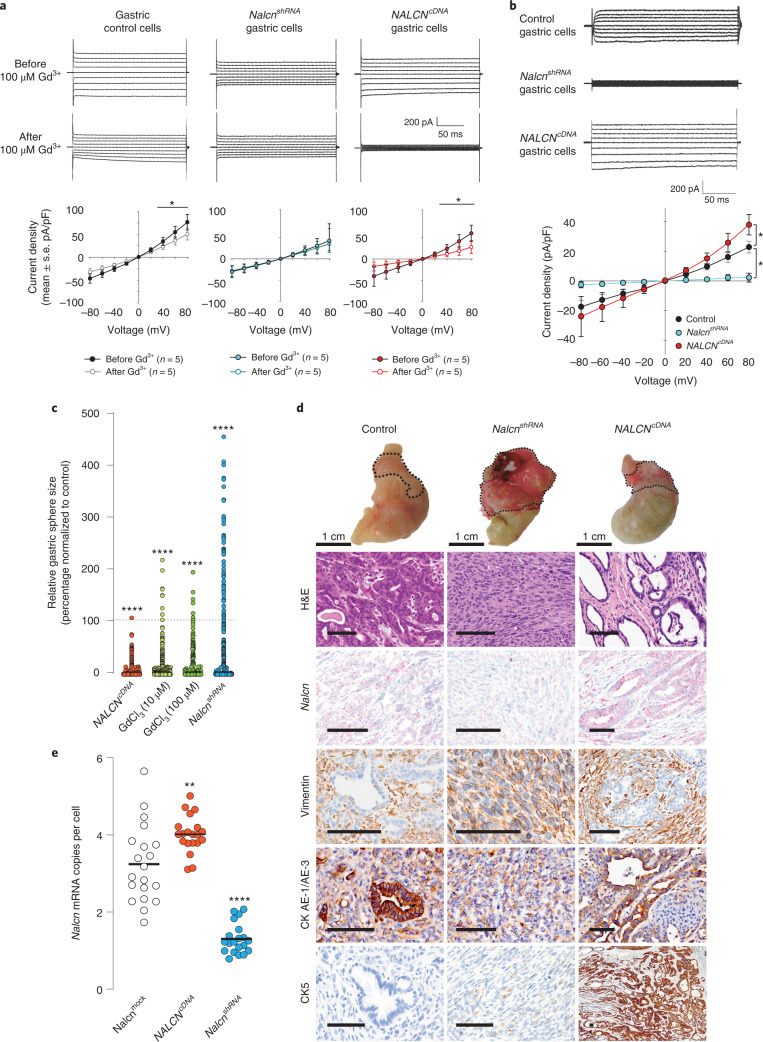
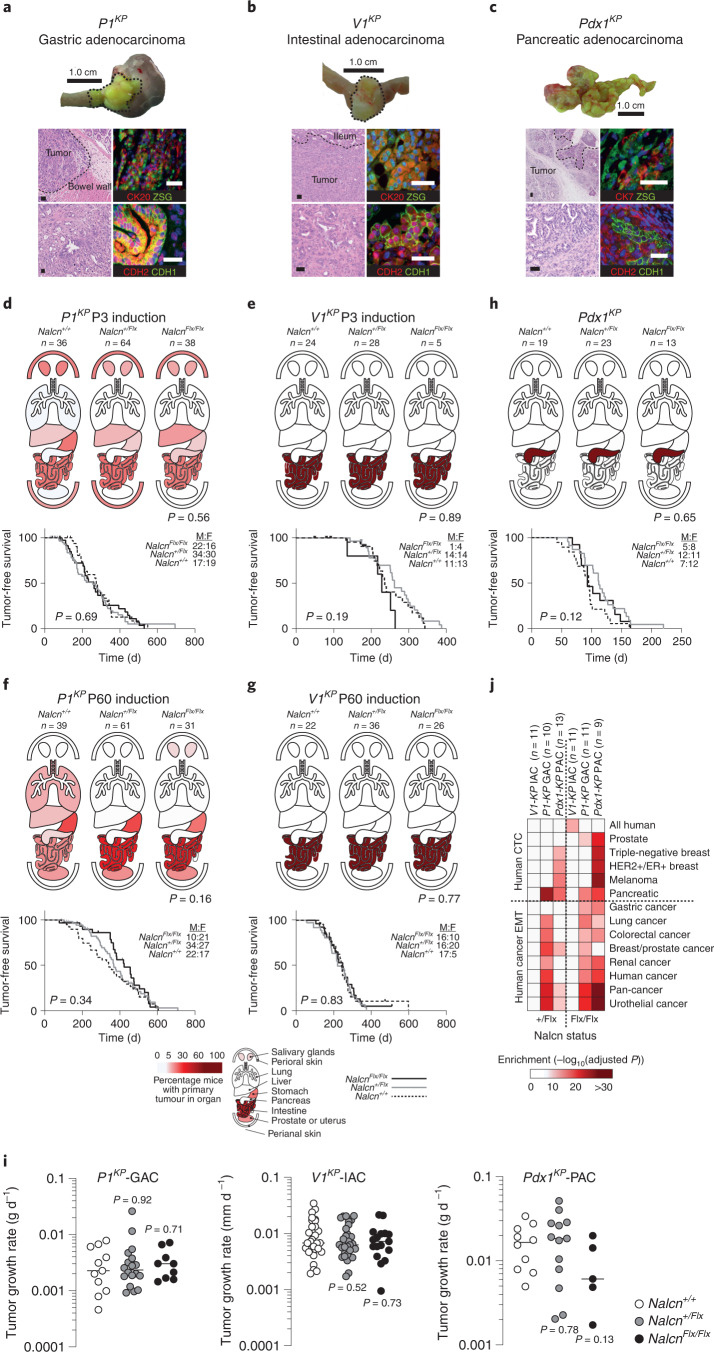
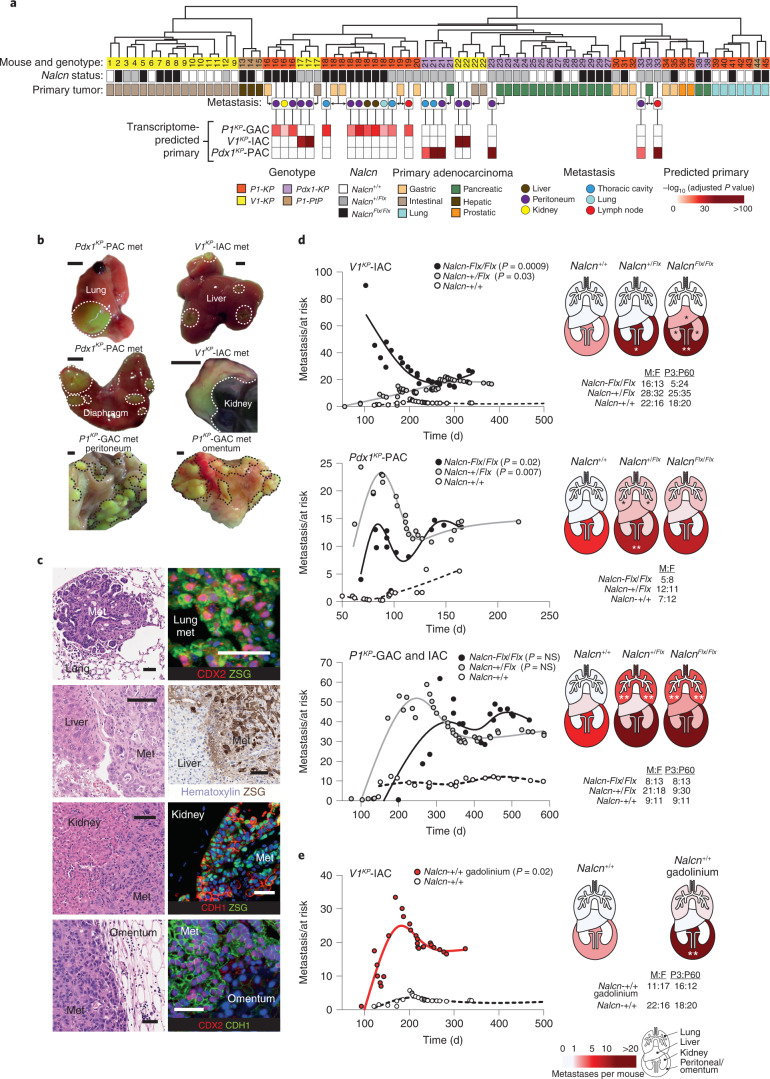
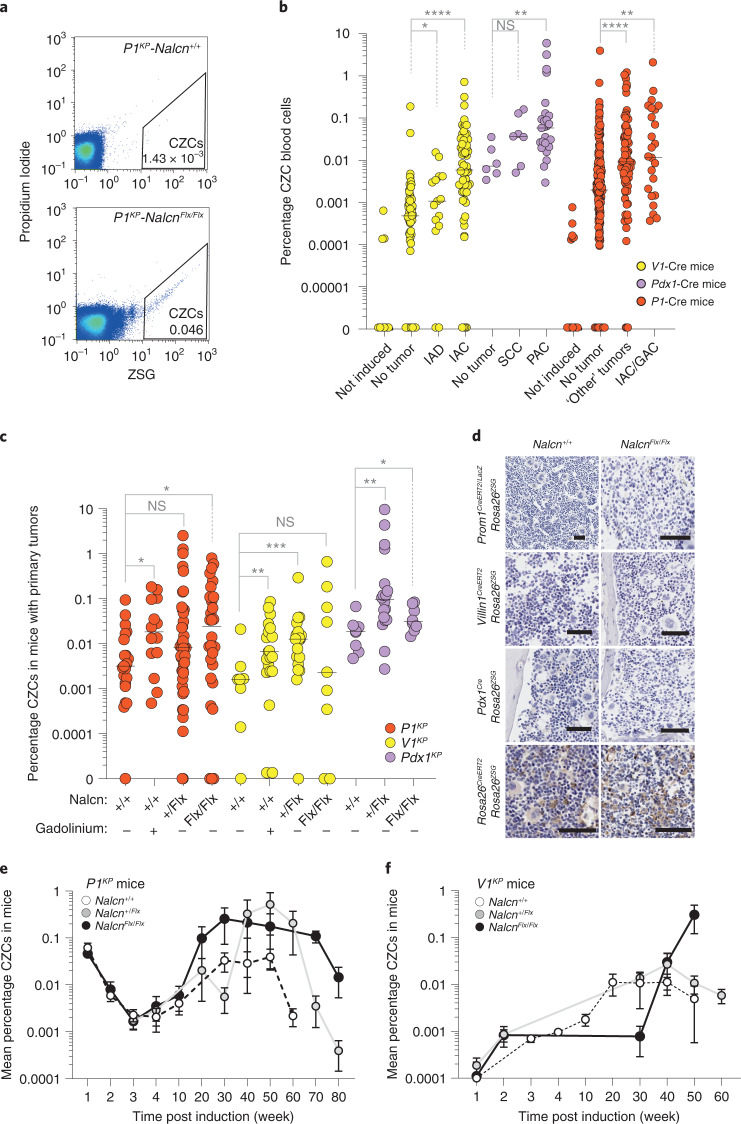
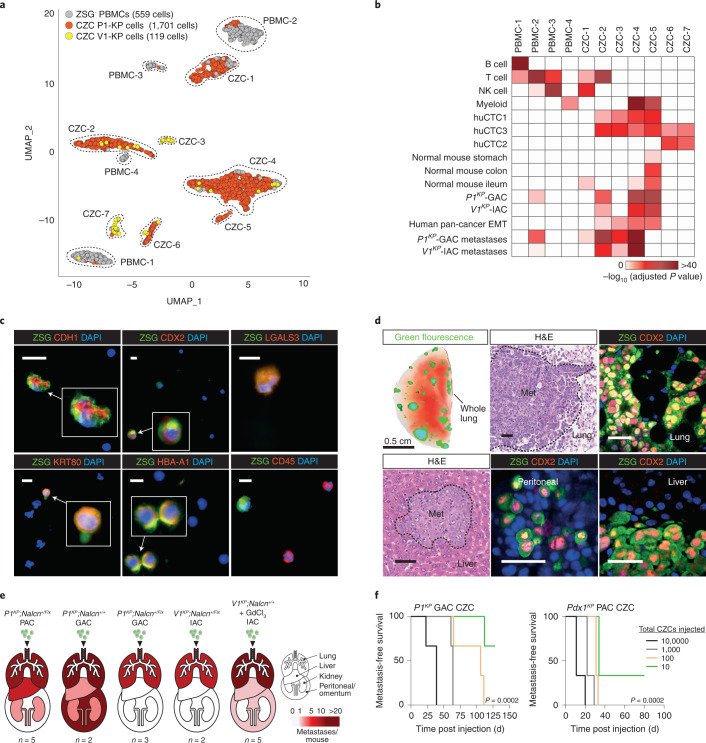
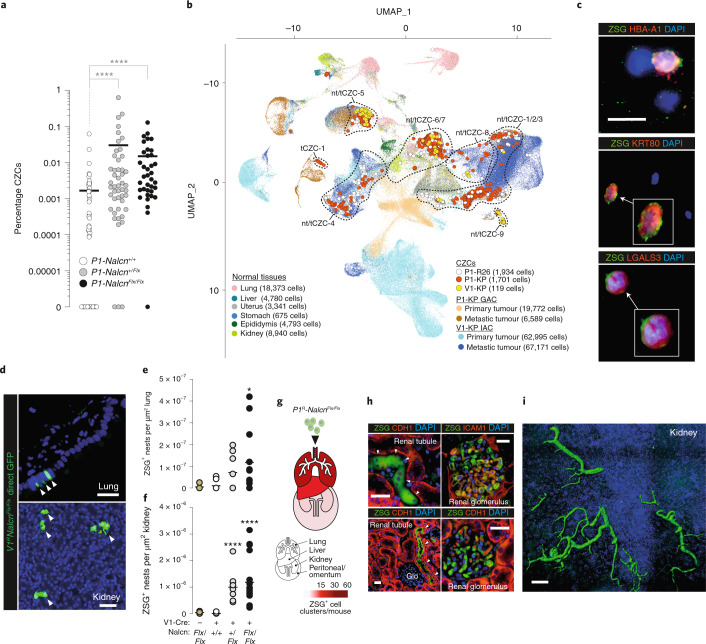
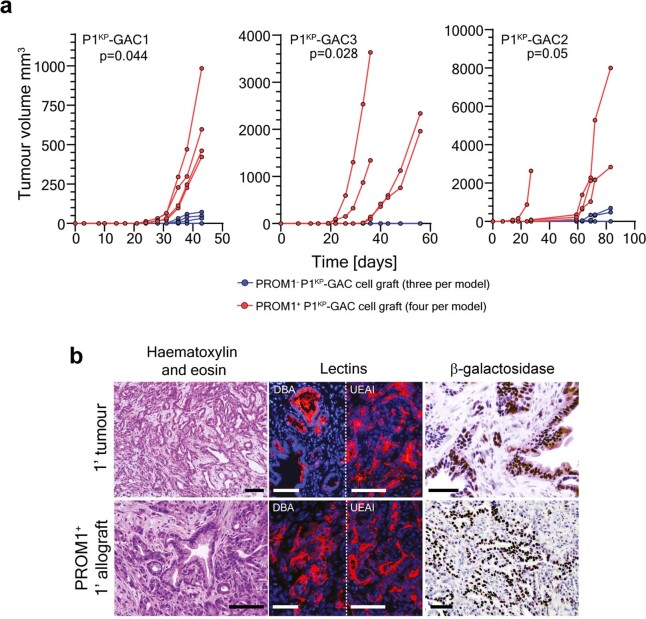
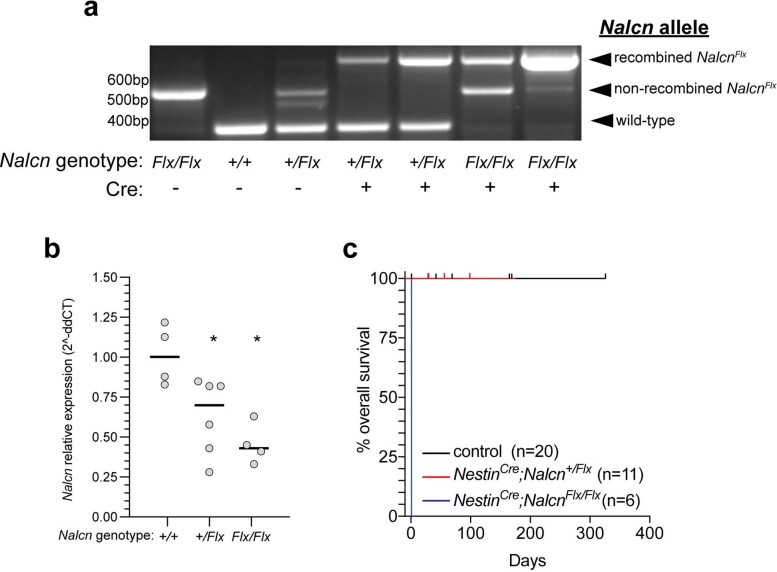
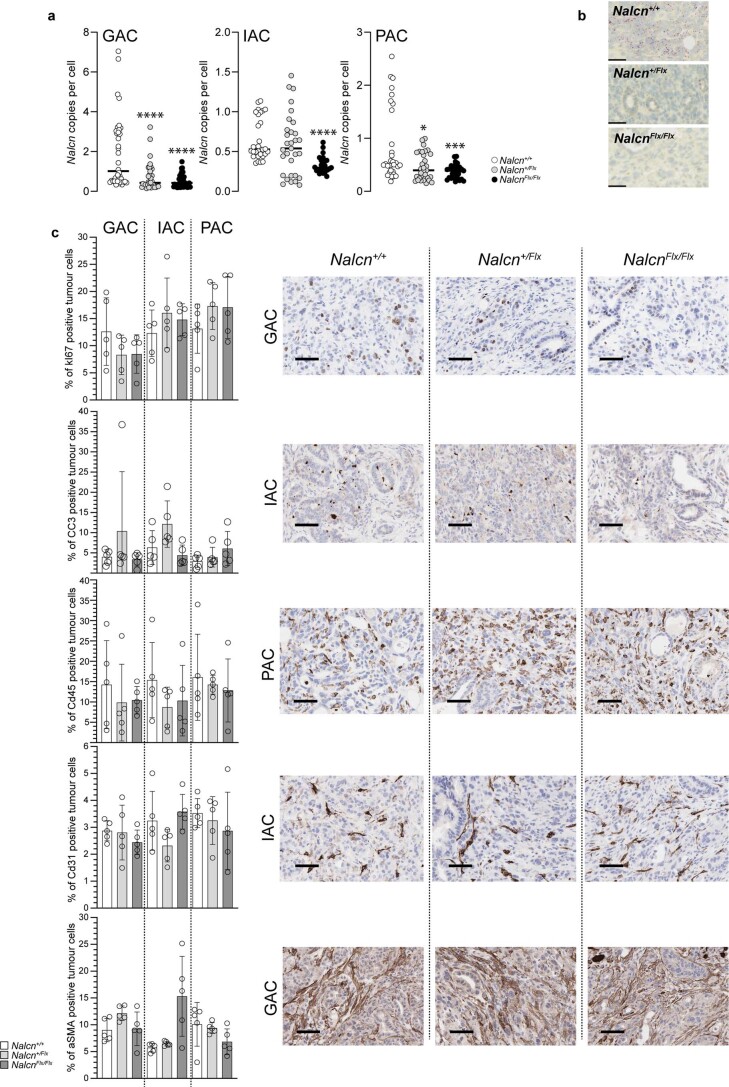
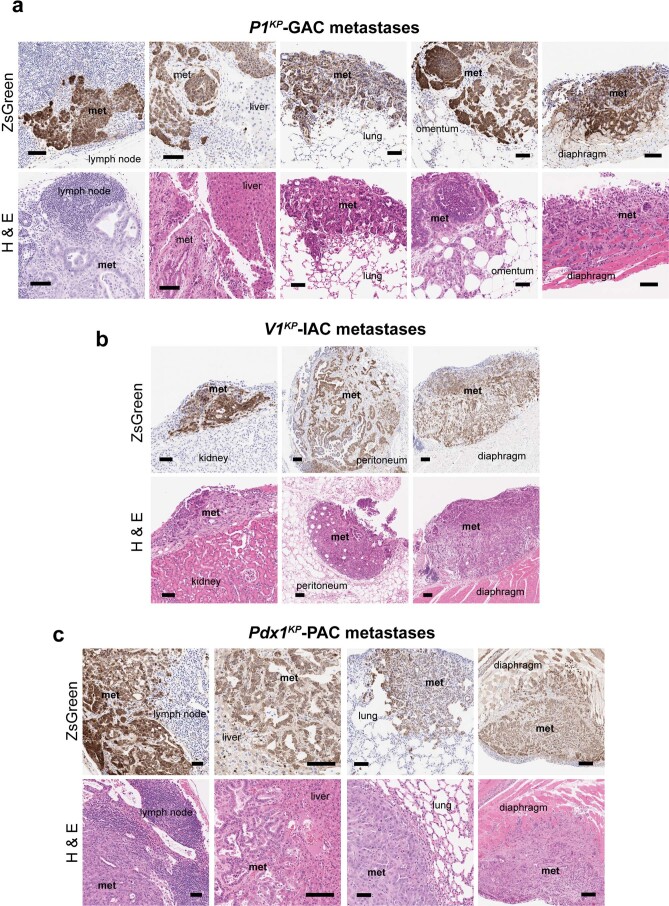
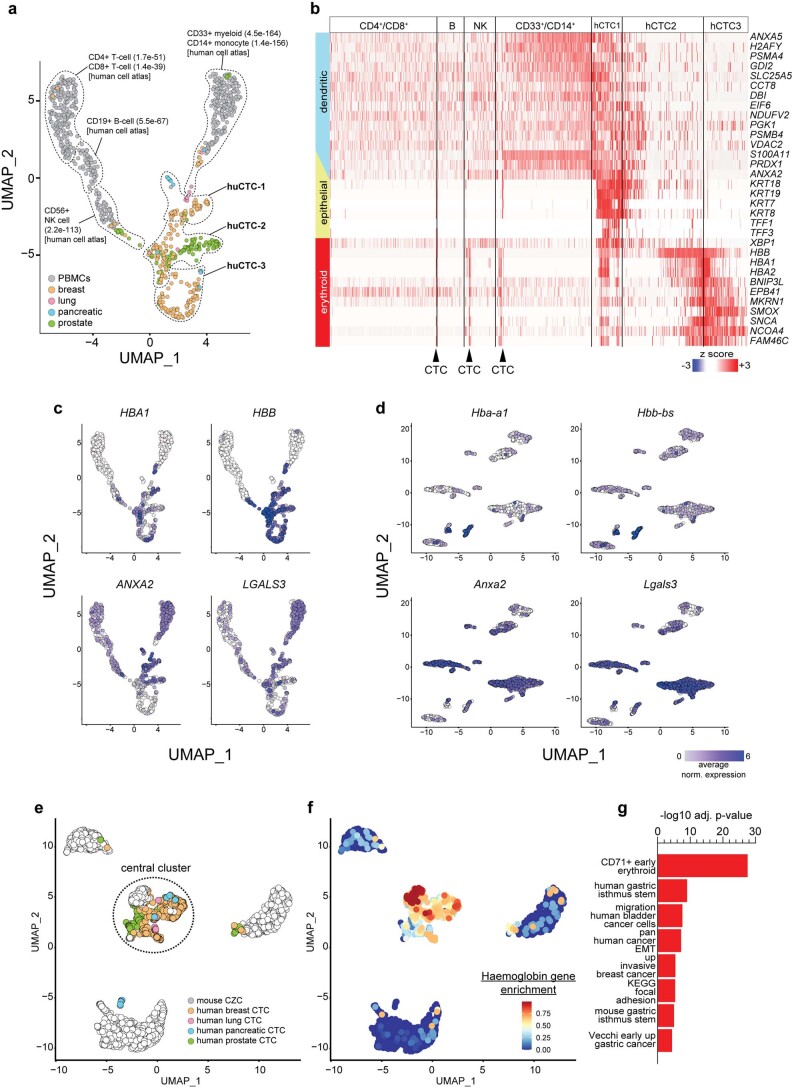
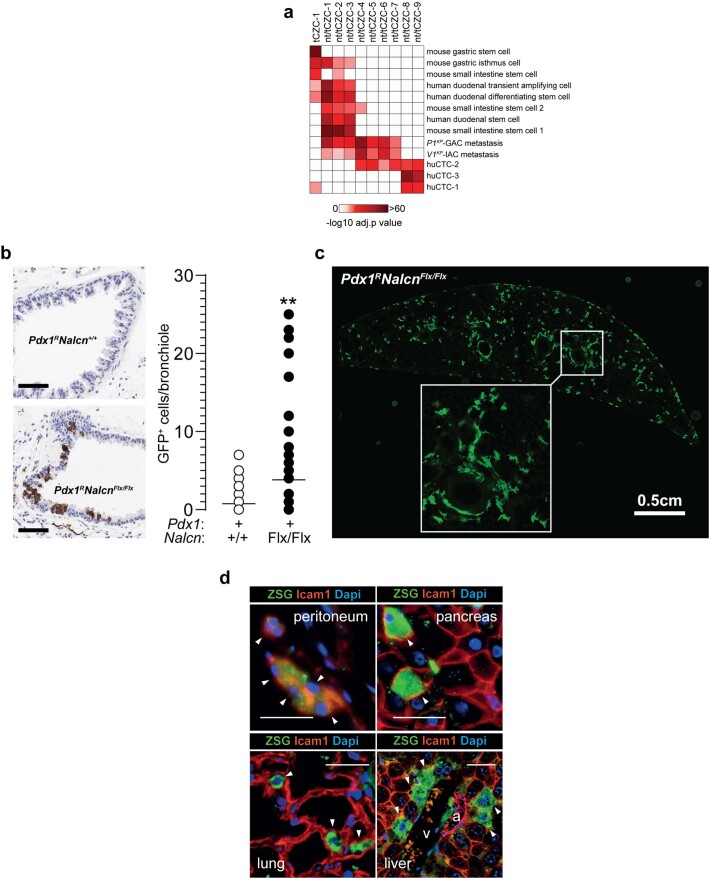
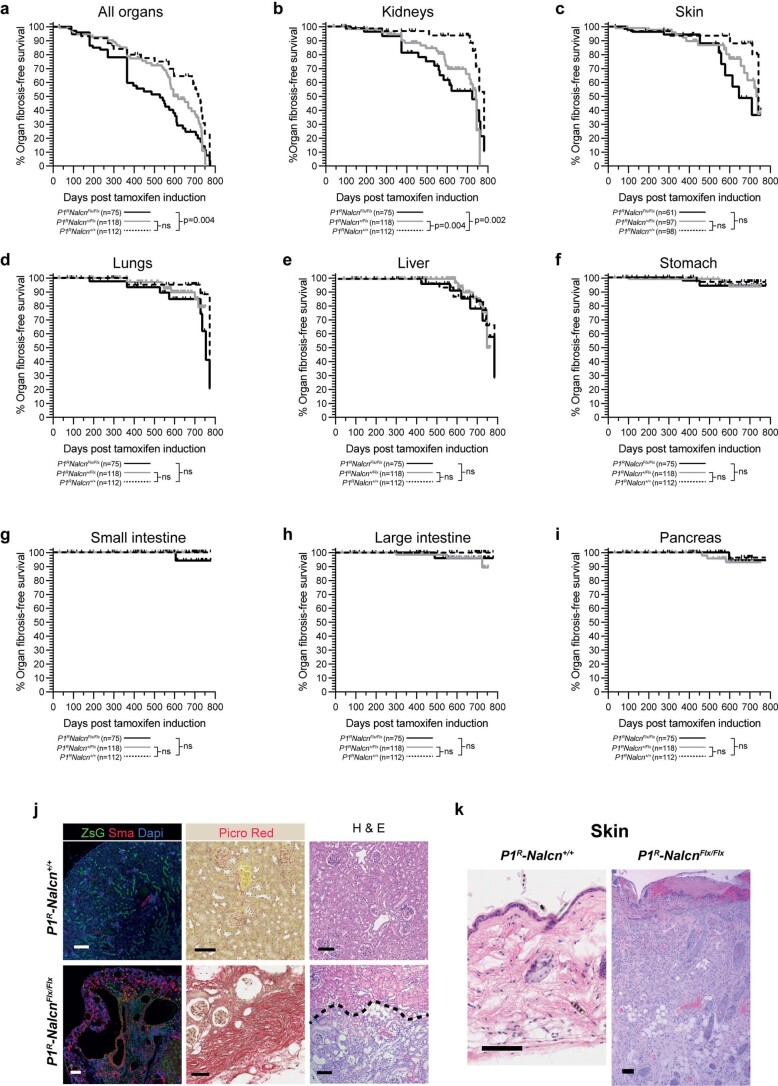
We identify the sodium leak channel non-selective protein (NALCN) as a key regulator of cancer metastasis and nonmalignant cell dissemination. Among 10,022 human cancers, NALCN loss-of-function mutations were enriched in gastric and colorectal cancers. Deletion of Nalcn from gastric, intestinal or pancreatic adenocarcinomas in mice did not alter tumor incidence, but markedly increased the number of circulating tumor cells (CTCs) and metastases. Treatment of these mice with gadolinium-a NALCN channel blocker-similarly increased CTCs and metastases. Deletion of Nalcn from mice that lacked oncogenic mutations and never developed cancer caused shedding of epithelial cells into the blood at levels equivalent to those seen in tumor-bearing animals. These cells trafficked to distant organs to form normal structures including lung epithelium, and kidney glomeruli and tubules. Thus, NALCN regulates cell shedding from solid tissues independent of cancer, divorcing this process from tumorigenesis and unmasking a potential new target for antimetastatic therapies.


Conflict of interest statement

The authors declare no competing interests.

Figures

Fig. 1
Fig. 1. NALCN loss-of-function in aggressive cancers.
a, Differential gene expression between normal PROM1+ gastric cells and P1KP-GAC cells (downregulated ion channels are highlighted). Benjamini–Hochberg corrected P value, alpha = 0.05. b, Nalcn RNA in situ hybridization and Prom1 expression (β-galactosidase (LacZ)) in Prom1CreERT2/LacZ mouse stomach (n = 3 biological replicates, 10 fields each; upper) and P1KP-GAC (n = 3 biological replicates, 10 fields each; lower). Numbers are shown as mean ± s.e.m. Prom1+/Nalcn+ cells. Scale bar, 50 μm. c, t-SNE plot of 10,022 human cancers (P value, dN/dS shown; Source data). d, Mutant residues enriched in NALCN pore turret (blue) and voltage-sensing (red) domains. P = 0.0275; permuted P value for probability of observing two clusters of 20 and 25 residues. e, Impact of 196 NALCN mutations on selectivity filter radius determined by HOLE analysis. f, NALCN pore closure by NALCN mutations in stage I (n = 47), stage II (n = 73), stage III (n = 74) and stage IV (n = 27) human cancers. Two-tailed Mann–Whitney U-test: stage I versus II, P = 0.3488; stage I versus III, P = 0.1613; stage I versus IV, P = 0.0293. Bar denotes median filter radius. Source data
Fig. 2
Fig. 2. NALCN regulates P1KP-GAC proliferation and morphology.
a, Current responses to voltage steps from −80 to 80 mV before (upper) and after (middle) addition of 100 μM gadolinium to P1KP-GAC control, NalcnshRNA- and NALCNcDNA-transfected cells, and current density responses to voltage steps before and after 100 μM gadolinium treatment (n = 5 biological replicate cells; values are mean ± s.e.m.). *P values at +40, + 60 and +80 mV for control gastric cells are 0.039, 0.032 and 0.023, respectively. P values at +40, +60 and +80 mV for NALCNcDNA cells are 0.013, 0.013 and 0.003, respectively (paired t-test). b, NALCN-mediated voltage-clamp ion currents from control, NalcnshRNA- and NALCNcDNA-transfected P1KP-GAC cells, and NALCN leak current density (current/cell membrane capacitance, mean ± s.e.m.) in control, NalcnshRNA- or NALCNcDNA-transfected cells (n = 5 cells each, P values comparing peak current at +80 mV voltage step are 0.05 control versus NALCNcDNA cells and 0.023 control versus NalcnshRNA cells; Holm–Sidak multiple comparison procedure). c, Impact of gadolinium treatment (10 µM, n = 386 organoids; 100 µM, n = 264), NalcnshRNA (n = 611) or NALCNcDNA (n = 1,472) transfection on P1KP-GAC organoid size normalized to average P1KP-GAC control treated organoids (P1KP 0 µM, n = 663 organoids, 4.274 ± 0.6238 (s.e.m.); P1KP shRNA control n = 651 organoids, 15.26 ± 2.406 (s.e.m.); P1KP cDNA control n = 583 organoids, 37.65 ± 5.872 (s.e.m.)). ***Exact P < 0.0001, two-tailed Mann–Whitney U-test. d, Representative macroscopic and photomicroscopic images of control (n = 27), NalcnshRNA (n = 21) or NALCNcDNA (n = 22) transduced P1KP-GAC orthotopic allografts. Nalcn RNA expression (in situ hybridization), and stromal (vimentin) and epithelial (CKAE1/AE3, CK7, CK5) marker immunohistochemistry are shown. Scale bar, 100 μm. e, Nalcn mRNA transcripts per tumor cell recorded in 20 individual tumor sections per treatment type. Bar, median. **P = 0.0024, ****P = 0.00006, two-tailed Mann–Whitney U-test. Source data
Fig. 3
Fig. 3. Nalcn deletion does not impact the incidence, tumor-free survival or growth rates of P1KP, V1KP or Pdx1KP primary tumors.
ac Tumors and representative photomicrographs (H&E from all tumors (left; Supplementary Table 9) and dual immunofluorescence from five independent tumors each (right)) for lineage tracing (ZSG), epithelial (CK7, CK20) and EMT markers (CDH2, CDH1) of P1KP-GAC (a), V1KP-IAC (b) and Pdx1KP-PAC (c). Scale bar, 50 μm. Single-channel images are shown in Supplementary Fig. 1. dg, Upper: organ heatmaps of tumor incidence in P1KP at P3 and V1KP at mice of each Nalcn genotype recombined at P3 (d,e) or P60 (f,g). Lower: survival curves of mice in each cohort. Male to female ration (M:F) is shown. P1KP P3, P = 0.6912; P1KP P60, P = 0.3897; V1KP P3, P = 0.1900; and V1KP P60, P = 0.8301. Mantel–Cox test. h, Organ primary tumor heatmaps and survival curves of Pdx1KP mice (P = 0.1095). Mantel–Cox test. Source data for dh are given in Supplementary Table 9. i, Growth rates of P1KP-GAC (n = 38), V1KP-IAC (n = 57) and Pdx1KP-PAC (n = 28) tumors. Two-tailed Mann–Whitney U-tests revealed no significant difference in growth rates among tumors with different Nalcn genotypes P1KP-GAC: Nalcn+/+ (n = 11) versus Nalcn+/Flx (n = 18; P = 0.912), versus NalcnFlx/Flx (n = 9; P = 0.7103). V1KP-IAC: Nalcn+/+ (n = 16) versus Nalcn+/Flx (n = 25; P = 0.5169), versus NalcnFlx/Flx (n = 16; P = 0.7309). Pdx1KP-PAC: Nalcn+/+ (n = 10) versus Nalcn+/Flx (n = 13; P = 0.7844), versus NalcnFlx/Flx (n = 5; P = 0.1292). Bar, median. Source data are given in Supplementary Table 10. j, Gene set enrichment analyses of transcriptomes of Nalcn+/Flx and NalcnFlx/Flx P1KP-GAC, V1KP-IAC and Pdx1KP-PAC versus Nalcn+/+ tumors. Source data
Fig. 4
Fig. 4. NALCN loss-of-function increases tumor metastasis.
a, Unsupervised hierarchical clustering of P1KP (GAC, n = 10; lung adenocarcinoma, n = 6; prostatic adenocarcinoma, n = 2), V1KP (IAC, n = 19), Pdx1KP (PAC, n = 13) and P1;PtenFlx/Flx;Trp53Flx/Flx (P1PtP) (hepatobiliary, n = 3; lung adenocarcinoma, n = 1) primary tumors and metastatic (liver, n = 2; peritoneum, n = 11; kidney, n = 1; thoracic cavity, n = 4; lung, n = 1; lymph node, n = 2) tumors. Heatmap reports enrichment of primary tumor transcriptomes in metastatic tumors. b, Exemplar ZSG+ metastatic tumors (met, outlined). Scale bar, 0.5 cm. c, Photomicrographs (H&E (left) and immunohistochemistry/fluorescence(right)) of the metastases in b. Scale bar, 50 μm. All enumerated metastases were evaluated using H&E (full list is given in Supplementary Table 9; n = 7,076 metastases); n = 59 metastases were evaluated by ZSG for IHC and n = 20 metastases were evaluated by immunofluorescence. Single-channel images are shown in Supplementary Fig. 1. d, Left: cumulative total number of adenocarcinoma metastases per mouse post Cre-recombination (two-tailed Mann–Whitney U-test, total tumor burden in Nalcn-deleted versus wild-type mice; Supplementary Table 9). Right: total metastases per mouse in anatomical regions. Male/female (M:F) and P3/P60 mice are shown. V1KP IAC for individual organs: liver, *P = 0.0371 (NalcnFlx/Flx); kidney, *P = 0.0229 (NalcnFlx/Flx); and peritoneum, *P = 0.0492 (Nalcn+/Flx) and **P = 0.0015 (NalcnFlx/Flx). Pdx1KP PAC individual organs: lung, *P = 0.0328 (Nalcn+/Flx); and peritoneum, **P = 0.0050 (Nalcn+/Flx). P1KP GAC and IAC individual organs: lung, **P = 0.0085 (Nalcn+/Flx) and **P = 0.0048 (NalcnFlx/Flx). e, Metastatic burden and organ metastases in V1KP-IAC gadolinium or control treated mice. **P = 0.0090, two-tailed Mann–Whitney U-test. Source data
Fig. 5
Fig. 5. NALCN loss-of-function increases nucleated CZCs in P1KP, V1KP and Pdx1KP mice.
a, FACS profiles gating CZCs in blood samples of P1KP Nalcn+/+ and NalcnFlx/Flx mice (per cent nucleated cells). Gating strategy is shown in Supplementary Fig. 2. b, Scatter plot of CZCs (per cent of total nucleated blood cells) of Prom1CreERT2/LacZ (n = 397), Villin-1CreERT2 (n = 162) or Pdx1Cre (n = 40) mice that did, or did not, contain a primary tumor. Data are biologically independent peripheral blood samples. Bar, median. V1-Cre: *P = 0.0499, ****P < 0.0001; Pdx1-Cre: not significant (NS) P = 0.0513, **P = 0.0033; P1-Cre: **P = 0.0033, ****P < 0.0001; two-tailed Mann–Whitney U-test. Source data are available in Supplementary Table 13. c, Scatter plot of CZCs according to genotype and gadolinium treatment in tumor-bearing animals. Data are biologically independent peripheral blood samples. Bar, median. P1KP (n = 112): *P = 0.02, NS P = 0.1204 ; V1KP (n = 64): **P = 0.0088, ***P = 0.0004, NS P = 0.4213; Pdx1KP (n = 34): *P = 0.0499, **P = 0.0027; two-tailed Mann–Whitney U-test. Source data are available in Supplementary Table 13. d, Representative photomicrographs of ZSG immunohistochemistry of bone marrow of mice of the indicated genotype at a minimum of 100 d post Cre-recombination. Scale, 100 μm. Three mice were evaluated for each Cre strain. e,f, FACS quantification of CZCs in P1KP (Nalcn+/+, n = 11; Nalcn+/Flx, n = 4; NalcnFlx/Flx, n = 6) (e) and V1KP (Nalcn+/+, n = 9; Nalcn+/Flx, n = 4; NalcnFlx/Flx, n = 4) (f) mice (mean ± s.e.m.) from 1-week post tamoxifen induction. Source data are given in Supplementary Table 13.
Fig. 6
Fig. 6. Nucleated CZCs in P1KP, V1KP and Pdx1KP mice are CTCs.
a, UMAP of SCS profiles of CZCs (n = 1,820) and PBMCs (n = 559). b, Gene set enrichment from 2,086 gene sets in UMAP clusters in a. c, Coimmunofluorescence of CZCs and PBMCs in P1KP (upper) and V1KP (lower) mice (ZSG; scale bar, 10 μm). Representative photomicrographs of 22 cells identified across n = 20 blood films assessed from n = 5 tumor-bearing animals. d, Autofluorescence of Pdx1KP-PAC CZC metastases in whole lung of recipient immunocompromised mouse (upper left; scale bar, 0.5 cm). Other images show H&E (representative image of 3,061 metastases evaluated) or coimmunofluorescence of metastases (representative images of 28 metastases evaluated) of P1KP-GAC or V1KP-IAC CZC metastases in recipient mice (scale bar, 50 μm). Single-channel images are shown in Supplementary Fig. 1. e, Total metastases per organ in recipient mice injected with 25,000 CZCs. P1KP Nalcn+/Flx PAC, n = 5 mice; P1KP Nalcn+/+ GAC, n = 2 mice; P1KP Nalcn+/Flx GAC, n = 3 mice; V1KP Nalcn+/Flx IAC, n = 2 mice; V1KP Nalcn+/+ + GdCl3 IAC, n = 5 mice. Source data are given in Supplementary Table 19. f, Metastasis-free survival of immunodeficient NOD scid gamma recipient mice injected with different numbers (10,000, 1,000, 100 or 10) of P1KP GAC or Pdx1KP PAC CZCs (n = 3 mice for each condition). ***P = 0.0002 Mantel–Cox statistic. Source data are available in Supplementary Table 19.
Fig. 7
Fig. 7. NALCN loss-of-function increases shedding of ntCZCs.
a, ntCZCs identified in individual nontumor-bearing P1RNalcn+/+ (n = 87), P1RNalcn+/Flx (n = 50) and P1RNalcnFlx/Flx (n = 37) mice. Bar, median. ****P < 0.0001, two-tailed Mann–Whitney U-test. Source data are available in Supplementary Table 13. b, UMAP of 201,183 SCS profiles of PBMCs, tCZCs and ntCZCs as well as cells derived from the indicated normal and malignant mouse tissues. c, Coimmunofluorescence of ntCZCs and PBMCs in peripheral blood smears of P1RNalcnFlx/Flx mice (ZSG; scale bar, 10 μm). Representative photomicrographs of 11 cells identified in n = 20 blood films from n = 4 mice. Single-channel images are shown in Supplementary Fig. 1. d–f, Direct ZSG-immunofluorescence photomicrographs of ZSG+ cells in lung and kidney (scale bar, 50 μm) (d), and enumerated in lung (no Cre, n = 2 mice, 5 lung lobes; Nalcn+/+, n = 3 mice, 9 lung lobes; Nalcn+/Flx, n = 3 mice, 8 lung lobes; NalcnFlx/Flx, n = 5 mice, 12 lung lobes; NS P = 0.1312, *P = 0.0168, two-tailed Mann–Whitney U-test) (e) and kidney (no Cre, n = 2 mice, 4 kidney sections; Nalcn+/+, n = 3 mice, 11 kidney sections; Nalcn+/Flx, n = 3 mice, 10 kidney sections; NalcnFlx/Flx, n = 5 mice, 18 kidney sections; ****P < 0.0001, two-tailed Mann–Whitney U-test) (f). g, Organ heatmap of total numbers of ZSG+ cell clusters per mouse identified in organs of recipient mice injected with P1RNalcnFlx/Flx ntCZCs. h, Coimmunofluorescence of P1RNalcnFlx/Flx ntCZCs (arrows) incorporated into the kidneys of recipient mice (arrows indicated ZSG+ cells; scale bar, 50 μm). Representative photomicrograph of n = 5 ZSG rests identified in one tissue field from n = 5 mice. Single-channel images are shown in Supplementary Fig. 1. GLO, glomerulus. i, Confocal laser scanning microscope image of P1RNalcnFlx/Flx CZCs incorporated into the renal cortex of recipient mice. Scale bar, 100 μm. Representative image of n = 2 mouse kidneys assessed. Source data
Extended Data Fig. 1
Extended Data Fig. 1. Prom1+P1KP-GAC cells propagate gastric adenocarcinoma as allografts.
(a) Growth of allografts derived from three independent P1KP gastric adenocarcinomas (GAC) in immunocompromised mice (PROM1+ n = 4 and PROM1n = 3 for each allograft). Statistics are based on Permutation test whereby permuted p-values compare PROM1+ and PROM1 allografts for each tumour type using the average t-statistic between the groups as the test statistic. Two-tailed Permutation test GAC1 p = 0.044, GAC2 p = 0.05, GAC3 p = 0.028. (b) Histology of primary P1KP-GAC and daughter PROM1+ cell allografts. Tumours expressed gastric adenocarcinoma-associated lectins and PROM1 identified by Beta-galactosidase staining from Prom1 CreERT2/LacZ locus (scale=100um). Representative photomicrographs Primary P1KP-GAC n = 3 and PROM1+ cell allografts n = 12 evaluated histologically. Source data
Extended Data Fig. 2
Extended Data Fig. 2. Recombination of the NalcnFlx conditional allele deletes the gene in vivo.
(a) Polymerase chain reaction (PCR) products derived from brains of Nalcn+/+, Nalcn+/Flx, or NalcnFlx/Flx mice with or without the NestinCre allele. (b) Real-time reverse transcriptase PCR analysis of Nalcn RNA expression in brains of Nalcn+/+ (n = 4), Nalcn+/Flx (n = 6), or NalcnFlx/Flx (n = 4) mice carrying the NestinCre allele. bar=median (*p = 0.0190 Nalcn+/Flx, *p = 0.0286 NalcnFlx/Flx; two-tailed Mann-Whitney U Test). (c) Similar to germline deletion of Nalcn, homozygous deletion of Nalcn from the brains of NestinCre;NalcnFlx/Flx (n = 6) mice was lethal at birth due to respiratory arrest, providing functional validation of Nalcn deletion. control (n = 20) and NestinCre;Nalcn+/Flx (n = 11). Source data
Extended Data Fig. 3
Extended Data Fig. 3. Nalcn deletion does not affect cell proliferation, apoptosis, immune-infiltration, vasculature or ASMA expression in primary tumours in P1KP, V1KP or Pdx1KP mice.
(a) HALO-quantification of Nalcn mRNA transcripts per cell detected by RNA-scope analysis in mouse gastric (GAC), intestinal (IAC) and pancreatic (PAC) adenocarcinomas of the indicated Nalcn genotype (bar=median; *p = 0.0294; ***p = 0.0004; ****=p < 0.0001, two-tailed Mann-Whitney test). Data are tumour fields (5–8 images per tumour) from n = 5 tumours for each Nalcn genotype of P1KP-GAC, V1KP-IAC and Pdx1KP-PAC mice (total n = 45 unique tumours, 289 unique tumour fields). (b) Representative photomicrographs of Nalcn RNA in situ hybridization in GACs (n = 15 biologically distinct tumours, 100 tumour fields) of the indicated Nalcn genotype (scale=50 μm). (c) Left in each is HALO-quantification (Data are mean ± SD) of immunohistochemically-detected tumour cell expression of MKI67 (proliferation), cleaved Caspase-3 (CC3; apoptosis), CD45 (immune cell infiltration), CD31 (endothelial cells) and alpha-smooth muscle actin ASMA; stroma) in five complete biologically independent tumour fields for each Nalcn genotype of P1KP-GAC, V1KP-IAC and Pdx1KP-PAC mice (total n = 45 unique tumours). Two-tailed Mann-Whitney U tests revealed no significant difference in these markers among tumours with different Nalcn genotypes. P-values GAC, IAC, PAC of Nalcn+/+ vs Nalcn+/Flx, Nalcn+/+ vs NalcnFlx/Flx, respectively: KI67 (0.4206, 0.4206, 0.4206, 0.5476, 0.2222, 0.5476), CC3 (0.9999, 0.5476, 0.0952, 0.5476, 0.9999, 0.2222), CD45(0.6905, 0.8413, 0.1508, 0.3095, 0.6905, 0.8413), ASMA(0.0556, 0.8413, 0.3095, 0.0556, 0.2222, 0.1508), CD31(0.9999, 0.0952, 0.0952, 0.4206, 0.8413, 0.1508). Right in each are exemplar photomicrographs of the indicated marker in the indicated tumour type (scale=50um). Source data
Extended Data Fig. 4
Extended Data Fig. 4. Metastases of P1KP-GAC, V1KP-IAC and Pdx1KP-PAC.
Photomicrographs of (a) P1KP-GAC, (b) V1KP-IAC and (c) Pdx1KP-PAC metastases to the indicated tissues. Top in each, immunohistochemistry of ZsGreen staining. Bottom in each, haematoxlin and eosin (H & E) stain (scale=100um). All enumerated metastases were evaluated by H&E (full list Supplementary Table 7; n = 7,076 metastases) n = 59 metastases evaluated by ZSG for IHC.
Extended Data Fig. 5
Extended Data Fig. 5. Human circulating tumour cells (CTCs) and peripheral blood mononuclear cells (PBMCs).
(a) UMAP of single cell RNA sequencing (SCS) profiles of human CTCs and PBMCs (see main text for SCS sources). Genesets enriched in the indicated SCS clusters are shown with adjusted p-value for enrichment in parenthesis. (b) Heatmap of indicated gene expression from relevant genesets enriched in each cell from each cluster in (a). (c) Feature plots of exemplar genes enriched in human CTCs in (a). (d) Mouse orthologues of human genes in (c) mapped onto the UMAP of mouse CZCs and PBMCs in main Fig. 3b. (e) UMAPs of SCS profiles of common orthologues expressed in human CTCs and mouse tCZCs. (f) Enrichment of haemoglobin gene expression in UMAP shown in (e). (g) Geneset enrichments in the dotted-line enclosed, central cluster relative to the other SCS profiles is reported in (e).
Extended Data Fig. 6
Extended Data Fig. 6. NALCN loss-of-function circulating non-tumour cells (ntCZCs) resemble human and mouse CTCs and embed in distant organs.
(a) Heatmap reporting geneset enrichment analysis in the UMAP clusters identified in main Fig. 7b. Test Genesets were derived from 2,086 different tissue and cell types including bulk RNAseq of mouse normal tissues and tumours, huCTC signatures, and mouse and human intestinal stem and mature cell signatures (see Methods). (b) ZSG immunohistochemistry of aged Pdx1RNalcn+/+ (top left) and Pdx1RNalcnFlx/Flx (bottom left) mouse lung bronchioles (scale=100um). Right, the number of ZSG+ cells/bronchiole in the lungs of Pdx1RNalcn+/+ (n = 2 mice, 6 lung lobes, 121 bronchiole) and Pdx1RNalcnFlx/Flx (n = 1 mouse, 4 lung lobes, 57 bronchioles). (bar=median; **p = 0.0051 two-tailed Mann-Whitney U Test). (c) Two-photon direct ZSG+ cell clusters detected in entire lung section of a Pdx1RNalcnFlx/Flx mouse. (d) Exemplar co-immunofluorescence of tail vein injected P1RNalcnFlx/Flx ntCZCs (arrows) incorporated into the organs of recipient mice (arrows indicated ZSG+ cells, scale bar=50um). Source data
Extended Data Fig. 7
Extended Data Fig. 7. Organ fibrosis following conditional deletion of Nalcn at P3 in P1R mice.
Fibrosis-free survival for all organs (a) or the indicated organs (b-i). P value reports the log-rank statistic (Mantel-Cox). The numbers of animals of each genotype are shown. p-values for each graph comparing P1RNalcn+/+ and P1RNalcn+/Flx and P1RNalcn+/+ and P1RNalcnFlx/Flx, respectively: All organs (0.0664, 0.0035), Kidneys (0.0037, 0.0022), Skin (0.1195, 0.0569), Lungs(0.3791, 0.1000), Liver(0.8846, 0.7250), Stomach(0.4938, 0.4225), Small intestine(>0.9999, 0.2348), Large intestine(0.1312, 0.2655), Pancreas(0.4764, 0.7571). (j) Photomicrographs of haematoxlin and eosin (H & E) and Picro-Sirus Red stain and co-immunofluorescence of ZsGreen, alpha-smooth muscle actin (ASMA) and Dapi in kidney from P1RNalcn+/+ and P1RNalcnFlx/Flx mice aged >400 days. Note in P1RNalcnFlx/Flx kidney: extensive fibrosis below the hashed line (H & E); marked Picro-Sirius Red staining indicating extensive fibrosis; ZsGreen recombination, gross distortion of normal kidney architecture and extensive alpha-SMA expression. (k) Photomicrographs of H & E stained skin from P1RNalcn+/+ and P1RNalcnFlx/Flx mice aged >400 days. Note in P1RNalcnFlx/Flx skin: ulceration and thickening of cornified layer, marked thickening of squamous cell layer and fibrosis of dermal layer. (scale 100um).

Comment in

References

    1. Dillekås H, Rogers MS, Straume O. Are 90% of deaths from cancer caused by metastases? Cancer Med. 2019;8:5574–5576. doi: 10.1002/cam4.2474. - DOI - PMC - PubMed
    1. Ganesh K, Massagué J. Targeting metastatic cancer. Nat. Med. 2021;27:34–44. doi: 10.1038/s41591-020-01195-4. - DOI - PMC - PubMed
    1. Massagué J, Obenauf AC. Metastatic colonization by circulating tumour cells. Nature. 2016;529:298–306. doi: 10.1038/nature17038. - DOI - PMC - PubMed
    1. House CD, et al. Voltage-gated Na+ channel SCN5A is a key regulator of a gene transcriptional network that controls colon cancer invasion. Cancer Res. 2010;70:6957–6967. doi: 10.1158/0008-5472.CAN-10-1169. - DOI - PMC - PubMed
    1. Sheth M, Esfandiari L. Bioelectric dysregulation in cancer initiation, promotion, and progression. Front. Oncol. 2022;12:846917. doi: 10.3389/fonc.2022.846917. - DOI - PMC - PubMed

Publication types