. 2022 Sep 29;22(1):253.
doi: 10.1186/s12874-022-01698-3.

Item response theory and differential test functioning analysis of the HBSC-Symptom-Checklist across 46 countries

Affiliations

Item response theory and differential test functioning analysis of the HBSC-Symptom-Checklist across 46 countries

Andreas Heinz et al. BMC Med Res Methodol. .

Abstract

Background: The Symptom Checklist (SCL) developed by the Health Behaviour in School-aged Children (HBSC) study is a non-clinical measure of psychosomatic complaints (e.g., headache and feeling low) that has been used in numerous studies. Several studies have investigated the psychometric characteristics of this scale; however, some psychometric properties remain unclear, among them especially a) dimensionality, b) adequacy of the Graded Response Model (GRM), and c) measurement invariance across countries.

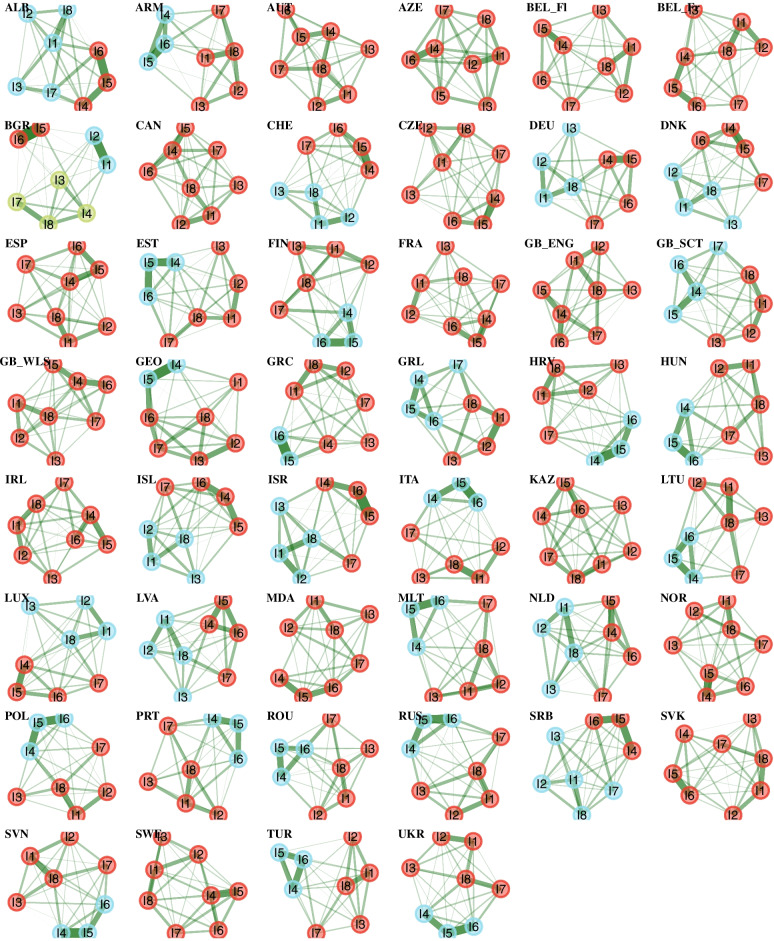
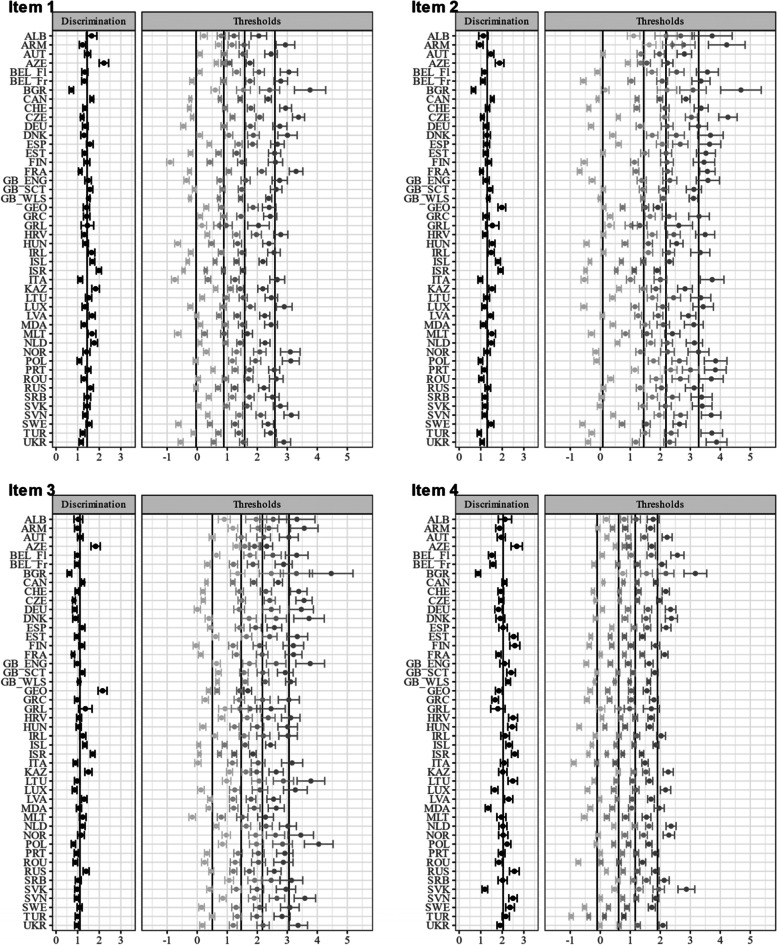
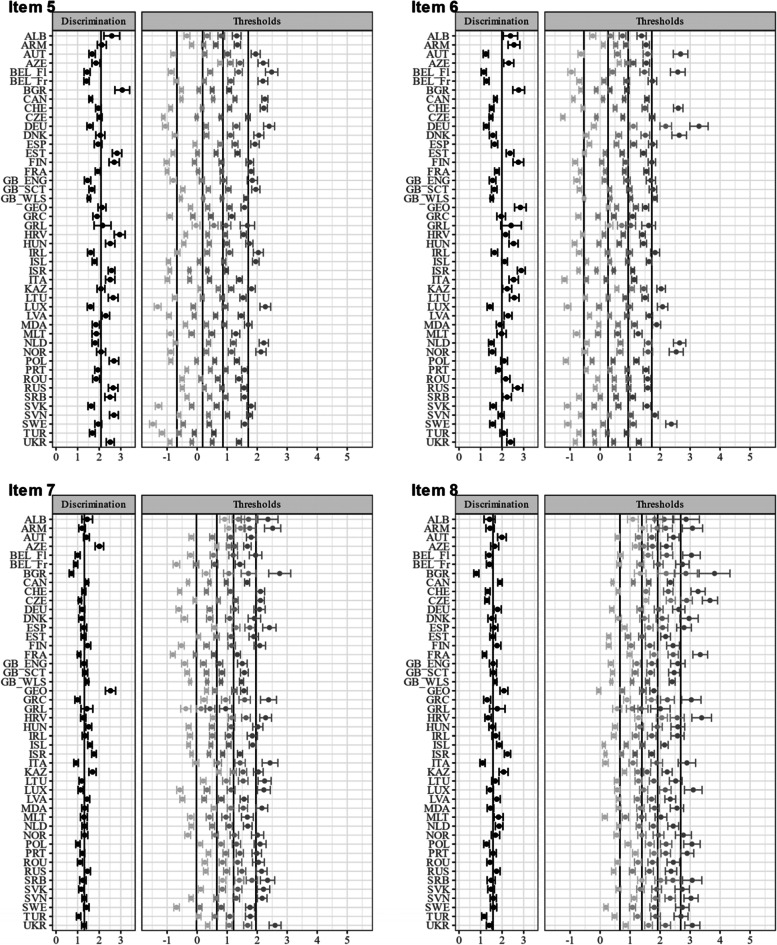
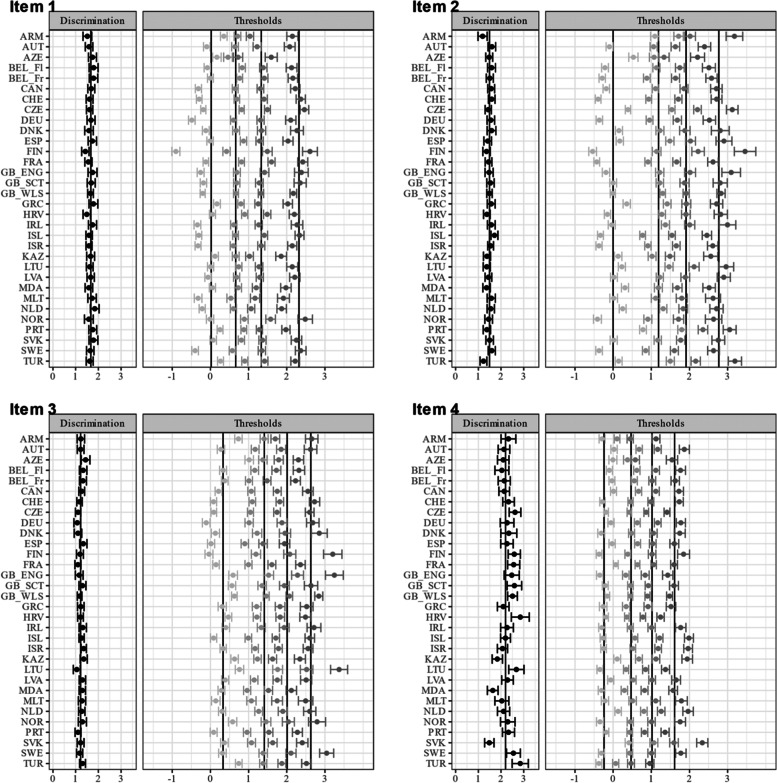
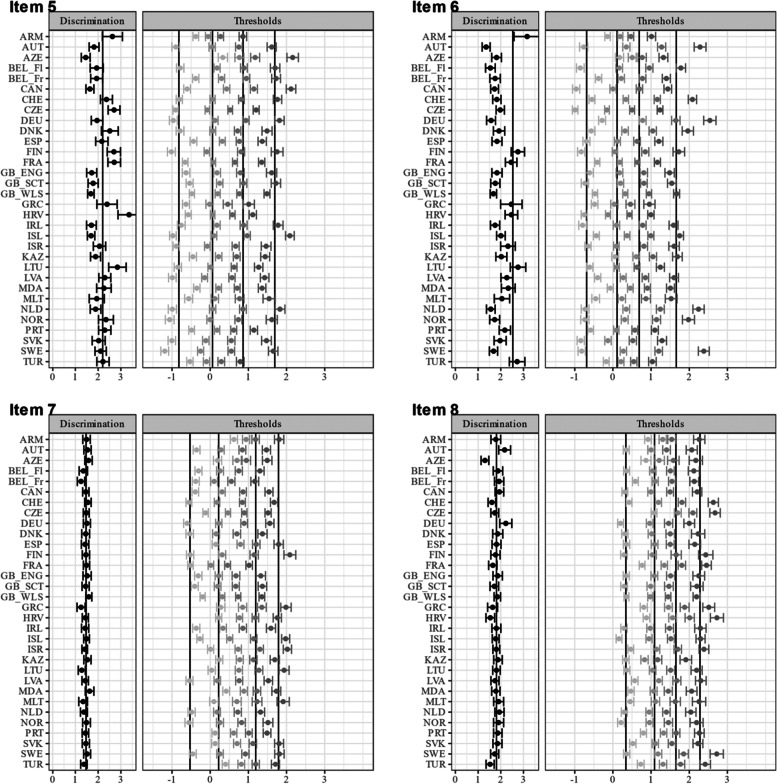
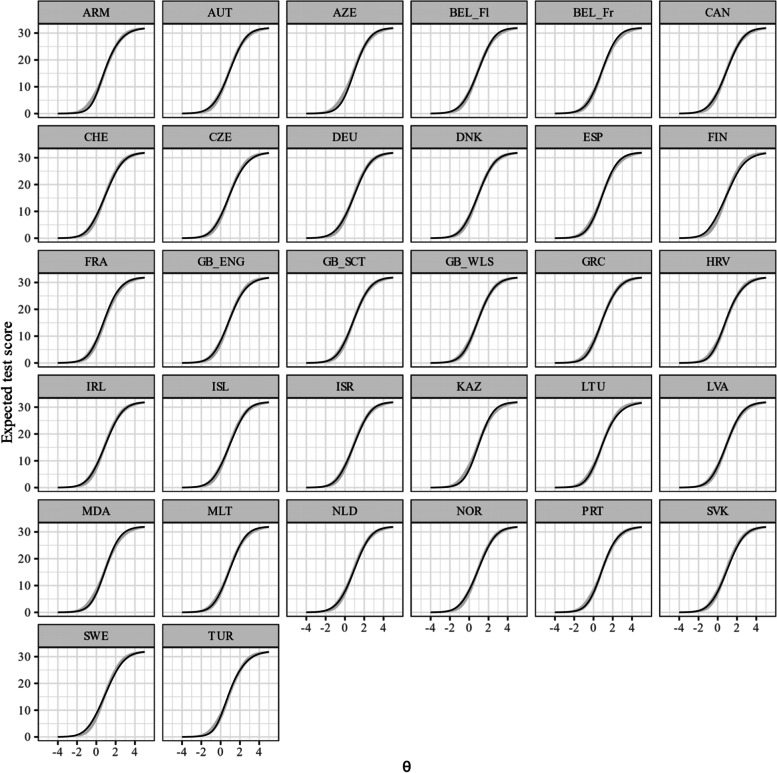
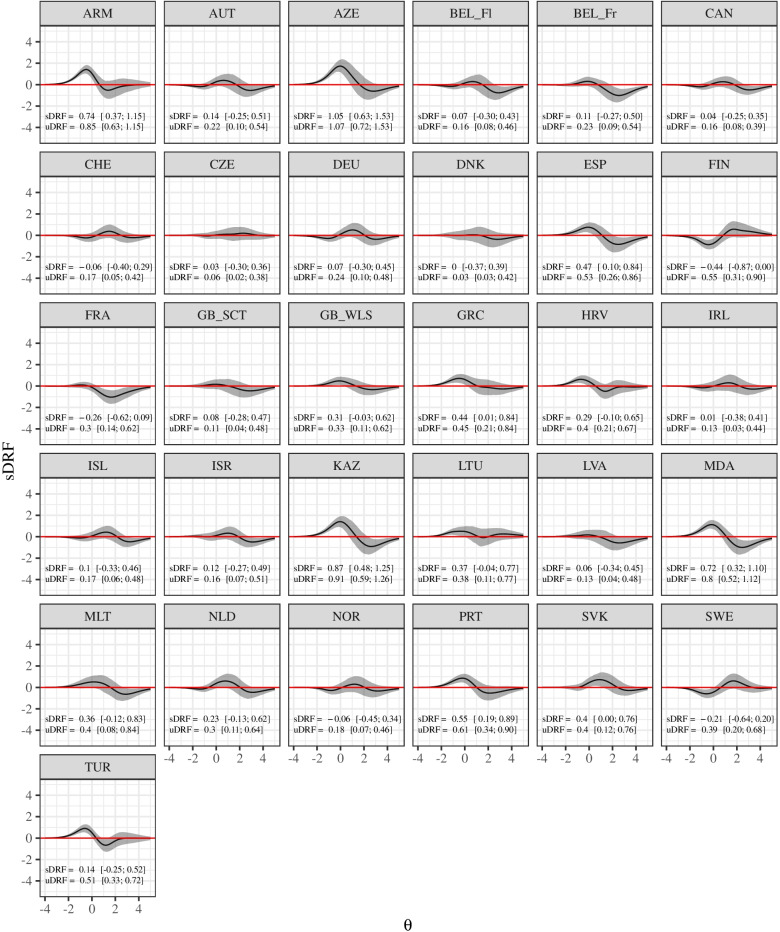
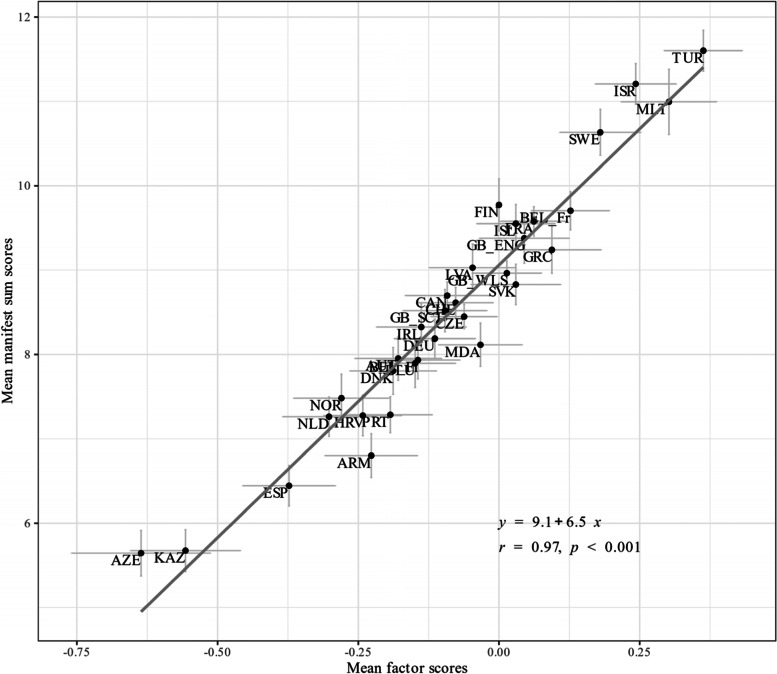
Methods: Data from 229,906 adolescents aged 11, 13 and 15 from 46 countries that participated in the 2018 HBSC survey were analyzed. Adolescents were selected using representative sampling and surveyed by questionnaire in the classroom. Dimensionality was investigated using exploratory graph analysis. In addition, we investigated whether the GRM provided an adequate description of the data. Reliability over the latent variable continuum and differential test functioning across countries were also examined.

Results: Exploratory graph analyses showed that SCL can be considered as one-dimensional in 16 countries. However, a comparison of the unidimensional with a post-hoc bifactor GRM showed that deviation from a hypothesized one-dimensional structure was negligible in most countries. Multigroup invariance analyses supported configural and metric invariance, but not scalar invariance across 32 countries. Alignment analysis showed non-invariance especially for the items irritability, feeling nervous/bad temper and feeling low.

Conclusion: HBSC-SCL appears to represent a consistent and reliable unidimensional instrument across most countries. This bodes well for population health analyses that rely on this scale as an early indicator of mental health status.

Keywords: Adolescents; Cross-national; Differential item functioning; HBSC symptom checklist; Health behaviour in school-aged children; Measurement invariance; Psychosomatic health complaints; Self-reported health complaints; Subjective health complaints.


Conflict of interest statement

The authors declare that they have no competing interests.

Figures

Fig. 1
Fig. 1
Exploratory graph analysis. Note. Each color represents a cluster of items (latent dimension). Nodes (circles) represent observed variables, and edges (lines) represent partial correlations. The magnitude of the partial correlation is represented by the thickness of the edges. Items (1) headache, (2) stomachache, (3) backache, (4) feeling low, (5) irritability/bad temper, (6) feeling nervous, (7) difficulties in getting to sleep, (8) feeling dizzy. The abbreviations of the country names can be found in Table 1
Fig. 2
Fig. 2
Item parameter for the unidimensional GRM (Items 1–4).Notes. Item discrimination and threshold parameters with 95% CI. Items (1) headache, (2) stomachache, (3) backache, (4) feeling low. Item 1: mean = 1.44, SD = 0.25, minimum = 0.71, maximum = 2.22. Item 2: mean = 1.30, SD = 0.27, minimum = 0.66, maximum = 1.98. Item 3: mean = 1.11, SD = 0.28, minimum = 0.62, maximum = 2.15. Item 4: mean = 2.04, SD = 0.38, minimum = 0.88, maximum = 2.67. The abbreviations of the country names can be found in Table 1
Fig. 3
Fig. 3
Item parameter for the unidimensional GRM (Items 5–8). Notes. Item discrimination and threshold parameters with 95% CI. Items (5) irritability/bad temper, (6) feeling nervous, (7) difficulties in getting to sleep, (8) feeling dizzy. Item 5: mean = 2.08, SD = 0.45, minimum = 1.41, maximum = 3.07. Item 6: mean = 1.99, SD = 0.49, minimum = 1.14, maximum = 2.89. Item 7: mean = 1.31, SD = 0.29, minimum = 0.71, maximum = 2.52. Item 8: mean = 1.58, SD = 0.28, minimum = 0.80, maximum = 2.25. The abbreviations of the country names can be found in Table 1
Fig. 4
Fig. 4
Item and test information functions for the unidimensional GRM. Notes. ρ represents the empirical marginal reliability. Items (1) headache, (2) stomachache, (3) backache, (4) feeling low, (5) irritability/bad temper, (6) feeling nervous, (7) difficulties in getting to sleep, (8) feeling dizzy. The abbreviations of the country names can be found in Table 1
Fig. 5
Fig. 5
Item parameter for the unidimensional GRM after alignment (Items 1–4). Notes. Item discrimination and threshold parameters with 95% CI. Vertical lines represent weighted average across all groups. Items (1) headache, (2) stomachache, (3) backache, (4) feeling low. The abbreviations of the country names can be found in Table 1
Fig. 6
Fig. 6
Item parameter for the unidimensional GRM after alignment (Items 5–8). Notes. Item discrimination and threshold parameters with 95% CI. Vertical lines represent weighted average across all groups. Items (5) irritability/bad temper, (6) feeling nervous, (7) difficulties in getting to sleep, (8) feeling dizzy. The abbreviations of the country names can be found in Table 1
Fig. 7
Fig. 7
Test characteristic curves for the GRM after alignment. The abbreviations of the country names can be found in Table 1
Fig. 8
Fig. 8
Differential test functioning for the GRM after alignment. Notes. The curves show differences in expected test scores (with 99% CI) dependent on the level of the latent variable (GB_Eng as reference group), sDRF = compensatory differential response functioning statistic with 99% CI, uDRF = non-compensatory differential response functioning statistic with 99% CI. The abbreviations of the country names can be found in Table 1
Fig. 9
Fig. 9
Scatterplot with means of factor scores and manifest sum scores. Notes. Factor scores were estimates via expected a-posterior (EAP) method. The regression equation and correlation coefficient are shown. The abbreviations of the country names can be found in Table 1

References

    1. Vaičiūnas T, Šmigelskas K. The Role of School-Related Well-Being for Adolescent Subjective Health Complaints. IJERPH. 2019 doi: 10.3390/ijerph16091577. - DOI - PMC - PubMed
    1. Lyyra N, Välimaa R, Tynjälä J. Loneliness and subjective health complaints among school-aged children. Scand J Public Health. 2018;46:87–93. doi: 10.1177/1403494817743901. - DOI - PubMed
    1. Cosma A, Stevens G, Martin G, Duinhof EL, Walsh SD, Garcia-Moya I, et al. Cross-National Time Trends in Adolescent Mental Well-Being From 2002 to 2018 and the Explanatory Role of Schoolwork Pressure. J Adolesc Health. 2020;66:S50–S58. doi: 10.1016/j.jadohealth.2020.02.010. - DOI - PMC - PubMed
    1. Norell-Clarke A, Hagquist C. Child and adolescent sleep duration recommendations in relation to psychological and somatic complaints based on data between 1985 and 2013 from 11 to 15 year-olds. J Adolesc. 2018;68:12–21. doi: 10.1016/j.adolescence.2018.07.006. - DOI - PubMed
    1. Låftman SB, Magnusson C. Do health complaints in adolescence negatively predict the chance of entering tertiary education in young adulthood? Scand J Public Health. 2017;45:878–885. doi: 10.1177/1403494817713649. - DOI - PubMed

Publication types