Projection of age of individuals living with HIV and time since ART initiation in 2030: estimates for France
- PMID: 36176023
- PMCID: PMC9523002
- DOI: 10.1002/jia2.25986
Projection of age of individuals living with HIV and time since ART initiation in 2030: estimates for France
Abstract
Introduction: Thanks to antiretroviral treatment (ART), people living with HIV (PLHIV) are living longer and ageing. However, ageing involves increased risks of co-morbidities, which also depend on when PLHIV individuals started ART. To tackle the HIV age-related upcoming challenges, knowledge of the current and future age structure of the HIV population is needed. Here, we forecast the demographic profile of the adult population living with diagnosed HIV (aPLdHIV) in France until 2030, accounting for the impact of the ART initiation period on mortality.
Methods: We used national data from the French Hospital Database on HIV (ANRS CO4-FHDH) and a sample of the National Health Data System to, first, characterize the aPLdHIV in 2018 and estimate their mortality rates according to age, sex and ART initiation period. Second, we used national HIV surveillance data to define three scenarios for the numbers of newly diagnosed HIV cases over 2019-2030: 30% decrease in HIV cases (S1), status quo situation (S2) and epidemic elimination (S3). We then combined these data using a matrix model, to project the age structure of aPLdHIV and time since ART initiation.
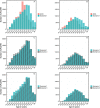
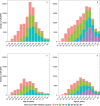
Results: In 2018, there was an estimated 161,125 aPLdHIV (33% women), of which 55% were aged 50 or older (50+), 22% aged 60+ and 8% aged 70+. In 2030, the aPLdHIV would grow to 195,246 for S1, 207,972 for S2 and 167,221 for S3. Whatever the scenario, in 2030, the estimated median time since ART initiation would increase and age distribution would shift towards older ages: with 65-72% aPLdHIV aged 50+, 42-48% 60+ and 17-19% 70+. This corresponds to ∼83,400 aPLdHIV (28% women) aged 60+, among which ∼69% started ART more than 20 years ago (i.e. before 2010) and ∼39% ≥30 years ago (i.e. before 2000), and to ∼33,100 aPLdHIV (27% women) aged 70+, among which ∼72% started ART ≥20 years ago and ∼43% ≥30 years ago.
Conclusions: By 2030, in France, close to 20% of the aPLdHIV will be aged 70+, of which >40% would have started ART more than 30 years ago. These estimates are essential to adapt co-morbidities screening and anticipate resource provision in the aged care sector.
Keywords: HIV epidemiology; ageing; demographic profile; life expectancy; modelling; time since treatment initiation.
© 2022 The Authors. Journal of the International AIDS Society published by John Wiley & Sons Ltd on behalf of the International AIDS Society.
Conflict of interest statement
VS reports lecture fees from ViiV (2019), Gilead (2019, 2020) and Janssen‐Cilag (2020), outside the submitted work.
DC reports an HIV grant from Janssen (2019–2020) and personal fees from Gilead (2020) and Pfizer (2022) for lectures, outside the submitted work.
LM, AR, SG and YD declare no competing interests.
Figures


References
-
- Mocroft A, Vella S, Benfield T, Chiesi A, Miller V, Gargalianos P, et al. Changing patterns of mortality across Europe in patients infected with HIV‐1. Lancet North Am Ed. 1998;352(9142):1725–30. - PubMed
-
- Joint United Nations Programme on HIV/AIDS . HIV and aging. [Internet]. 2013 [cited 2021 Oct 2]. Available from: http://www.unaids.org/en/media/unaids/contentassets/documents/unaidspubl...
Publication types
MeSH terms
Substances
LinkOut - more resources
Full Text Sources
Medical
Miscellaneous

