

Identification and verification of hub genes associated with the progression of non-small cell lung cancer by integrated analysis
- PMID: 36176446
- PMCID: PMC9513139
- DOI: 10.3389/fphar.2022.997842
Identification and verification of hub genes associated with the progression of non-small cell lung cancer by integrated analysis
Abstract
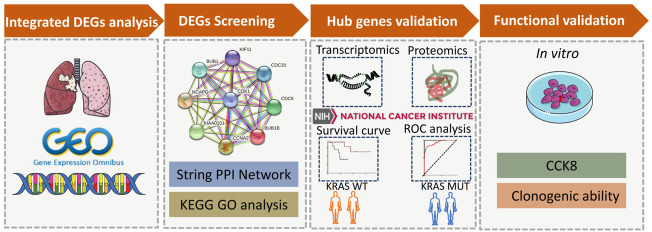
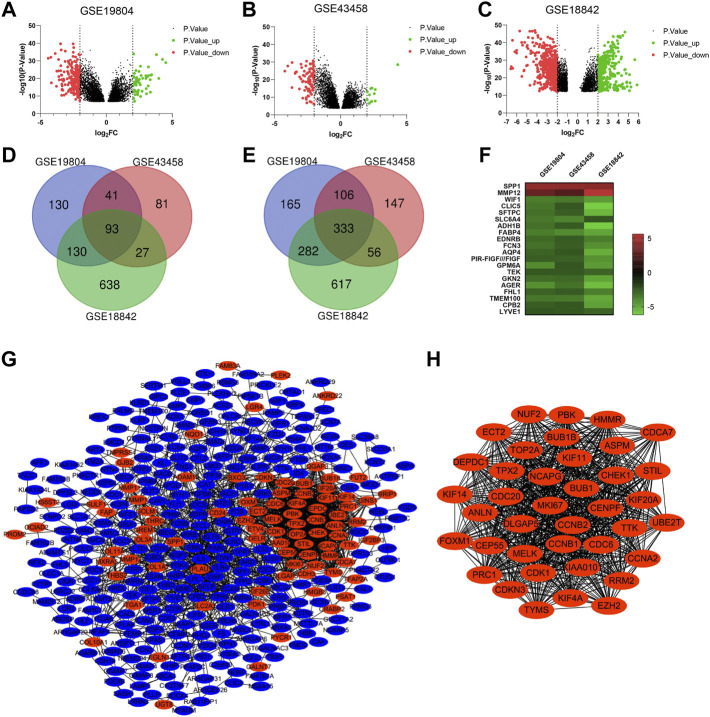
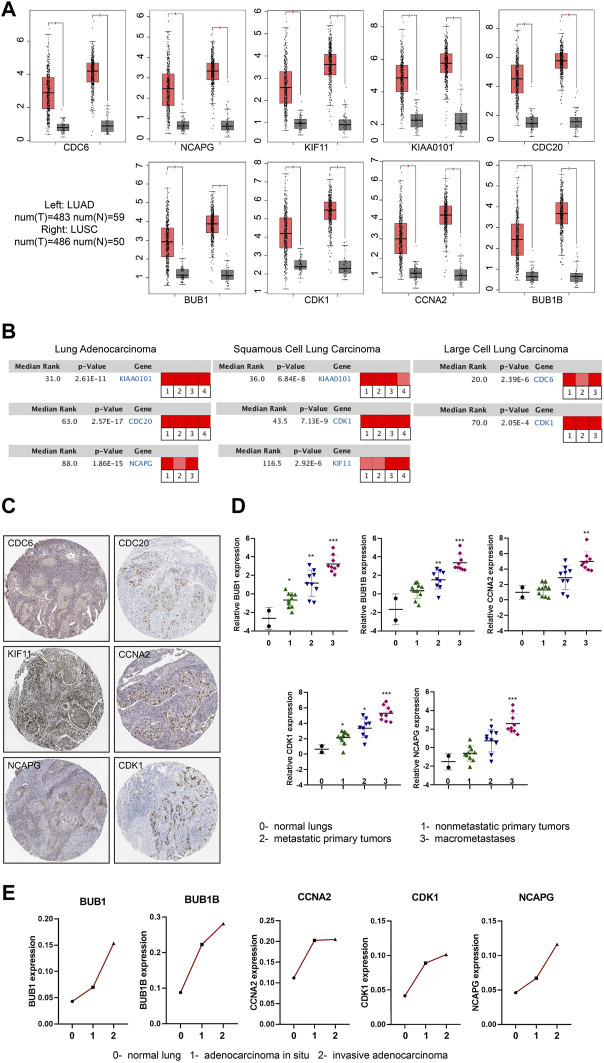
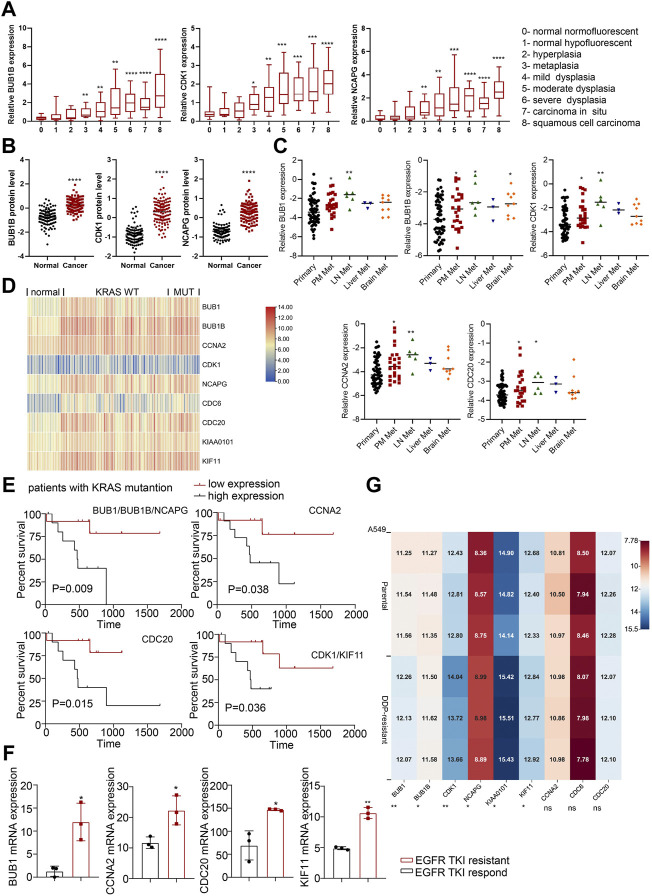
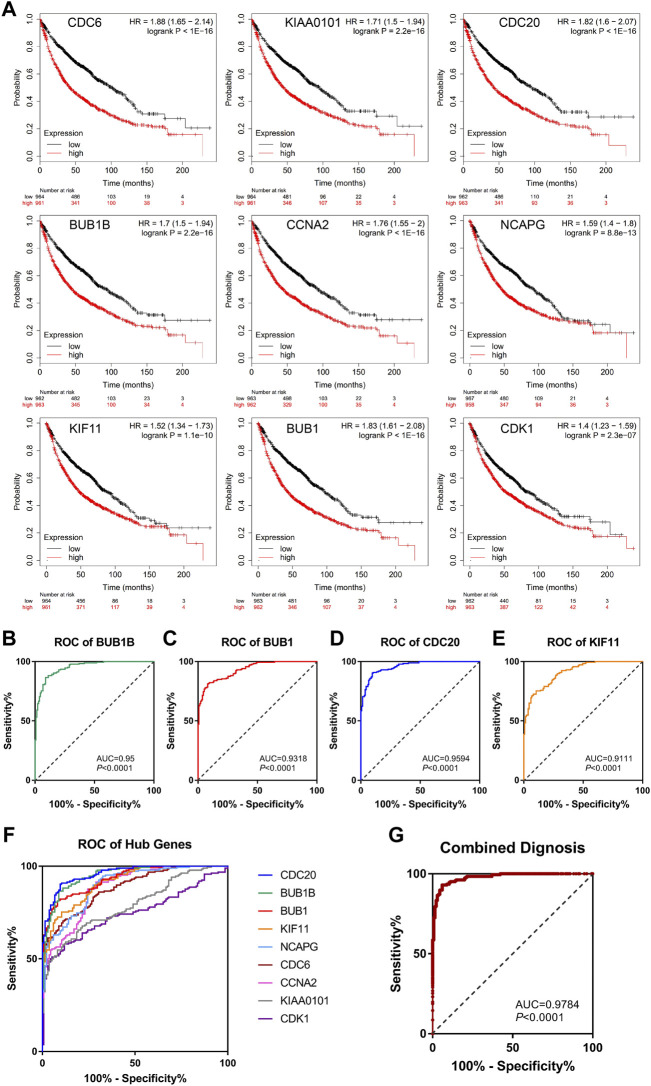
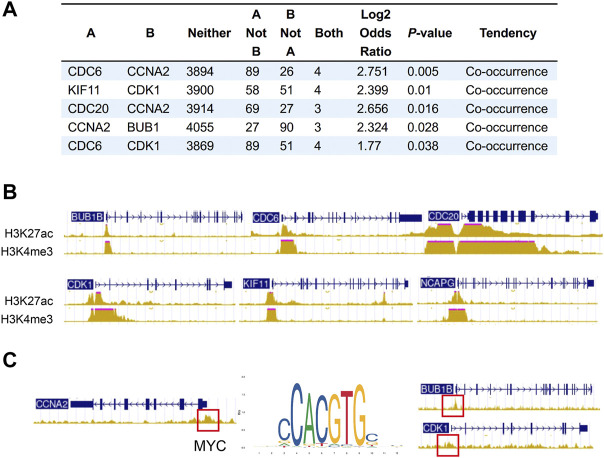
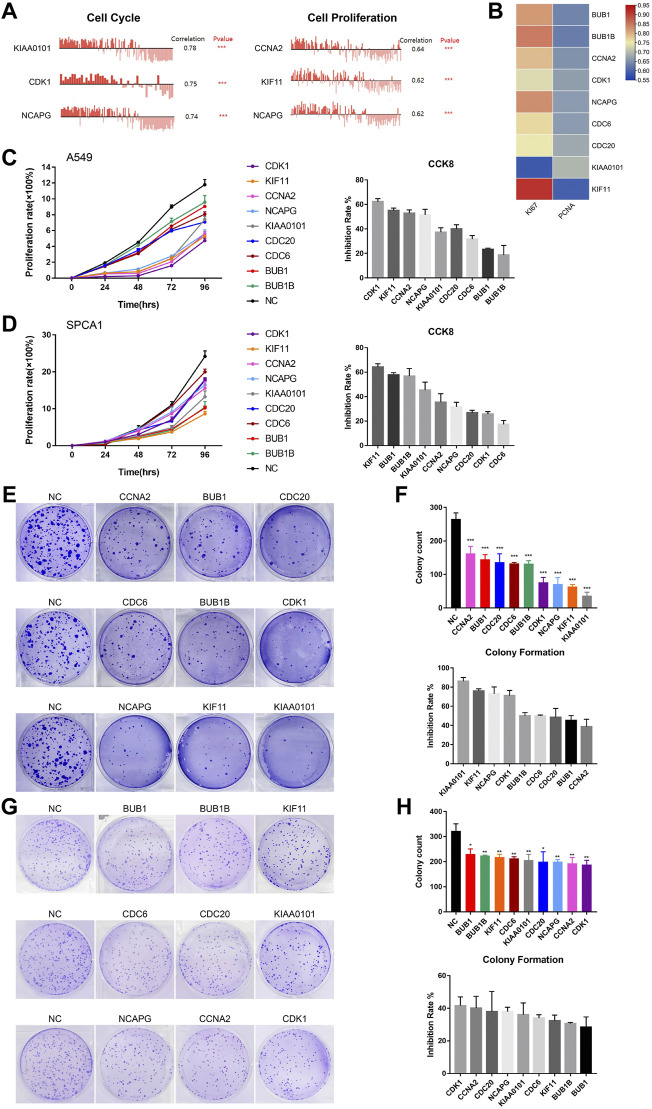
Objectives: Lung cancer is one of the most common cancers worldwide and it is the leading cause of cancer-related mortality. Despite the treatment of patients with non-small cell lung carcinoma (NSCLC) have improved, the molecular mechanisms of NSCLC are still to be further explored. Materials and Methods: Microarray datasets from the Gene Expression Omnibus (GEO) database were selected to identify the candidate genes associated with tumorigenesis and progression of non-small cell lung carcinoma. The differentially expressed genes (DEGs) were identified by GEO2R. Protein-protein interaction network (PPI) were used to screen out hub genes. The expression levels of hub genes were verified by GEPIA, Oncomine and The Human Protein Atlas (HPA) databases. Survival analysis and receiver operating characteristic (ROC) curve analysis were performed to value the importance of hub genes in NSCLC diagnosis and prognosis. ENCODE and cBioPortal were used to explore the upstream regulatory mechanisms of hub genes. Analysis on CancerSEA Tool, CCK8 assay and colony formation assay revealed the functions of hub genes in NSCLC. Results: A total of 426 DEGs were identified, including 93 up-regulated genes and 333 down-regulated genes. And nine hub genes (CDC6, KIAA0101, CDC20, BUB1B, CCNA2, NCAPG, KIF11, BUB1 and CDK1) were found to increase with the tumorigenesis, progression and cisplatin resistance of NSCLC, especially EGFR- or KRAS-mutation driven NSCLC. Hub genes were valuable biomarkers for NSCLC, and the overexpression of hub genes led to poor survival of NSCLC patients. Function analysis showed that hub genes played roles in cell cycle and proliferation, and knockdown of hub genes significantly inhibited A549 and SPCA1 cell growth. Further exploration demonstrated that copy number alterations (CNAs) and transcription activation may account for the up-regulation of hub genes. Conclusion: Hub genes identified in this study provided better understanding of molecular mechanisms within tumorigenesis and progression of NSCLC, and provided potential targets for NSCLC treatment as well.
Keywords: NSCLC; bioinformatics; biomarker; hub genes; integrated analysis.
Copyright © 2022 Mengyan, Kun, Xinming, Yutian and Yongqian.
Conflict of interest statement
The authors declare that the research was conducted in the absence of any commercial or financial relationships that could be construed as a potential conflict of interest.
Figures
Similar articles
-
Identification of key molecular markers in epithelial ovarian cancer by integrated bioinformatics analysis.Taiwan J Obstet Gynecol. 2021 Nov;60(6):983-994. doi: 10.1016/j.tjog.2021.09.007. Taiwan J Obstet Gynecol. 2021. PMID: 34794761
-
GOLM1 predicts poor prognosis of patients with NSCLC and is associated with the proliferation and chemo-sensitivity of cisplatin in NSCLC cells: bioinformatics analysis and laboratory validation.J Bioenerg Biomembr. 2021 Apr;53(2):177-189. doi: 10.1007/s10863-021-09875-7. Epub 2021 Feb 4. J Bioenerg Biomembr. 2021. PMID: 33538941
-
Identification and validation of key genes with prognostic value in non-small-cell lung cancer via integrated bioinformatics analysis.Thorac Cancer. 2020 Apr;11(4):851-866. doi: 10.1111/1759-7714.13298. Epub 2020 Feb 14. Thorac Cancer. 2020. PMID: 32059076 Free PMC article.
-
Integrative Bioinformatics Analysis for Targeting Hub Genes in Hepatocellular Carcinoma Treatment.Curr Genomics. 2025;26(1):48-80. doi: 10.2174/0113892029308243240709073945. Epub 2024 Jul 18. Curr Genomics. 2025. PMID: 39911278 Free PMC article.
-
Screening of hub genes associated with prognosis in non-small cell lung cancer by integrated bioinformatics analysis.Transl Cancer Res. 2020 Nov;9(11):7149-7164. doi: 10.21037/tcr-20-1073. Transl Cancer Res. 2020. PMID: 35117319 Free PMC article.
Cited by
-
POU4F1 enhances lung cancer gemcitabine resistance by regulating METTL3-dependent TWF1 mRNA N6 adenosine methylation.3 Biotech. 2025 Jan;15(1):7. doi: 10.1007/s13205-024-04161-w. Epub 2024 Dec 12. 3 Biotech. 2025. PMID: 39676891
-
Identifying lncRNAs and mRNAs related to survival of NSCLC based on bioinformatic analysis and machine learning.Aging (Albany NY). 2024 May 1;16(9):7799-7817. doi: 10.18632/aging.205783. Epub 2024 May 1. Aging (Albany NY). 2024. PMID: 38696317 Free PMC article.
-
Cytotoxic Effect of Escitalopram/Etoposide Combination on Etoposide-Resistant Lung Cancer.Pharmaceuticals (Basel). 2025 Apr 5;18(4):531. doi: 10.3390/ph18040531. Pharmaceuticals (Basel). 2025. PMID: 40283966 Free PMC article.
-
Eg5 and Diseases: From the Well-Known Role in Cancer to the Less-Known Activity in Noncancerous Pathological Conditions.Biochem Res Int. 2024 Jun 20;2024:3649912. doi: 10.1155/2024/3649912. eCollection 2024. Biochem Res Int. 2024. PMID: 38939361 Free PMC article. Review.
-
Targeting Kinesins for Therapeutic Exploitation of Chromosomal Instability in Lung Cancer.Cancers (Basel). 2025 Feb 18;17(4):685. doi: 10.3390/cancers17040685. Cancers (Basel). 2025. PMID: 40002279 Free PMC article. Review.
References
LinkOut - more resources
Full Text Sources
Research Materials
Miscellaneous