. 2022 Aug 23;2(1):ltac017.
doi: 10.1093/immadv/ltac017. eCollection 2022.

De-risking clinical trial failure through mechanistic simulation

Affiliations

De-risking clinical trial failure through mechanistic simulation

Liam V Brown et al. Immunother Adv. .

Abstract

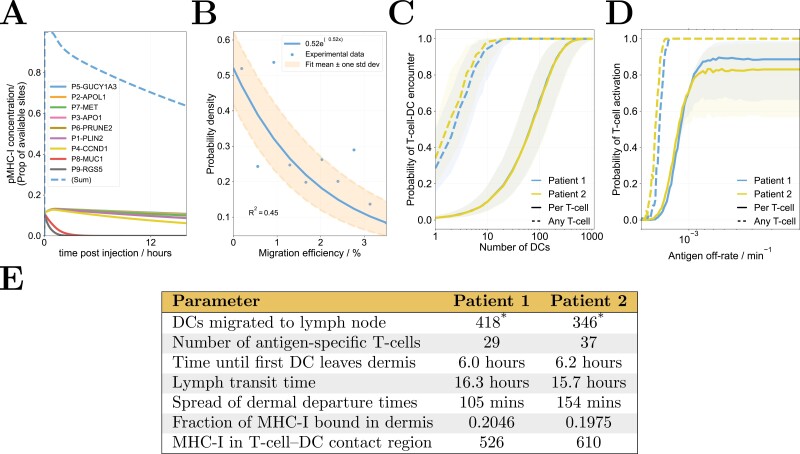
Drug development typically comprises a combination of pre-clinical experimentation, clinical trials, and statistical data-driven analyses. Therapeutic failure in late-stage clinical development costs the pharmaceutical industry billions of USD per year. Clinical trial simulation represents a key derisking strategy and combining them with mechanistic models allows one to test hypotheses for mechanisms of failure and to improve trial designs. This is illustrated with a T-cell activation model, used to simulate the clinical trials of IMA901, a short-peptide cancer vaccine. Simulation results were consistent with observed outcomes and predicted that responses are limited by peptide off-rates, peptide competition for dendritic cell (DC) binding, and DC migration times. These insights were used to hypothesise alternate trial designs predicted to improve efficacy outcomes. This framework illustrates how mechanistic models can complement clinical, experimental, and data-driven studies to understand, test, and improve trial designs, and how results may differ between humans and mice.

Keywords: late-phase trial; mathematical modelling; oncology; peptide; vaccines.


Figures

Graphical Abstract
Graphical Abstract
Figure 1.
Figure 1.
A summary of the model and methods used to conduct in-silico clinical trials, modified from [16]. (A) Model schematic, split into three sections. The injection site is modelled by a set of equations that represent peptide competition, binding to dendritic cell MHC-I and clearance from the vasculature. Unbinding of this initial amount of peptide from MHC-I is modelled in all sections of the model. Dendritic cell migration is modelled by a simple exponential distribution fitted to experimental measurements of their migration efficiency. T-cell–dendritic cell interactions in the lymph node are modelled by an agent-based model, see Methods: Computational model of vaccination. (B) Schematic of a simulated clinical trial. A patient cohort is produced with random values of patient-specific parameters. For each patient, the lymph node model is simulated with each peptide and the expected number of peptide responses is calculated. Three distinct simulated trials are performed to indicate the variability of results, and the numbers of patients responding to zero, one, two, or three peptides are compared to IMA901’s results. (C) Schematic of the data-fitting procedure using Approximate Bayesian Computation; see text in Results: Simulated clinical trial results for IMA901 phases I–I. (D) Quantitative details of each phase of IMA901: the number of patients enrolled, the number of peptides administered to each patient and the days on which peptides were administered (4 mg of each on each visit).
Figure 2,
Figure 2,
(A) Example results of the injection site model, showing peptide binding, the clearance of remaining free peptide from the vasculature and gradual unbinding of remaining peptides according to their off-rates. (B). Experimental measurements of dendritic cell migration efficiency with a simple exponential fit. The number of dendritic cells that successfully reach the lymph node in each virtual patient is drawn from this distribution. (C,D). Example results of the lymph node model for two virtual patients: the probability of simulated T-cell activation as a function of (C) the number of cognate-antigen carrying dendritic cells, when every interaction leads to activation or (D) pMHC-I off-rate. Solid lines indicate the probability for each (cognate) T-cell and dotted lines the probability of at least one (cognate) T-cell interacting. The shaded regions indicate probabilities between 6 and 24 hours, whilst the central lines indicate the probability after 12 hours. (E). Parameter values corresponding to the two virtual patients in panels C and D. *Note that in panel C, interaction probability is plotted against the number of migrating dendritic cells, so the fixed value in the table is not used. Also in panel C, the off-rate of peptide from MHC-I is fixed to 0.
Figure 3.
Figure 3.
Results of fitting a simulated clinical trial to phases I–III of IMA901. (A) Parameters values for each patient in each phase are drawn from the Gaussian distributions indicated, the means and variances of which were fitted to data. The dendritic cell distribution is an exponential fit to literature data [17]. (B) The number of patients who responded to 0, 1, 2, or 3 peptides in the real and simulated trials of phase I. Error bars for the simulated trial are the standard deviation over three repeats. (C) The probability of a simulated patient responding to each peptide plotted against the total number of responses that the same virtual patient made in phase I. For example, a virtual patient expected to respond to 2.0 peptides has around a 90% chance of responding to GUC-001 and an 80% chance of responding to ADF-002. (D, E) Results of the simulated clinical trials that match phase II (D) and phase III (E). Note that the parameter distributions are different to each other and to phase I, and (*) that the number of patients responding to two or three peptides are combined in the data for IMA901-301 (phase III). The dashed bar is the prediction of the number of patients who respond to 3 peptides in the simulated trial.
Figure 4.
Figure 4.
A comparison of the half-lives for each peptide, according to two algorithms ([19, 20]) and measurements by two techniques. The darker the cell shading, the higher the value in that column. ‘Fluorescence’ and ‘BFA’ refer to assays used to measure half-lives, as detailed in Results: Measurement of IMA901 peptide off-rates. Note that the rank order of each peptide differs for each technique, and that the average half-life measured by experiment differs greatly from the predicted values.
Figure 5.
Figure 5.
Tests of potential alterations to the intervention design to improve patient responses. Grey bars indicate the observed results of the phase II trial of IMA901. Simulated trial results match these results (as in Fig. 3D) with the parameters specified in Fig. 3A. The yellow bars in each panel indicate how results change with each of the following alterations: (A) the 3 peptides with the fastest measured off-rates are removed, (B) the 4 peptides with the fastest measured off-rates are removed, (C) lymph transit time is reduced from 30 to 10 hours (while also noting that transit times of alternative liposomal vaccine formulations from muscle to lymph are dramatically reduced), and (D) the changes in both B and C.

References

    1. Trends, Charts, and Maps - ClinicalTrials.gov , Mar 2022. https://clinicaltrials.gov/ct2/resources/trends (8 March 2022, date last accessed).
    1. Fogel DB. Factors associated with clinical trials that fail and opportunities for improving the likelihood of success: a review. Contemp Clin Trials Commun 2018; 11:156. 10.1016/j.conctc.2018.08.001 - DOI - PMC - PubMed
    1. Mullard A. How much do phase III trials cost? - nature reviews drug discovery. Nature 2018; 17:777. 10.1038/nrd.2018.198 - DOI - PubMed
    1. Claret L, Girard P, Hoff PMet al. . Model-based prediction of phase III overall survival in colorectal cancer on the basis of phase II tumor dynamics. J Clin Oncol 2009; 27(25):4103–8. 10.1200/JCO.2008.21.0807 - DOI - PubMed
    1. Claret L, Jin JY, Ferte Cet al. . A model of overall survival predicts treatment outcomes with atezolizumab versus chemotherapy in non–small cell lung cancer based on early tumor kinetics. Clin Cancer Res 2018; 24(14): 3292–8. 10.1158/1078-0432.CCR-17-3662 - DOI - PubMed

LinkOut - more resources