. 2022 Aug 22;7(3):e10394.
doi: 10.1002/btm2.10394. eCollection 2022 Sep.

Extracellular matrix stiffness controls cardiac valve myofibroblast activation through epigenetic remodeling

Affiliations

Extracellular matrix stiffness controls cardiac valve myofibroblast activation through epigenetic remodeling

Cierra J Walker et al. Bioeng Transl Med. .

Abstract

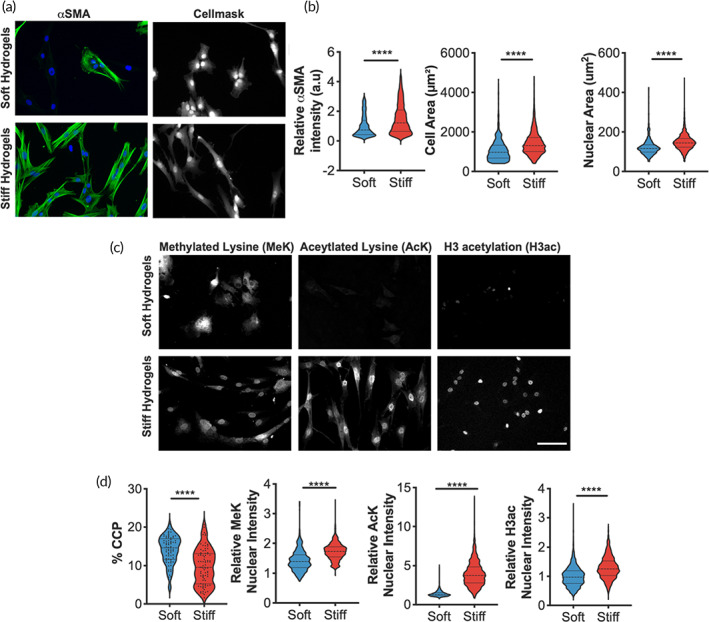
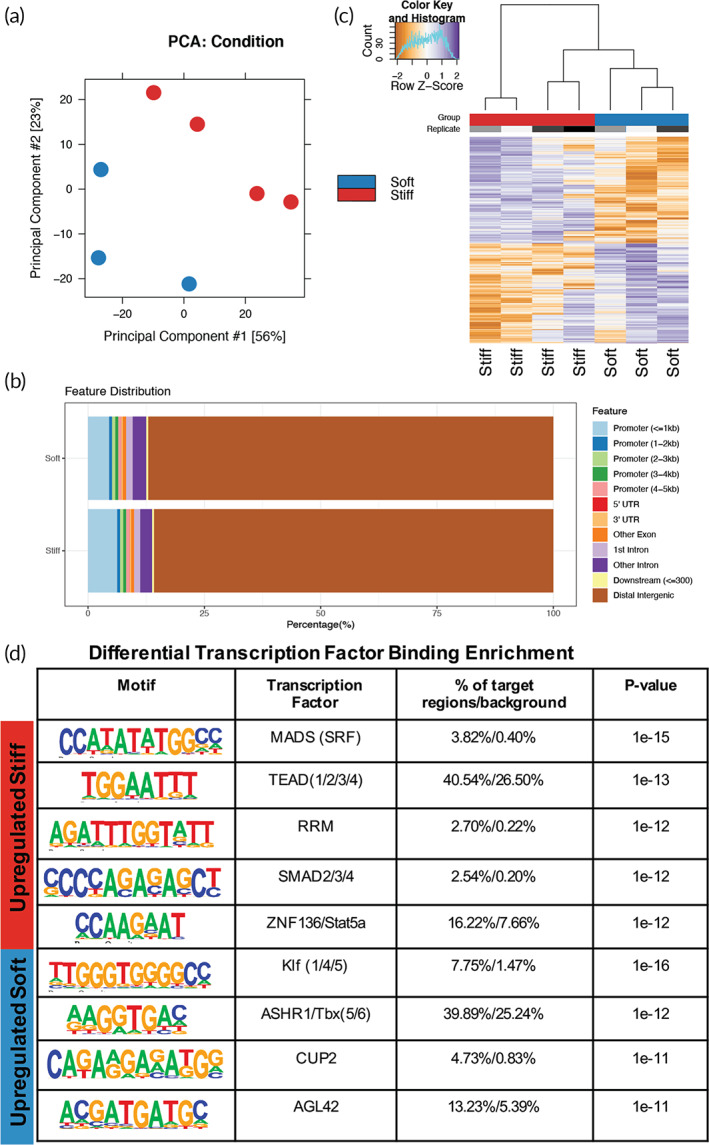
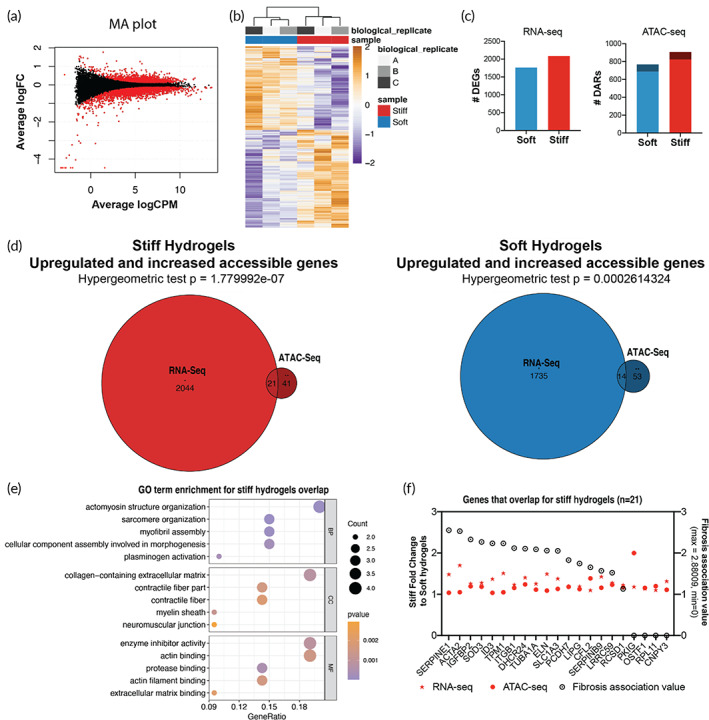
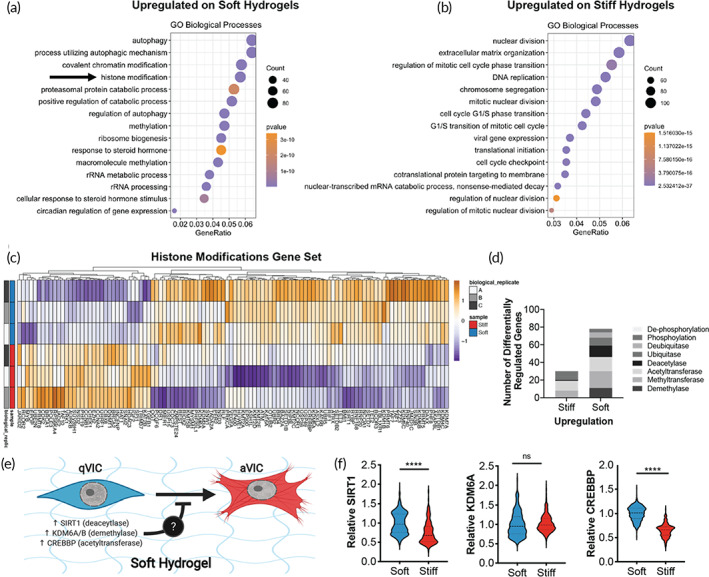
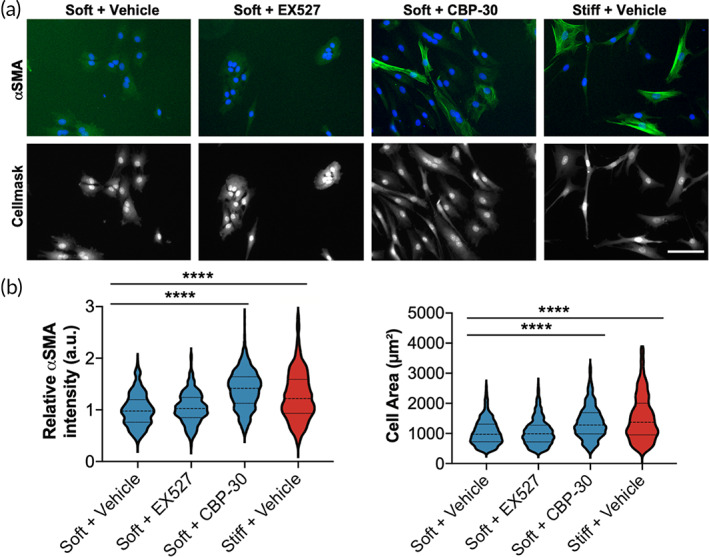
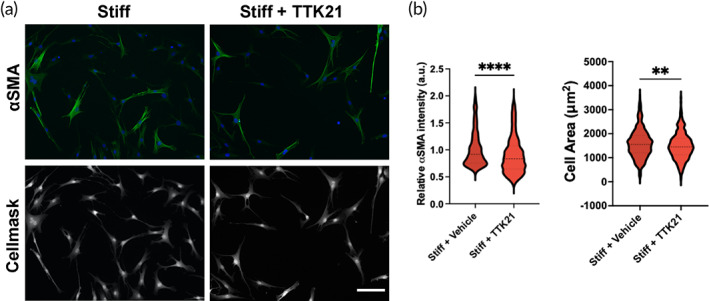
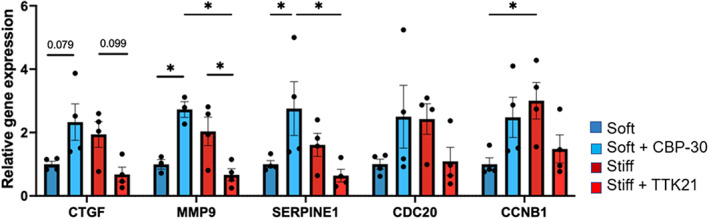
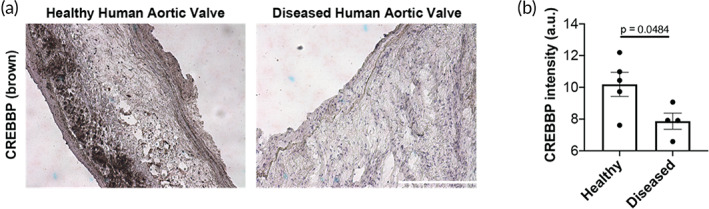
Aortic valve stenosis (AVS) is a progressive fibrotic disease that is caused by thickening and stiffening of valve leaflets. At the cellular level, quiescent valve interstitial cells (qVICs) activate to myofibroblasts (aVICs) that persist within the valve tissue. Given the persistence of myofibroblasts in AVS, epigenetic mechanisms have been implicated. Here, we studied changes that occur in VICs during myofibroblast activation by using a hydrogel matrix to recapitulate different stiffnesses in the valve leaflet during fibrosis. We first compared the chromatin landscape of qVICs cultured on soft hydrogels and aVICs cultured on stiff hydrogels, representing the native and diseased phenotypes respectively. Using assay for transposase-accessible chromatin sequencing (ATAC-Seq), we found that open chromatin regions in aVICs were enriched for transcription factor binding motifs associated with mechanosensing pathways compared to qVICs. Next, we used RNA-Seq to show that the open chromatin regions in aVICs correlated with pro-fibrotic gene expression, as aVICs expressed higher levels of contractile fiber genes, including myofibroblast markers such as alpha smooth muscle actin (αSMA), compared to qVICs. In contrast, chromatin remodeling genes were downregulated in aVICs compared to qVICs, indicating qVICs may be protected from myofibroblast activation through epigenetic mechanisms. Small molecule inhibition of one of these remodelers, CREB Binding Protein (CREBBP), prevented qVICs from activating to aVICs. Notably, CREBBP is more abundant in valves from healthy patients compared to fibrotic valves. Our findings reveal the role of mechanical regulation in chromatin remodeling during VIC activation and quiescence and highlight one potential therapeutic target for treating AVS.

Keywords: ATAC‐Seq; RNA‐Seq; epigenetics; hydrogels; myofibroblasts; valve interstitial cells.


Conflict of interest statement

The authors declare no conflicts of interests.

Figures

FIGURE 1
FIGURE 1
Histone modifications and chromatin condensation are altered when valve interstitial cells (VICs) are cultured on stiff or soft hydrogels. (a) Representative images of male VICs cultured on stiff or soft hydrogels when immunostained for αSMA (green) and DAPI (blue), Cellmask, scale bar = 100 um. (b) Quantification of myofibroblast‐like phenotypes using αSMA relative fluorescence intensity, cell area, and nuclear area for VICs on soft or stiff hydrogels. n > 592 cells. (c) Representative images of male VICs cultured on stiff or soft hydrogels when immunostained for methylated lysine (MeK), aceytlated lysine (AcK), and histone H3 acetylation (H3ac). Scale bar = 100 μm. (d) Quantification of chromatin condensation parameter (% CCP) for VICs cultured on stiff or soft hydrogels. n > 73 cells. Quantification of histone modifications (MeK, AcK, H3ac) for VICs cultured on stiff or soft hydrogels. n > 679 cells. All analyses were performed across >3 hydrogels. Wilcoxon signed rank test applied. **** p ≤ 0.001
FIGURE 2
FIGURE 2
Chromatin accessibility differences in valve interstitial cells (VICs) cultured on stiff or soft hydrogels identified with ATAC‐sequencing. (a) Principal component analysis (PCA) of the ATAC‐seq data sets. (b) Annotation of the location of ATAC peaks in stiff or soft samples to the UCSC susScr11 reference genes. (c) Heatmap and clustering of ATAC‐seq differentially accessible peaks. (d) Motif enrichment analysis of differentially accessible peaks in stiff or soft samples using Homer de novo motifs with Homer's motif library
FIGURE 3
FIGURE 3
Integration of ATAC‐seq and RNA‐seq in quiescent valve interstitial cells (qVICs) and activate to myofibroblasts (aVICs). (a) MA plot of differentially expressed genes found between valve interstitial cells (VICs) cultured on stiff and soft hydrogels where red dots indicate genes found to be significantly different (false discovery rate [FDR] < 0.05). (b) Heatmap and clustering of RNA‐seq differentially expressed genes. (c) Number of differentially expressed genes (DEGs) found using RNA‐seq and the number of differentially accessible regions found using ATAC‐seg. Darker colors in ATAC‐Seq graph indicate differentially accessible regions (DARs) that annotate to genes and lighter colors indicate DARs that annotate to distal intergenic regions according to ChIPseeker. (d) Overlap between genes that are upregulated and more accessible in VICs cultured on stiff or soft hydrogels. (e) Gene ontology (GO) term analysis of the gene‐set in the overlap between RNA‐seq and ATAC‐seq datasets from stiff hydrogel samples. p < 0.10. (f) Fold change of genes upregulated and more accessible from RNA‐Seq and ATAC‐Seq on stiff hydrogels relative to soft hydrogels in descending order of fibrosis association value
FIGURE 4
FIGURE 4
Soft hydrogels upregulate genes related to chromatin remodeling. (a,b) Gene ontology (GO) biological processes term enrichment of genes upregulated in valve interstitial cells (VICs) on soft (a) or stiff (b) hydrogels. (c) Heatmap of differentially expressed genes within the GO term category of histone modifications. (d) Number of differentially regulated genes related to chromatin remodeling in VICs cultured on stiff or soft hydrogels. (e) Illustration of hypothesis that upregulation of chromatin remodelers (e.g., SIRT1, KDM6A/B, or CREBBP) in VICs on soft hydrogels protects against unwanted myofibroblast activation. Created using Biorender.com. (f) Quantification of protein levels of SIRT1, KDM6A, and CREBBP in VICs cultured on soft or stiff hydrogels. n > 403 cells from three hydrogels. Unpaired two‐way student's t‐test applied. **** p ≤ 0.001, p ≤ 0.005
FIGURE 5
FIGURE 5
CREB binding protein (CREBBP) inhibition increases myofibroblast activation of soft hydrogels. (a) Representative images of valve interstitial cells (VICs) treated with vehicle, 50 μM EX527 (SIRT1 inhibitor), or 10 μM CBP‐30 (CREBBP inhibitor). αSMA = green, DAPI = blue. Cellmask = gray. Scale bar = 100 μm. (b) Quantification of relative cellular αSMA intensity and cell area with drug treatments. n > 357 cells from >4 hydrogels. One‐way analysis of variance (ANOVA) with Bonferroni's multiple comparison test applied. ****p < 0.0001
FIGURE 6
FIGURE 6
CREB binding protein (CREBBP) activator decreases myofibroblast activation of stiff hydrogels. (a) Representative images of valve interstitial cells (VICs) treated with vehicle, 10 μM TTK21 (CREBBP activator). aSMA = green, DAPI = blue. Cellmask = gray. Scale bar = 100 μm. (b) Quantification of relative cellular aSMA intensity and cell area with drug treatments. n > 427 cells from >4 hydrogels. One‐way analysis of variance (ANOVA) with Bonferroni's multiple comparison test applied. **p < 0.01, ****p < 0.0001
FIGURE 7
FIGURE 7
CREB binding protein (CREBBP) inhibitor increases and CREBBP activator decreases mRNA levels of myofibroblast and proliferative genes. mRNA levels of myofibroblast and proliferative genes on soft hydrogels treated with vehicle and 10 μM CBP‐30 (CREBBP inhibitor) and on stiff hydrogels treated with vehicle and 10 μM TTK21 (CREBBP activator). One‐way analysis of variance (ANOVA) with Bonferroni's multiple comparison test applied. *p < 0.05
FIGURE 8
FIGURE 8
CREB binding protein (CREBBP) expression is higher in normal human aortic valves compared to diseased valves. (a) Representative images of stained tissue sections from healthy or diseased human aortic valve samples (see supplement for de‐identified patient information). Hematoxylin in purple. CREBBP in brown. Scale bar = 200 μm. (b) Quantification of CREBBP levels in healthy (n = 5) or diseased (n = 4) human valve samples. Unpaired two‐way Student's t‐test applied. Data ± SEM

References

    1. Rajamannan NM, Evans FJ, Aikawa E, et al. Calcific aortic valve disease: not simply a degenerative process: a review and agenda for research from the national heart and lung and blood institute aortic stenosis working group. Circulation. 2011;124(16):1783‐1791. doi:10.1161/CIRCULATIONAHA.110.006767 - DOI - PMC - PubMed
    1. Otto CM, Prendergast B. Aortic‐valve stenosis ‐ from patients at risk to severe valve obstruction. N Engl J Med. 2014;371(8):744‐756. doi:10.1056/NEJMra1313875 - DOI - PubMed
    1. Nkomo VT, Gardin JM, Skelton TN, Gottdiener JS, Scott CG, Enriquez‐Sarano M. Burden of valvular heart diseases: a population‐based study. Lancet. 2006;368(9540):1005‐1011. doi:10.1016/S0140-6736(06)69208-8 - DOI - PubMed
    1. Lindman BR, Bonow RO, Otto CM. Current management of calcific aortic stenosis. Circ Res. 2013;113(2):223‐237. doi:10.1161/CIRCRESAHA.111.300084 - DOI - PMC - PubMed
    1. Wang H, Leinwand LA, Anseth KS. Cardiac valve cells and their microenvironment‐insights from in vitro studies. Nat Rev Cardiol. 2014;11(12):715‐727. doi:10.1038/nrcardio.2014.162 - DOI - PMC - PubMed

LinkOut - more resources