. 2022 Sep 13:13:959967.
doi: 10.3389/fimmu.2022.959967. eCollection 2022.

An integrated bioinformatic investigation of mitochondrial energy metabolism genes in colon adenocarcinoma followed by preliminary validation of CPT2 in tumor immune infiltration

Affiliations

An integrated bioinformatic investigation of mitochondrial energy metabolism genes in colon adenocarcinoma followed by preliminary validation of CPT2 in tumor immune infiltration

Zichao Cao et al. Front Immunol. .

Abstract

Background: The prognosis for colon adenocarcinoma (COAD) today remains poor. Changes in mitochondria-related genes and metabolic reprogramming are related to tumor growth, metastasis, and immune evasion and are key factors in tumor genesis and development.

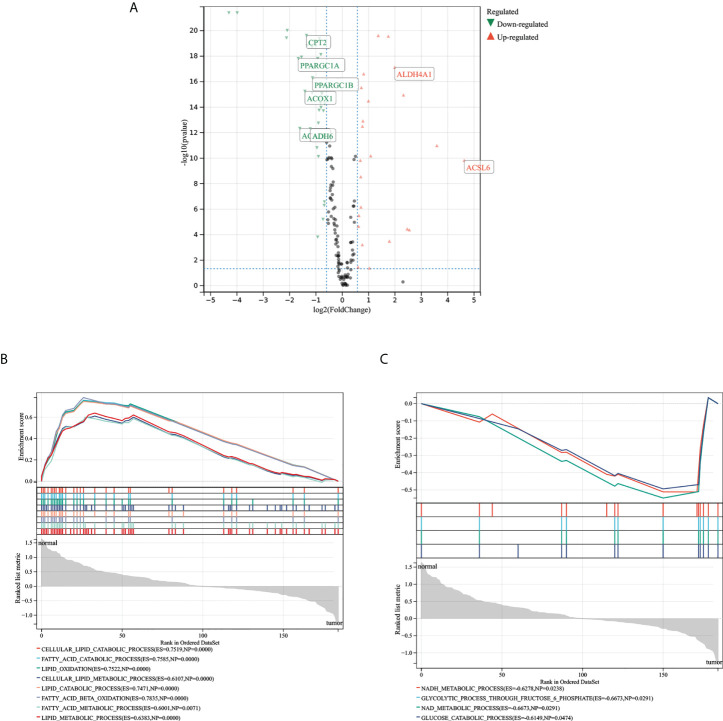
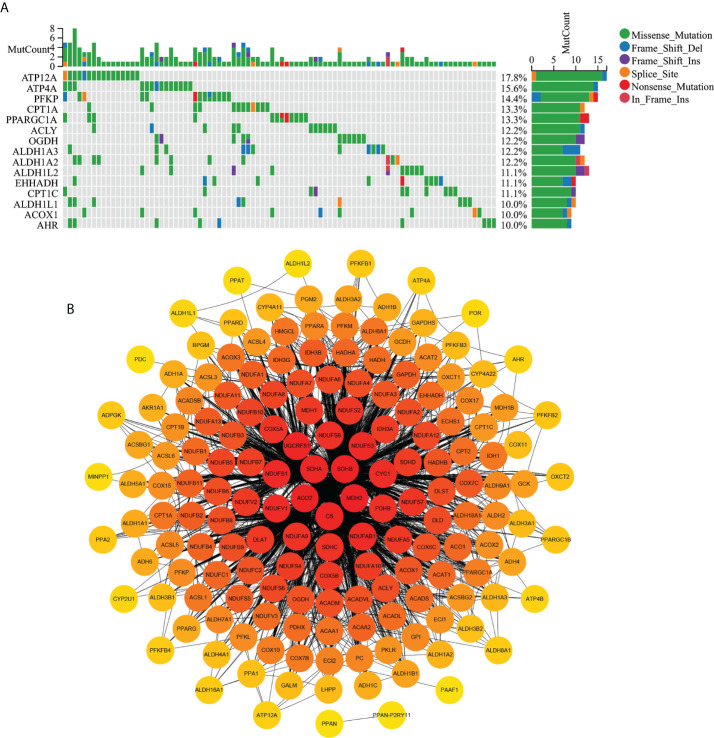
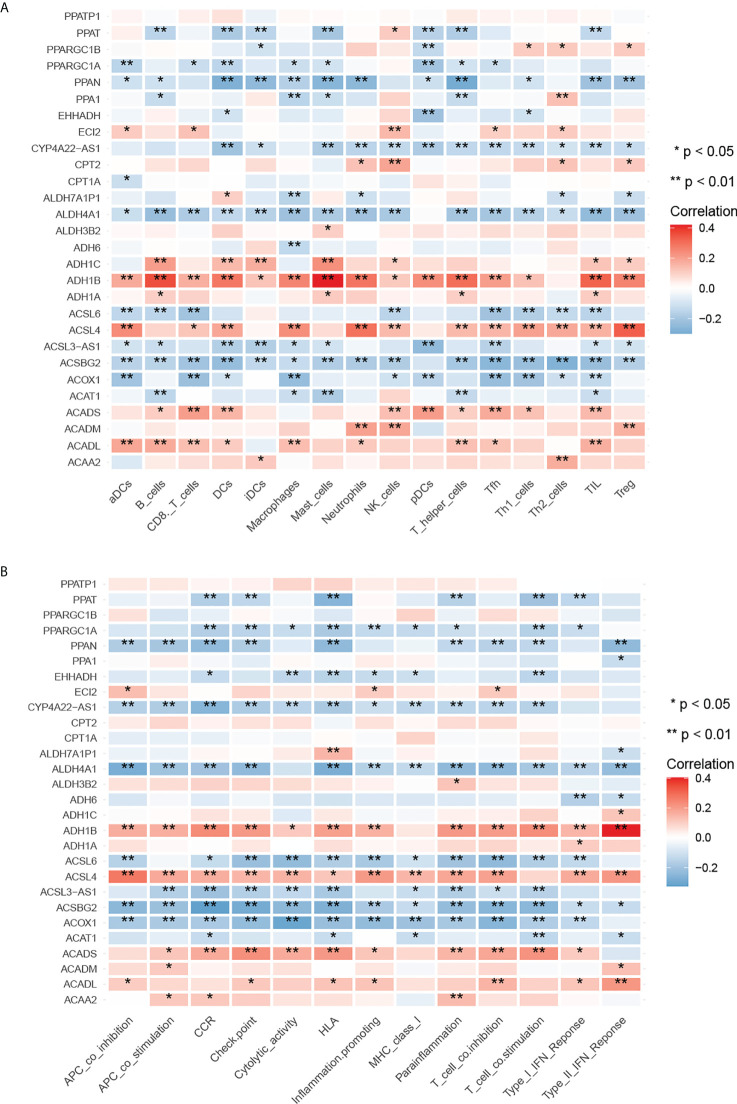
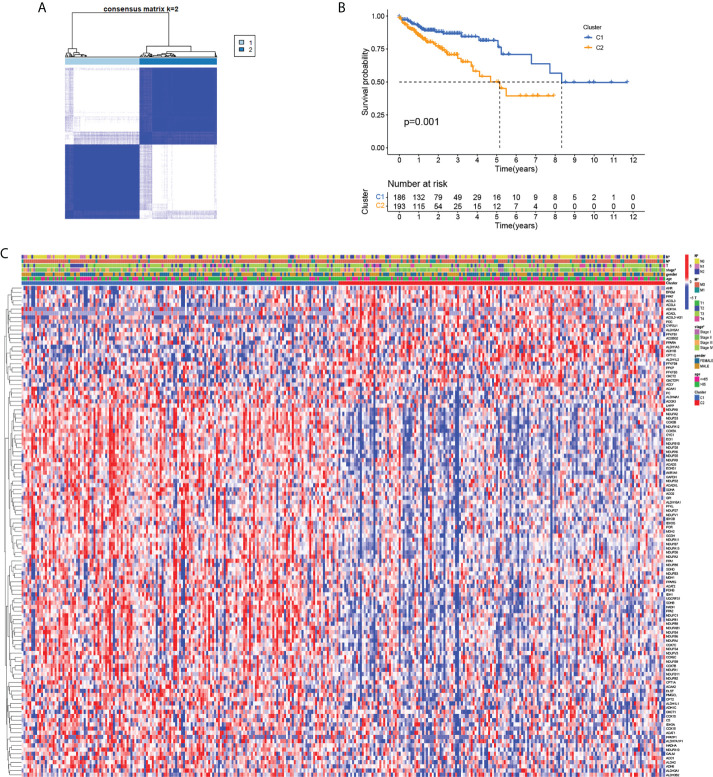
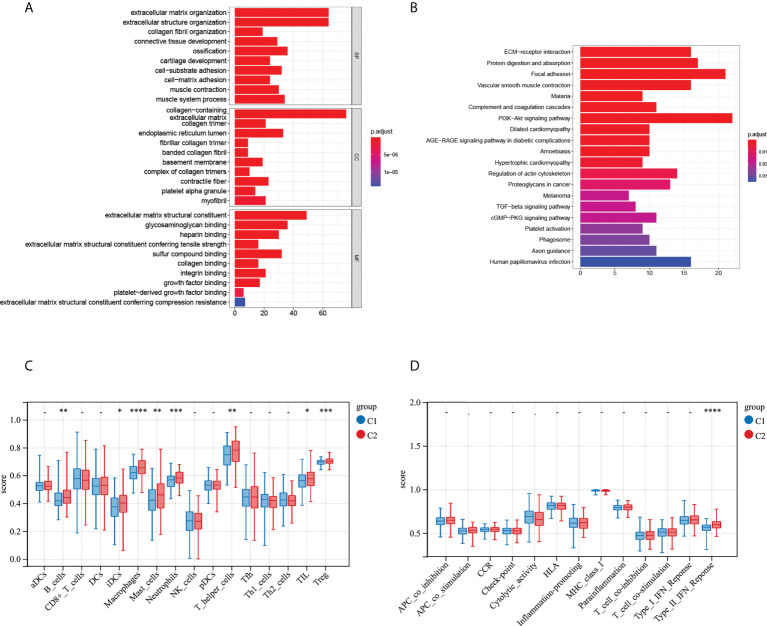
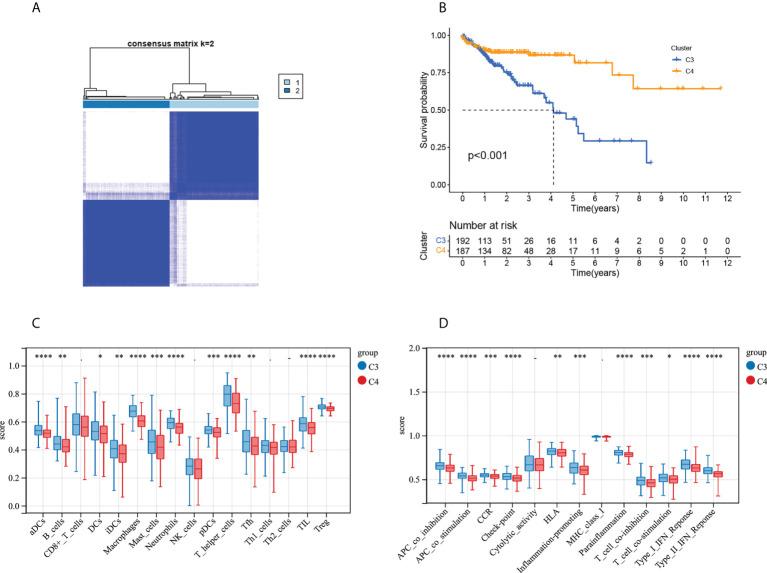
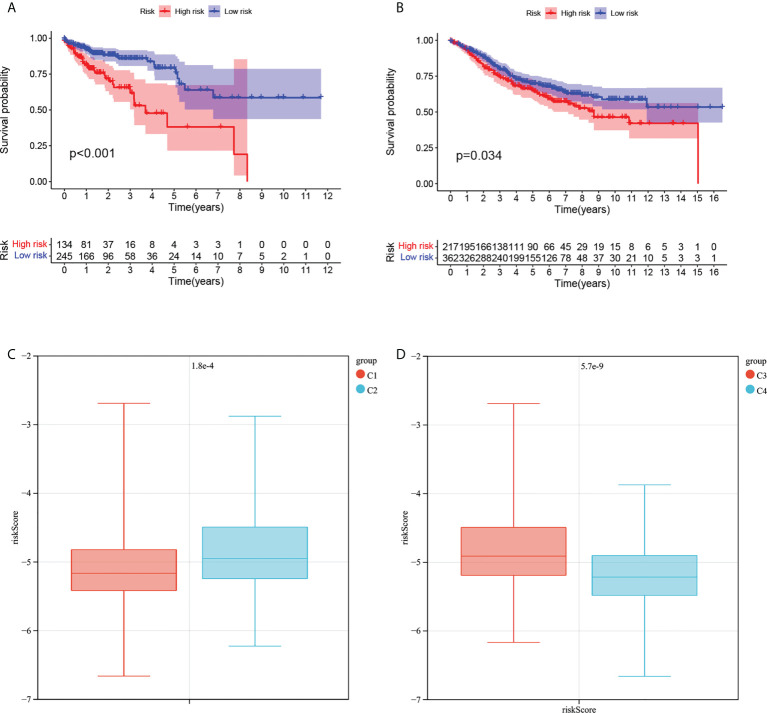
Methods: TCGA database was used to analyze the differentially expressed mitochondrial energy metabolism pathway-related genes (MMRGs) in COAD patients, and the mutation of MMRG in tumor cells, the biological processes involved, and the correlation with tumor immunity were also analyzed. Then, MMRG and MMRG-related genes were used to divide COAD patients into different subtypes, and immunocorrelation analysis and survival analysis were performed. Finally, univariate regression analysis and LASSO regression analysis were used to construct a prognostic risk model for COAD patients, which was verified by the GEO database and evaluated by Kaplan-Meier (K-M) and receiver operating characteristic (ROC) curves, and the correlation between the risk model and immunity and clinical subtypes based on MMRG was analyzed.

Results: In this study, the MMRG patterns and tumor immune microenvironment characteristics in COAD patients were systematically evaluated by clustering the expression of 188 MMRGs. We identified two subtypes of COAD with different clinical and immunological characteristics. Eight of the 28 differentially expressed MMRG genes were used to construct risk scores. ROC and K-M curves suggested that the risk model could well predict the prognosis of COAD patients, and the risk model was related to immune cell infiltration and immune function.

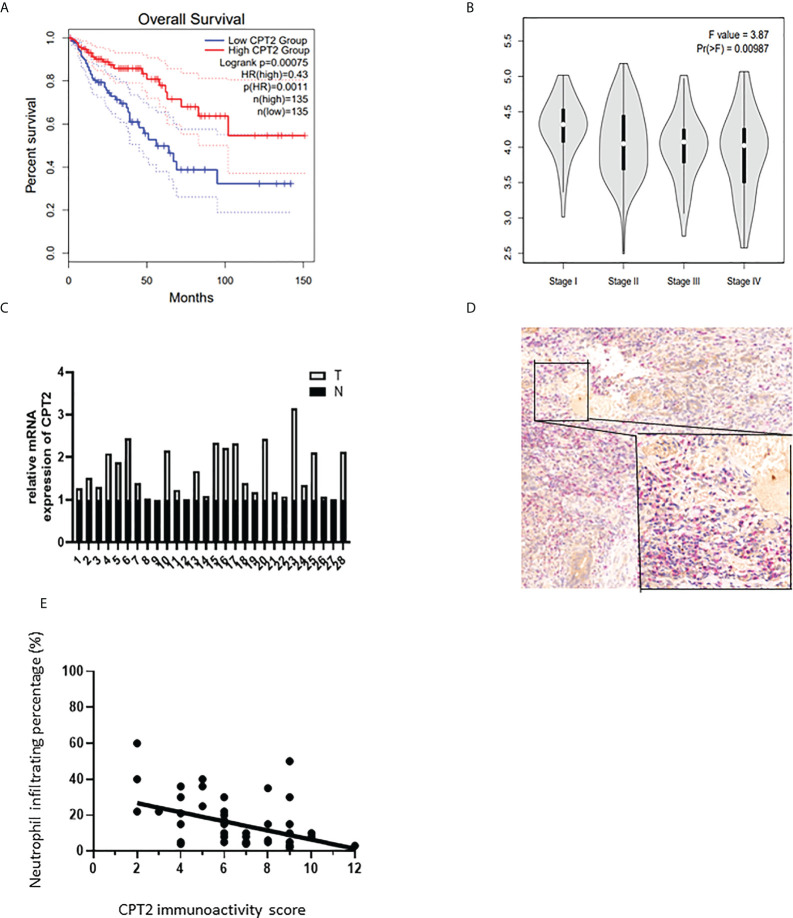
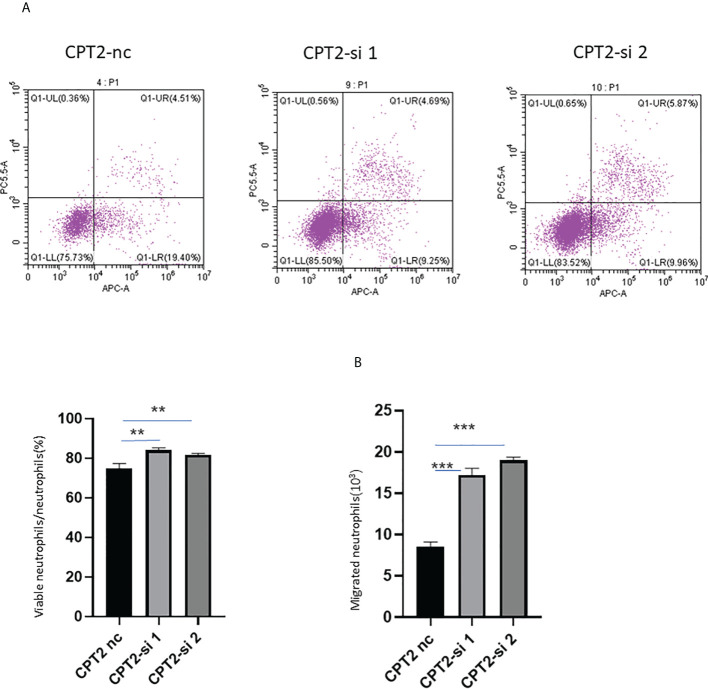
Conclusions: The two COAD subtypes identified by MMRG are helpful for the clinical differentiation of patients with different prognoses and tumor progressions, and the risk score can assist the clinical evaluation of patient prognosis. Our results suggest that CPT2 contributes to the recruitment and regulation of neutrophils in COAD. CPT2 may act as a valuable biomarker for COAD immunotherapy.

Keywords: CPT2; colon adenocarcinoma; energy metabolism; immune; mitochondrion.


Conflict of interest statement

The authors declare that the research was conducted in the absence of any commercial or financial relationships that could be construed as a potential conflict of interest.

Figures

Figure 1
Figure 1
Expression and biological processes of the MMRG gene. (A) Volcanic map of MMRG gene expression in COAD; green represents downregulation in tumors, red represents upregulation in tumors. (B, C) The biological processes of MMRG, which were activated in normal tissue on the left and tumor tissue on the right. MMRGs, mitochondrial energy metabolism pathway-related genes; COAD, colon adenocarcinoma.
Figure 2
Figure 2
Map of MMRG gene mutation and protein interaction in COAD. (A) The first 15 MMRGs mutated in COAD. (B) MMRG protein interaction diagram; the darker the red, the more critical the protein is.
Figure 3
Figure 3
Correlation between differentially expressed MMRGs and immune characteristics. (A) Correlation between differentially expressed MMRGs and tumor immune cell infiltration; red is positive, blue is negative. (B) Correlation between differentially expressed MMRGs and tumor immune function, red is positive, blue is negative. *p < 0.05; **p < 0.01.
Figure 4
Figure 4
Tumor classification based on the MMRGs. (A) COAD patients were grouped into two clusters according to the consensus clustering matrix (k = 2). (B) Kaplan–Meier curves for the two clusters. (C) Heatmap for the expression of MMRGs and clinical features between two clusters; red represents high expression, and blue represents low expression.
Figure 5
Figure 5
Differential immune characteristics of MMRG patterns C1 and C2. (A) GO bar graph for genes in BP, CC, and MF. (B) Bubble graph of the top five KEGG pathways with the most enriched genes; the vertical axis refers to the names of the pathway, and the horizontal axis refers to the number of genes. (C) Relative infiltration of 16 types of immune cells in MMRG clusters C1 and C2. (D) Relative enrichment score of 13 immune-related functions in MMRG clusters C1 and C2. GO, Gene Ontology; BP, biological process; CC, cellular component; MF, molecular function; KEGG, Kyoto Encyclopedia of Genes and Genomes. *p < 0.05; **p < 0.01; ***p < 0.001; ****p < 0.0001.
Figure 6
Figure 6
Tumor classification based on the MMRG-related gene. (A) COAD patients were grouped into two clusters according to the consensus clustering matrix (k = 2). (B) Kaplan–Meier curves for the two clusters. (C) Relative infiltration of 16 types of immune cells in MMRG-related gene clusters C3 and C4. (D) Relative enrichment score of 13 immune-related functions in MMRG-related gene clusters C3 and C4. *p < 0.05; **p < 0.01; ***p < 0.001; ****p < 0.0001.
Figure 7
Figure 7
Survival analysis of risk models and correlation with COAD subtypes. (A) Analysis of survival differences between high-risk and low-risk COAD patients in TCGA database. (B) Analysis of survival differences between high-risk and low-risk COAD patients in GSE39582. (C) The correlation of risk score with the MMRG pattern. (D) The correlation of risk score with the MMRG-related gene pattern.
Figure 8
Figure 8
Correlation of CPT2 expression and immune infiltration in human specimens. (A, B) Correlation of CPT2 expression with Kaplan–Meier curves and clinical stages in COAD patients. (C) Relative mRNA expression of CPT2 in 28 paired human specimens, N normal vs. T tumor. (D) Representative multiplexed IHC image of tissue area (2 mm × 1.5 mm) with an enlarged image for COAD human specimens, showing staining of CPT2 (brown) and MPO (red). (E) Spearman correlation analyses suggested that the expression of CPT2 negatively correlated with that of MPO (Spearman r = −0.42, p < 0.01). Scale bars are 20 and 200 μm in (D).
Figure 9
Figure 9
CPT2 modulates migration and apoptosis of neutrophils. (A) Migration of neutrophils toward CM from CPT2-si and CPT2-nc RKO cells was evaluated using in vitro Transwell migration assay in triplicate (one-way ANOVA test). (B) Tumor cell-derived conditioned medium from RKO cells with different expressions of CPT2 alter neutrophil survival. Data are presented as means ± SEM. **p < 0.01; ***p < 0.001.

Similar articles

Cited by

References

    1. Sung H, Ferlay J, Siegel RL, Laversanne M, Soerjomataram I, Jemal A, et al. . Global cancer statistics 2020: GLOBOCAN estimates of incidence and mortality worldwide for 36 cancers in 185 countries. CA Cancer J Clin (2021) 71:209–49. doi: 10.3322/caac.21660 - DOI - PubMed
    1. de Jong MC, Pulitano C, Ribero D, Strub J, Mentha G, Schulick RD, et al. . Rates and patterns of recurrence following curative intent surgery for colorectal liver metastasis: an international multi-institutional analysis of 1669 patients. Ann Surg (2009) 250:440–8. doi: 10.1097/SLA.0b013e3181b4539b - DOI - PubMed
    1. Fleming M, Ravula S, Tatishchev SF, Wang HL. Colorectal carcinoma: Pathologic aspects. J Gastrointest Oncol (2012) 3:153–73. doi: 10.3978/j.issn.2078-6891.2012.030 - DOI - PMC - PubMed
    1. Weinberg BA, Marshall JL. Colon cancer in young adults: Trends and their implications. Curr Oncol Rep (2019) 21:3. doi: 10.1007/s11912-019-0756-8 - DOI - PubMed
    1. La Vecchia S, Sebastian C. Metabolic pathways regulating colorectal cancer initiation and progression. Semin Cell Dev Biol (2020) 98:63–70. doi: 10.1016/j.semcdb.2019.05.018 - DOI - PubMed

Publication types

MeSH terms

Substances

LinkOut - more resources