. 2022 Sep 13:13:957224.
doi: 10.3389/fimmu.2022.957224. eCollection 2022.

SARS-CoV-2 modulates virus receptor expression in placenta and can induce trophoblast fusion, inflammation and endothelial permeability

Affiliations

SARS-CoV-2 modulates virus receptor expression in placenta and can induce trophoblast fusion, inflammation and endothelial permeability

Chiara Agostinis et al. Front Immunol. .

Abstract

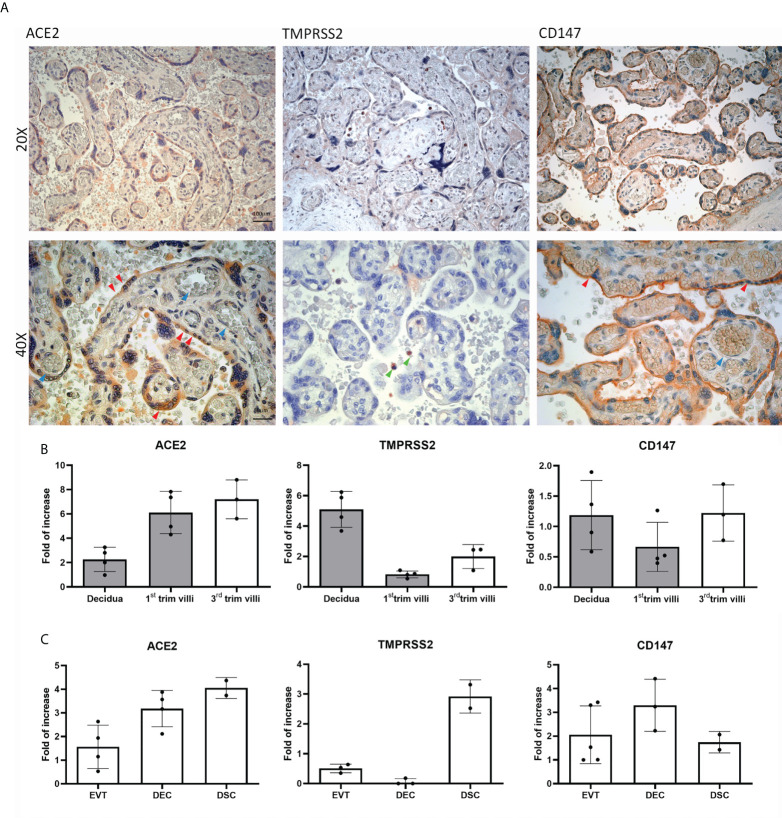
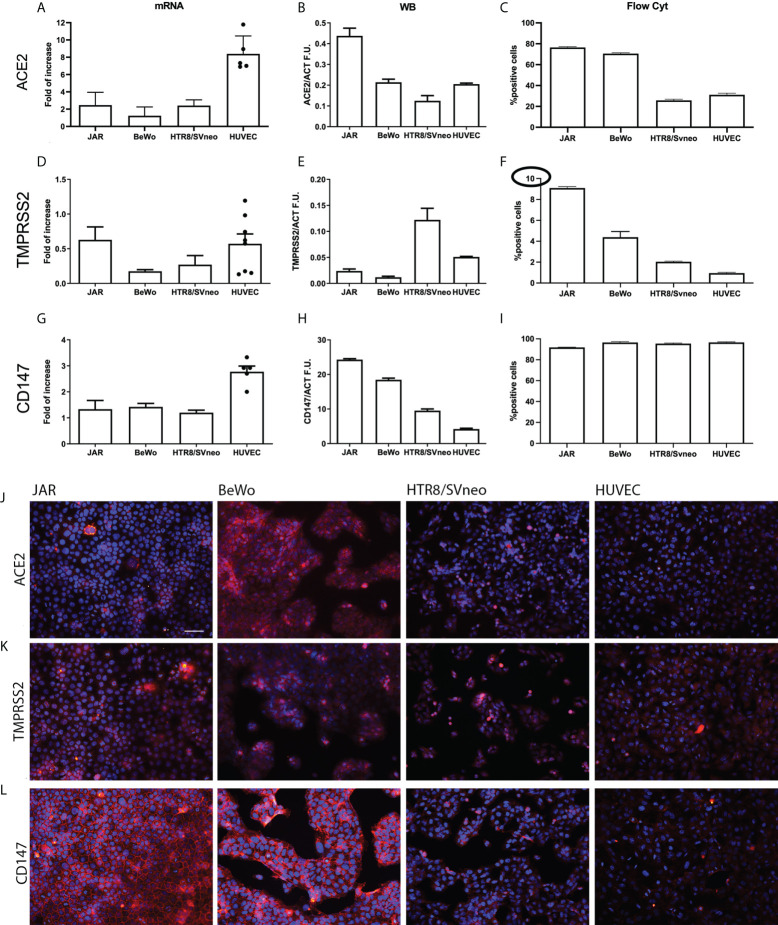
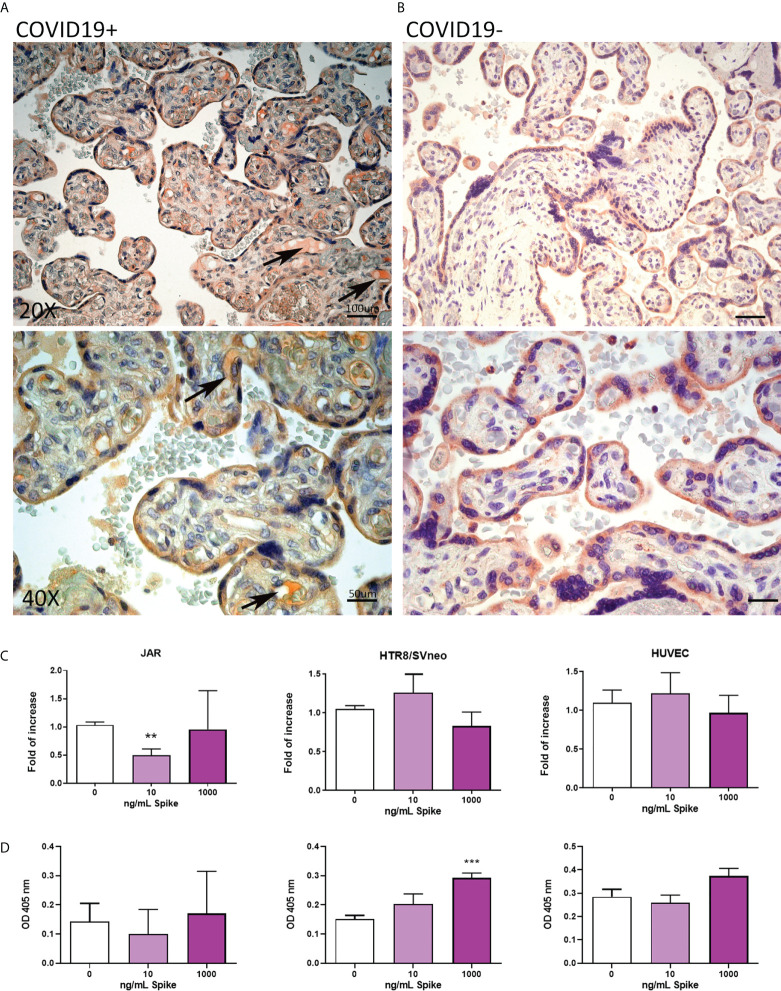
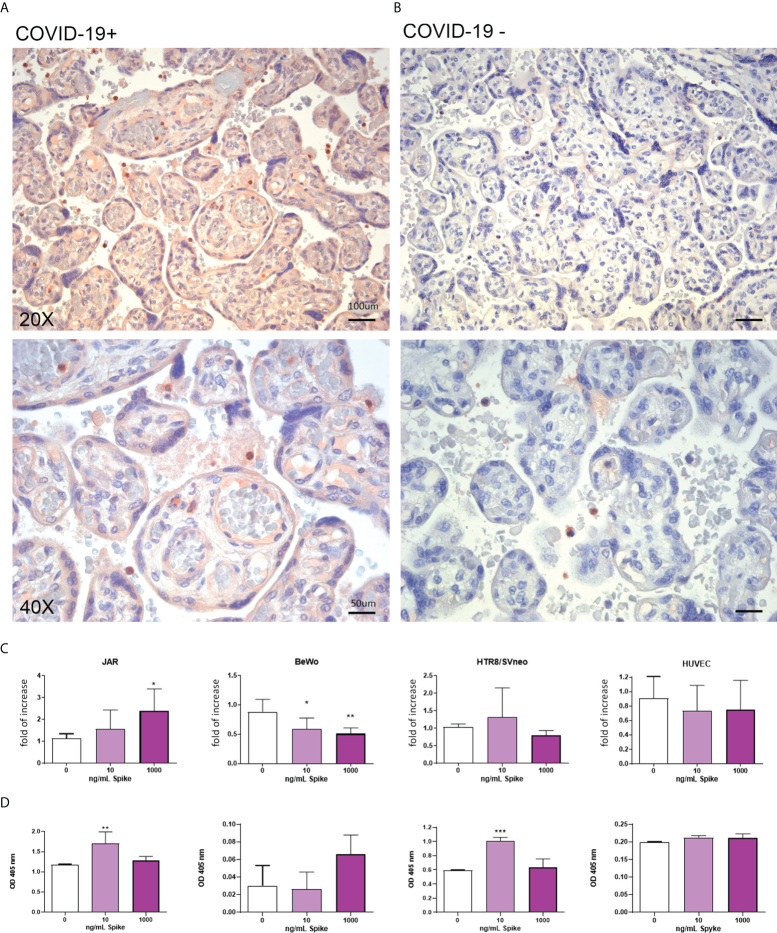
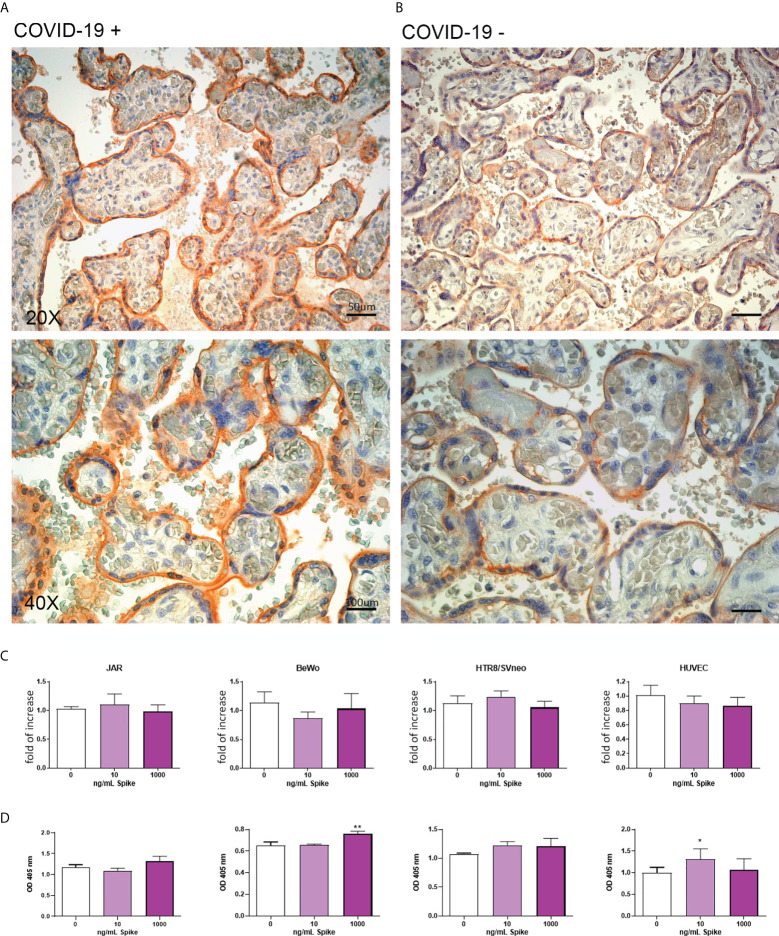
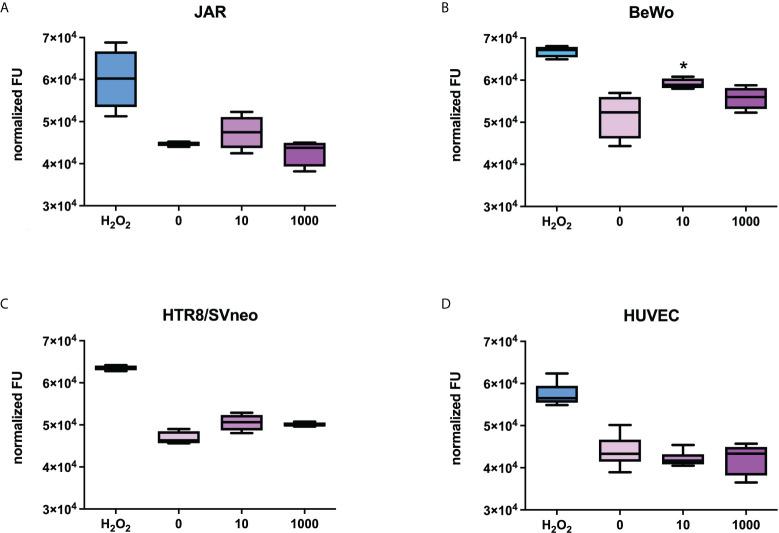
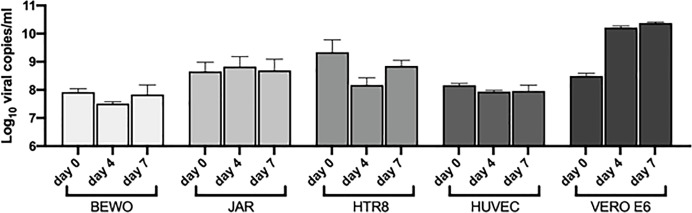
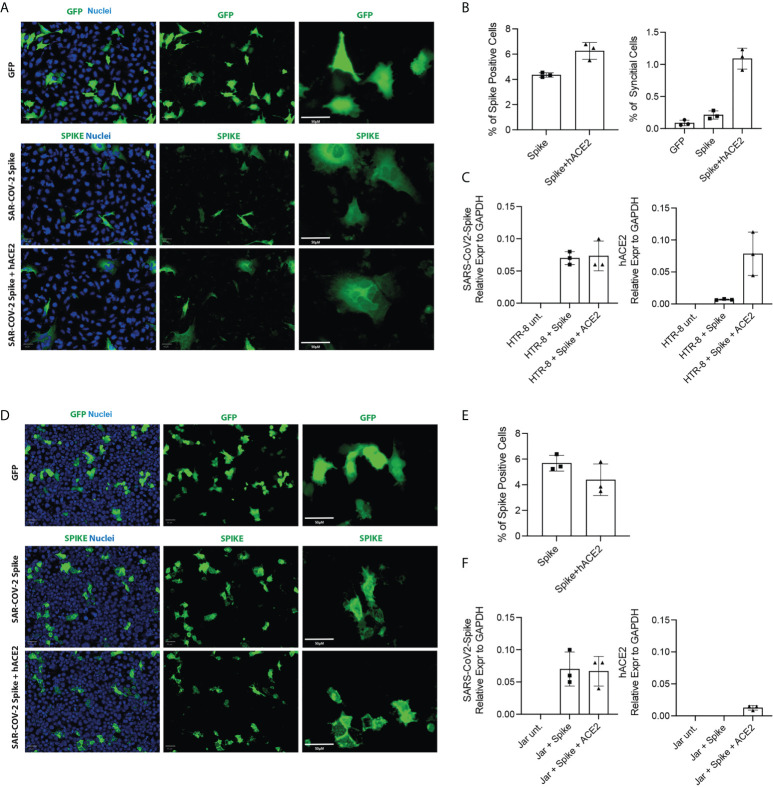
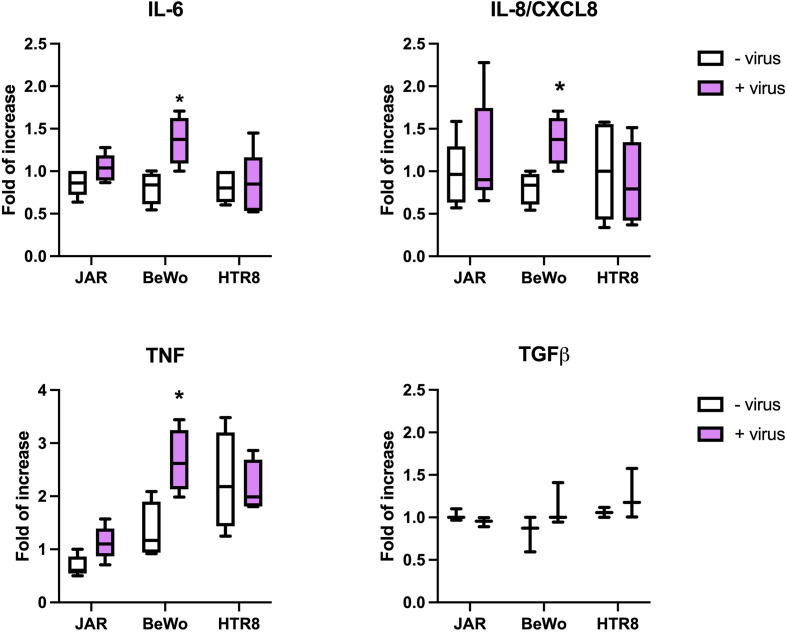
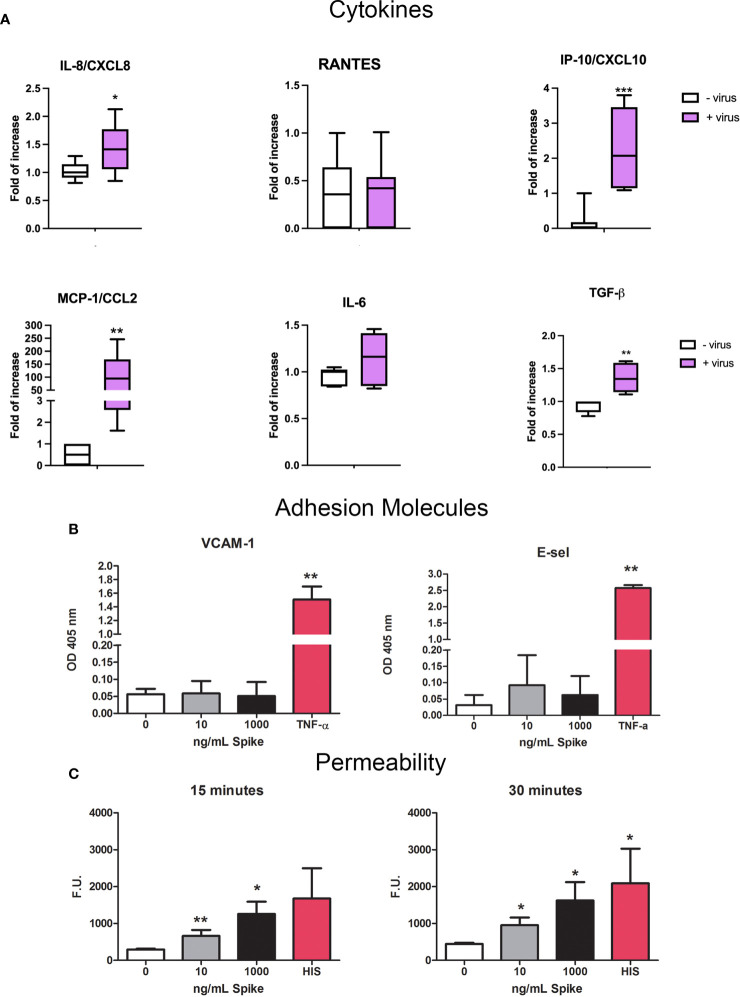
SARS-CoV-2 is a devastating virus that induces a range of immunopathological mechanisms including cytokine storm, apoptosis, inflammation and complement and coagulation pathway hyperactivation. However, how the infection impacts pregnant mothers is still being worked out due to evidence of vertical transmission of the SARS-CoV-2, and higher incidence of pre-eclampsia, preterm birth, caesarian section, and fetal mortality. In this study, we assessed the levels of the three main receptors of SARS-CoV-2 (ACE2, TMPRSS2 and CD147) in placentae derived from SARS-CoV-2 positive and negative mothers. Moreover, we measured the effects of Spike protein on placental cell lines, in addition to their susceptibility to infection. SARS-CoV-2 negative placentae showed elevated levels of CD147 and considerably low amount of TMPRSS2, making them non-permissive to infection. SARS-CoV-2 presence upregulated TMPRSS2 expression in syncytiotrophoblast and cytotrophoblast cells, thereby rendering them amenable to infection. The non-permissiveness of placental cells can be due to their less fusogenicity due to infection. We also found that Spike protein was capable of inducing pro-inflammatory cytokine production, syncytiotrophoblast apoptosis and increased vascular permeability. These events can elicit pre-eclampsia-like syndrome that marks a high percentage of pregnancies when mothers are infected with SARS-CoV-2. Our study raises important points relevant to SARS-CoV-2 mediated adverse pregnancy outcomes.

Keywords: ACE2; CD147; SARS-CoV-2; TMPRSS2; pregnancy.


Conflict of interest statement

The authors declare that the research was conducted in the absence of any commercial or financial relationships that could be construed as a potential conflict of interest.

Figures

Figure 1
Figure 1
Distribution and basal expression of the SARS-CoV-2 receptors in healthy placentae. (A) Representative microphotographs showing ACE2, TMPRSS2 and CD147 distribution in placental tissues. ACE2 was localized within syncytiotrophoblasts, whilst TMPRSS2 staining was almost negative. Staining for CD147 indicated a high protein expression. AEC chromogen (red) was used to visualize the binding of anti-human primary antibodies. Red arrows indicate syncytiotrophoblast, blue arrows villous vessels and green arrows show leukocytes in the intervillous space. Nuclei were counterstained in blue with Mayer's Hematoxylin; scale bars, 100 µm. (B) Analysis of mRNA expression of SARS-CoV-2 receptors in placental tissues derived from healthy placentae: 5 from first trimester (grey histograms) and 3 from third trimester placentae. Data are represented as mean ± SE of three independent experiments performed in triplicate. (C) Histograms representing ACE2, TMPRSS2 and CD147 mRNA expression in extravillous trophoblast (EVT), endothelial (DEC) and stromal (DSC) cells isolated from normal first trimester decidua. Data are represented as mean ± SE of three independent experiments performed in triplicate.
Figure 2
Figure 2
Characterization of SARS-CoV-2 entry receptors’ expression in placental cell lines. Gene and protein expression levels of ACE2 (A-C), TMPRSS2 (D-F) and CD147 (G-I) were evaluated by RT-qPCR, Western blot and flow cytometry in JAR, BeWo, HTR8/SVneo and HUVECs (n = 6, different populations are represented by dots). All the placental cell lines showed a low level protein expression of TMPRSS2 (highlighted by the circle in the different set up of the axis) and a high protein expression level of CD147, whilst ACE2 expression appeared more variable among them. (J-L) Immunofluorescence analysis of SARS-CoV-2 entry receptors in placental cell lines. JAR, BeWo, HTR8/SVneo and HUVECs were stained with anti-human ACE2 (J), TMPRSS2 (K) or CD147 (L) primary antibodies, followed by Cy3-conjugated secondary antibodies (red). Nuclei were stained in blue with DAPI. Images were acquired with a Leica DM 3000 fluorescence microscope using a Leica DFC 7000 camera. Scale bar, 50 μm.
Figure 3
Figure 3
(A, B) Representative microphotographs showing expression of ACE2 in COVID-19+ (A) or COVID-19- (B) placental tissues. Arrows show the presence of ACE2 positivity in fetal vessels of chorionic villi. Streptavidin–biotin–peroxidase complex system with AEC (red) chromogen. (C) After stimulation with 10 ng/mL or 1000 ng/mL of Spike S1 protein for 24 h, RNA was extracted from placental cell lines and quantified for ACE2 expression by RT-qPCR. The expression was normalized using the housekeeping genes 18S, ACTB and GAPDH; results were mediated (geometric mean) and expressed as fold of increase. Data are expressed as mean ± SE of three independent experiments performed in triplicate. **p < 0.01, as compared to untreated cells (Mann-Whitney test). (D) ELISA on whole cells for detecting ACE2 cell surface expression after 24 h of incubation with 10 ng/mL or 1000 ng/mL of Spike S1 protein. Data are expressed as mean ± SD of two independent experiments performed in triplicate. ***p < 0.001, as compared to untreated cells (Mann-Whitney test).
Figure 4
Figure 4
(A, B) Representative microphotographs showing the expression of TMPRSS2 in COVID-19+ (A) or COVID-19- (B) placental tissues. Streptavidin–biotin–peroxidase complex system with AEC (red) chromogen. (C) After stimulation with 10 ng/mL or 1000 ng/mL of Spike S1 protein for 24 h, RNA was extracted from placental cell lines and quantified for TMPRSS2 expression by RT-qPCR. The expression was normalized against the housekeeping genes 18S, ACTB and GAPDH; results were mediated (geometric mean) and expressed as fold increase. Data are expressed as mean ± SE of three independent experiments performed in triplicate. *p < 0.05; **p < 0.01, ***p < 0.001, as compared to untreated cells (Mann-Whitney test). (D) ELISA on whole cells for detecting TMPRSS2 surface expression following 24 h of incubation with 10 ng/mL or 1000 ng/mL of Spike S1 protein. Data are expressed as mean ± SD of two independent experiments performed in triplicate. *p < 0.05, ***p < 0.001 with respect to untreated cells (Mann-Whitney test).
Figure 5
Figure 5
(A, B) Representative microphotographs showing the expression of CD147 in COVID-19+ (A) or COVID-19- (B) placental tissues. Streptavidin–biotin–peroxidase complex system with AEC (red) chromogen. (C) After stimulation with 10 ng/mL or 1000 ng/mL of Spike S1 protein for 24 h, RNA was extracted from placental cell lines and quantified for CD147 expression by RT-qPCR. The expression was normalized using the housekeeping genes 18S, ACTB and GAPDH; results were mediated (geometric mean) and expressed as fold increase. Data are expressed as mean ± SE of three independent experiments performed in triplicate. *p < 0.05, **p < 0.01 as compared to untreated cells (Mann-Whitney test). (D) ELISA on whole cells for detecting CD147 cell surface expression following 24 h of incubation with 10 ng/mL or 1000 ng/mL of Spike S1 protein. Data are expressed as mean ± SD of two independent experiments performed in triplicate. *p < 0.05, **p < 0.01, as compared to untreated cells (Mann-Whitney test).
Figure 6
Figure 6
Evaluation of the proapoptotic effect of Spike S1 protein on placental cells. JAR (A), BeWo (B), HTR8/SVneo (C) or HUVECs (D) were grown to 80% confluence in 96-well plates and incubated with 10 ng/mL or 1000 ng/mL of Spike S1 protein. H2O2 (0.5 µM) was used as a positive control. The cells were incubated with 5 µM of CellEvent Caspase-3/7 Green Detection Reagent. Fluorescence signals were normalized for the total proteins present in each well. For each group, the line in the middle of the box represents the median. The lower and the upper edges of the box indicate the 1st and 3rd quartile, respectively. Data are results from three independent experiments performed in triplicate. p < 0.05, as compared to untreated cells (Mann-Whitney test).
Figure 7
Figure 7
Quantification by RT-qPCR of SARS-CoV-2 RNA presence in the supernatant of cells incubated with the virus. VERO E6 were used as a control. The viral load was displayed as Log10 viral copies/ml (mean ± SD) at day 0, 4 and 7 post infection.
Figure 8
Figure 8
Cell Fusion Assay. HTR8/SVneo and JAR cells were seeded 10h before transfection. Cells were then transfected with pCMV-SPIKEDelta-V5+pCMV-hACE2, pCMV-SPIKEDelta-V5+pcDNA3 or pCMV-GFP+pcDNA3. Representative images of green fluorescence protein (GFP) and immunostaining for SARS-CoV-2 -Spike in HTR8 (A) and JAR (D) taken using the Operetta high content screening microscope (PerkinElmer) with Olympus 20 x (NA-0.45) objective. Quantification of the total cells expressing Spike and the total number of syncytia per well in HTR8 (B) and JAR (E). mRNA expression levels by RT-qPCR of SARS-CoV2-Spike and hACE2 in HTR8 (C) and JAR (F).
Figure 9
Figure 9
Evaluation of cytokine expression induced by SARS-CoV-2. The placental cells were challenged for 24 hours with SARS-CoV-2; total RNA was isolated and analyzed by RT-qPCR for the expression of IL-6, IL-8, TNF-α and TGF-β. The expression was normalized against the housekeeping genes 18S, ACTB and GAPDH; results were mediated and expressed as fold increase. Data are expressed as mean ± SD of two independent experiments performed in triplicate. *p < 0.05.
Figure 10
Figure 10
Pro-inflammatory effect of SARS-CoV-2 or Spike S1 protein on HUVECs. (A) RT-qPCR for gene expression analysis of MCP-1/CCL2, RANTES/CCL5, IP-10/CXCL10, IL-8/CXCL8, IL-6 and TGF-β in SARS-CoV-2-stimulated HUVECs. After 24 h of treatment with S1, total mRNA was isolated and gene expression analysis was performed by RT-qPCR. The expression was normalized using the housekeeping genes 18S, ACTB and GAPDH; the results were mediated and expressed as fold increase. Data are expressed as mean ± SD of two independent experiments performed in triplicate. *p < 0.05; **p < 0.01; ***p < 0.001, as compared to untreated cells. (B) Analysis of the expression of the adhesion molecules VCAM-1 and E-Selectin. Four different populations of HUVECs were grown to confluence in a 96-well plate and incubated with 10 ng/mL or 1000 ng/mL of Spike S1 protein. TNF-α (100 ng/mL) was used as a positive control. Cells were incubated with anti-human VCAM-1 or anti-human E-selectin monoclonal antibodies, followed by alkaline phosphatase-conjugated secondary antibodies. Data are expressed as mean ± SE of four experiments performed in triplicate. **p < 0.01, as compared to untreated cells (Mann-Whitney test). (C) Permeabilizing effect of Spike protein on endothelial cells. The permeabilizing activity was evaluated kinetically, after 15 and 30 minutes, by adding 10 ng/mL or 1000 ng/mL of Spike protein to the upper chamber of the transwell, and then measuring the amount of FITC-labeled BSA that leaked through a monolayer of endothelial cells into the lower chamber. Histamine (HIS) was used as a positive control. Data are expressed as mean ± SD of four experiments performed in duplicate. *p < 0.05; **p < 0.01, as compared to untreated cells (Mann-Whitney test).

References

    1. Varghese PM, Tsolaki AG, Yasmin H, Shastri A, Ferluga J, Vatish M, et al. . Host-pathogen interaction in COVID-19: Pathogenesis, potential therapeutics and vaccination strategies. Immunobiology (2020) 225(6):152008. doi: 10.1016/j.imbio.2020.152008 - DOI - PMC - PubMed
    1. Yasmin H, Saha S, Butt MT, Modi RK, George AJT, Kishore U. SARS-CoV-2: Pathogenic mechanisms and host immune response. Adv Exp Med Biol (2021) 1313:99–134. doi: 10.1007/978-3-030-67452-6_6 - DOI - PubMed
    1. Kotlyar AM, Grechukhina O, Chen A, Popkhadze S, Grimshaw A, Tal O, et al. . Vertical transmission of coronavirus disease 2019: A systematic review and meta-analysis. Am J Obstet Gynecol (2021) 224(1):35–53 e3. doi: 10.1016/j.ajog.2020.07.049 - DOI - PMC - PubMed
    1. Allotey J, Chatterjee S, Kew T, Gaetano A, Stallings E, Fernandez-Garcia S, et al. . SARS-CoV-2 positivity in offspring and timing of mother-to-child transmission: living systematic review and meta-analysis. BMJ (2022) 376:e067696. doi: 10.1136/bmj-2021-067696 - DOI - PMC - PubMed
    1. Di Mascio D, Khalil A, Saccone G, Rizzo G, Buca D, Liberati M, et al. . Outcome of coronavirus spectrum infections (SARS, MERS, COVID-19) during pregnancy: a systematic review and meta-analysis. Am J Obstet Gynecol MFM (2020) 2(2):100107. doi: 10.1016/j.ajogmf.2020.100107 - DOI - PMC - PubMed