

Altered cerebral blood flow in patients with spinocerebellar degeneration
- PMID: 36177360
- PMCID: PMC9513175
- DOI: 10.3389/fnins.2022.977145
Altered cerebral blood flow in patients with spinocerebellar degeneration
Abstract
Objectives: Spinocerebellar degeneration (SCD) comprises a multitude of disorders with sporadic and hereditary forms, including spinocerebellar ataxia (SCA). Except for progressive cerebellar ataxia and structural atrophy, hemodynamic changes have also been observed in SCD. This study aimed to explore the whole-brain patterns of altered cerebral blood flow (CBF) and its correlations with disease severity and psychological abnormalities in SCD via arterial spin labeling (ASL).
Methods: Thirty SCD patients and 30 age- and sex-matched healthy controls (HC) were prospectively recruited and underwent ASL examination on a 3.0T MR scanner. The Scale for Assessment and Rating of Ataxia (SARA) and the International Cooperative Ataxia Rating Scale (ICARS) scores were used to evaluate the disease severity in SCD patients. Additionally, the status of anxiety, depression and sleep among all patients were, respectively, evaluated by the Self-Rating Anxiety Scale (SAS), Self-Rating Depression Scale (SDS) and Self-Rating Scale of Sleep (SRSS). We compared the whole-brain CBF value between SCD group and HC group at the voxel level. Then, the correlation analyses between CBF and disease severity, and psychological abnormalities were performed on SCD group.
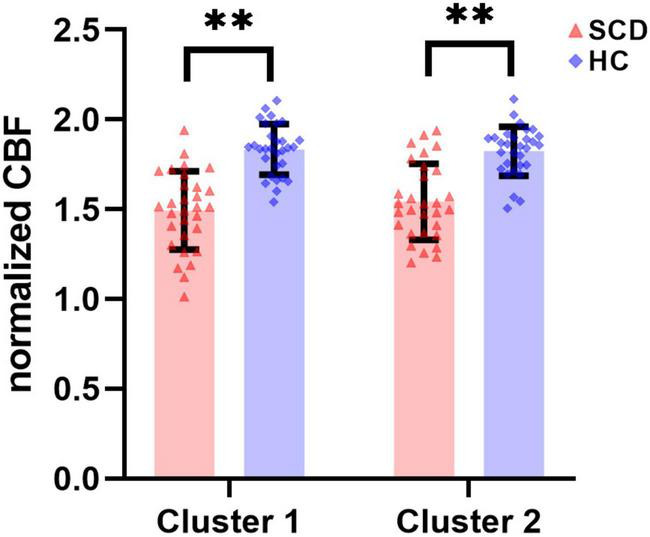
Results: Compared with HC, SCD patients demonstrated decreased CBF value in two clusters (FWE corrected P < 0.05), covering bilateral dentate and fastigial nuclei, bilateral cerebellar lobules I-IV, V and IX, left lobule VI, right lobule VIIIb, lobules IX and X of the vermis in the cerebellar Cluster 1 and the dorsal part of raphe nucleus in the midbrain Cluster 2. The CBF of cerebellar Cluster 1 was negatively correlated with SARA scores (Spearman's rho = -0.374, P = 0.042) and SDS standard scores (Spearman's rho = -0.388, P = 0.034), respectively. And, the CBF of midbrain Cluster 2 also had negative correlations with SARA scores (Spearman's rho = -0.370, P = 0.044) and ICARS scores (Pearson r = -0.464, P = 0.010).
Conclusion: The SCD-related whole-brain CBF changes mainly involved in the cerebellum and the midbrain of brainstem, which are partially overlapped with the related function cerebellar areas of hand, foot and tongue movement. Decreased CBF was related to disease severity and depression status in SCD. Therefore, CBF may be a promising neuroimaging biomarker to reflect the severity of SCD and suggest mental changes.
Keywords: arterial spin labeling; cerebellum; cerebral blood flow; spinocerebellar ataxia; spinocerebellar degeneration.
Copyright © 2022 Liu, Yang, Gao, Chen, Wang, Liu, Lv, Zhang and Ma.
Conflict of interest statement
The authors declare that the research was conducted in the absence of any commercial or financial relationships that could be construed as a potential conflict of interest.
Figures


Similar articles
-
Impaired Adaptive Motor Learning Is Correlated With Cerebellar Hemispheric Gray Matter Atrophy in Spinocerebellar Ataxia Patients: A Voxel-Based Morphometry Study.Front Neurol. 2019 Nov 14;10:1183. doi: 10.3389/fneur.2019.01183. eCollection 2019. Front Neurol. 2019. PMID: 31803128 Free PMC article.
-
Arterial spin labeling MR imaging for the clinical detection of cerebellar hypoperfusion in patients with spinocerebellar degeneration.J Neurol Sci. 2018 Nov 15;394:58-62. doi: 10.1016/j.jns.2018.09.007. Epub 2018 Sep 6. J Neurol Sci. 2018. PMID: 30216759
-
[Study of patients with spinocerebellar degeneration using positron emission tomography].Rinsho Shinkeigaku. 1993 Oct;33(10):1039-46. Rinsho Shinkeigaku. 1993. PMID: 8293603 Japanese.
-
The correlation between magnetic resonance imaging features of the brainstem and cerebellum and clinical features of spinocerebellar ataxia 3/Machado-Joseph disease.Neurol India. 2009 Sep-Oct;57(5):578-83. doi: 10.4103/0028-3886.57803. Neurol India. 2009. PMID: 19934555
-
The History of Gene Hunting in Hereditary Spinocerebellar Degeneration: Lessons From the Past and Future Perspectives.Front Genet. 2021 Mar 23;12:638730. doi: 10.3389/fgene.2021.638730. eCollection 2021. Front Genet. 2021. PMID: 33833777 Free PMC article. Review.
Cited by
-
Efficacy and Safety of Taltirelin Hydrate in Patients With Ataxia Due to Spinocerebellar Degeneration.J Mov Disord. 2025 Jan;18(1):35-44. doi: 10.14802/jmd.24127. Epub 2024 Oct 21. J Mov Disord. 2025. PMID: 39428104 Free PMC article.
-
Effects of Non-invasive Brain Stimulation on Hereditary Ataxia: a Systematic Review and Meta-analysis.Cerebellum. 2024 Aug;23(4):1614-1625. doi: 10.1007/s12311-023-01638-x. Epub 2023 Nov 29. Cerebellum. 2024. PMID: 38019418
References
-
- Alsop D. C., Detre J. A., Golay X., Günther M., Hendrikse J., Hernandez-Garcia L., et al. (2015). Recommended implementation of arterial spin-labeled perfusion MRI for clinical applications: A consensus of the ISMRM perfusion study group and the European consortium for ASL in dementia. Magn. Reson. Med. 73 102–116. 10.1002/mrm.25197 - DOI - PMC - PubMed
LinkOut - more resources
Full Text Sources