

Iron deposition heterogeneity in extrapyramidal system assessed by quantitative susceptibility mapping in Parkinson's disease patients with type 2 diabetes mellitus
- PMID: 36177478
- PMCID: PMC9513156
- DOI: 10.3389/fnagi.2022.975390
Iron deposition heterogeneity in extrapyramidal system assessed by quantitative susceptibility mapping in Parkinson's disease patients with type 2 diabetes mellitus
Abstract
Purpose: Excessive brain iron depositions were found in both patients with Parkinson's disease (PD) and those with type 2 diabetes mellitus (T2DM). The present study aimed to explore iron deposition and heterogeneity in the extrapyramidal system in PD patients with T2DM using quantitative susceptibility mapping (QSM) and further to reveal the effect of T2DM on the changes in brain iron in patients with PD.
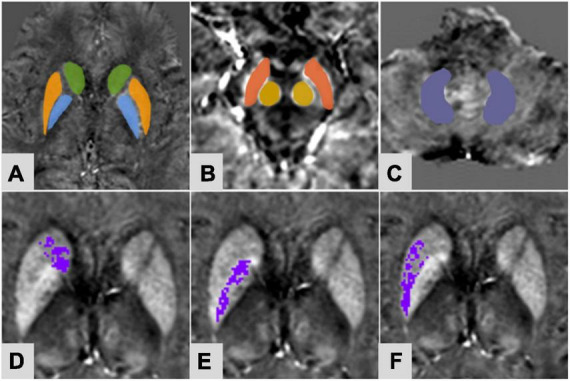
Materials and methods: A total of 38 PD patients with T2DM (PDDM), 30 PD patients without T2DM (PDND), and 20 asymptomatic control subjects (CSs) were recruited for this study. All subjects underwent multiple MRI sequences involving enhanced gradient echo T2 star weighted angiography (ESWAN). The magnetic sensitivity values (MSV) and volume of the whole nuclei (MSVW, VW) and high iron region (MSVRII, VRII) were measured on the bilateral caudate nucleus (CN), the putamen (PUT), the globus pallidus (GP), the substantia nigra (SN), the red nucleus (RN) and the dentate nucleus (DN). Clinical and laboratory data were recorded, especially for the Hoehn and Yahr (H-Y) stage, the Montreal Cognitive Assessment (MoCA), the Mini-Mental State Examination (MMSE), the Hamilton Depression Rating Scale (HAMD), and the Hamilton Anxiety Rating Scale (HAMA). All QSM data were compared between PDDM and PDND groups and correlated with clinical and laboratory data.
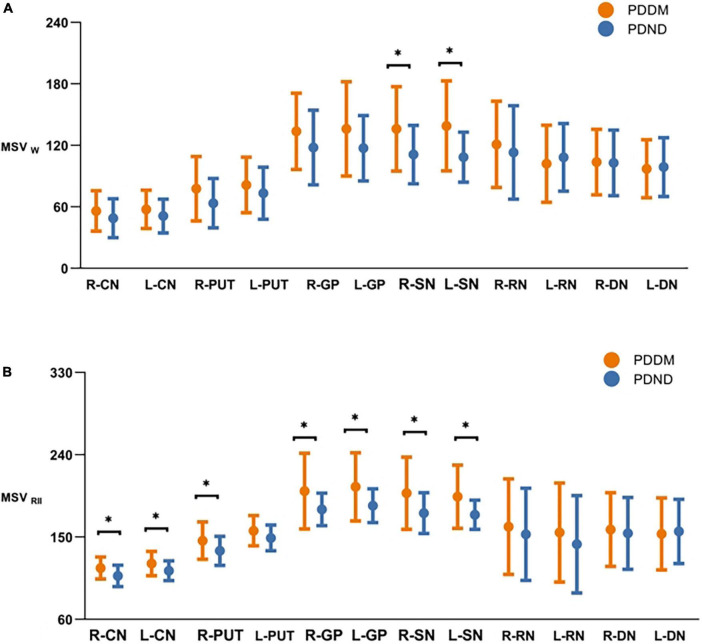
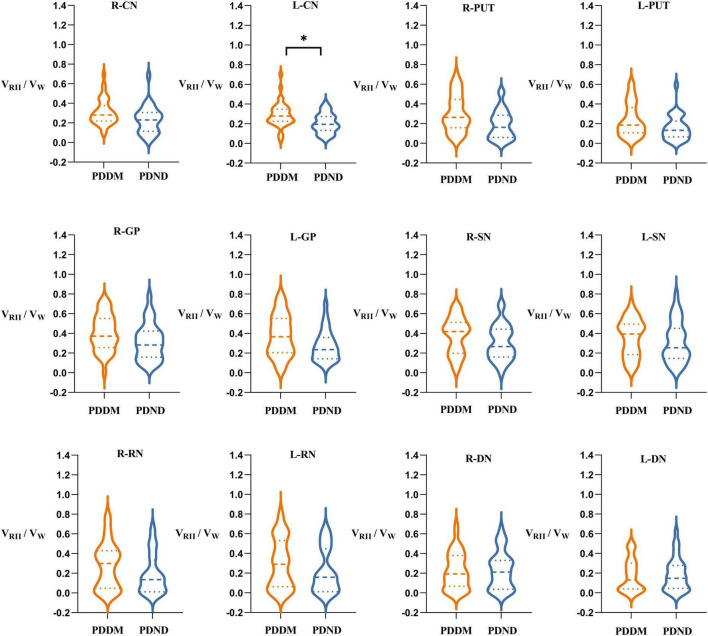
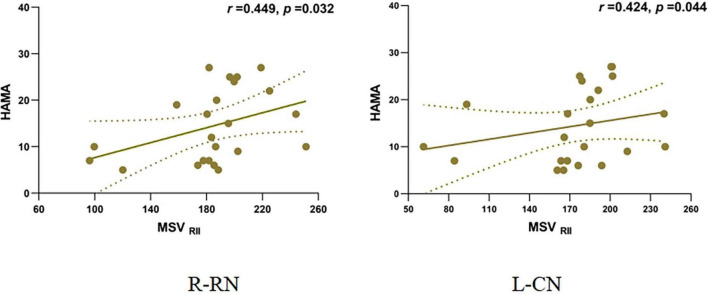
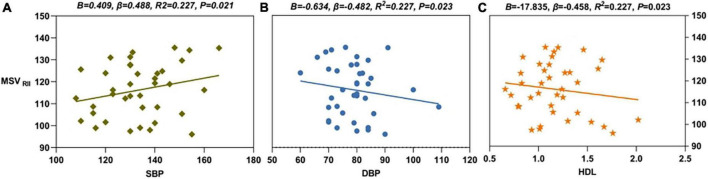
Results: Compared to the PDND group, the VRII/VW of the left CN was significantly increased in the PDDM group. Significantly higher MSVW and MSVRII were also found in the PDDM group, including bilateral SN of MSVW, right PUT, and bilateral CN, GP, and SN of MSVRII. The H-Y stage of the PDDM group was significantly higher than that of the PDND group. The MSVRII of bilateral RN of the PDDM group was positively correlated with the HAMA scores. HDL, DBP, and SBP levels were associated with MSVRII of right CN in the PDDM group.
Conclusion: T2DM could aggravate the disease severity and anxiety in patients with PD. The iron distribution of deep gray matter nuclei in PD patients with T2DM was significantly heterogeneous, which was related to blood pressure and blood lipids.
Keywords: Parkinson’s disease; heterogeneity; iron; magnetic sensitivity value; type 2 diabetes mellitus.
Copyright © 2022 Li, Gao, Du, Jiang, Yang, Hu, Liu, Liu, Zhang, Song and Miao.
Conflict of interest statement
The authors declare that the research was conducted in the absence of any commercial or financial relationships that could be construed as a potential conflict of interest.
Figures
Similar articles
-
Quantitative susceptibility mapping for iron monitoring of multiple subcortical nuclei in type 2 diabetes mellitus: a systematic review and meta-analysis.Front Endocrinol (Lausanne). 2024 Mar 6;15:1331831. doi: 10.3389/fendo.2024.1331831. eCollection 2024. Front Endocrinol (Lausanne). 2024. PMID: 38510699 Free PMC article.
-
Regional high iron deposition on brain quantitative susceptibility mapping correlates with cognitive decline in chronic kidney disease patients.Brain Imaging Behav. 2025 Apr;19(2):395-406. doi: 10.1007/s11682-025-00976-0. Epub 2025 Feb 11. Brain Imaging Behav. 2025. PMID: 39930019 Free PMC article.
-
Regional high iron deposition on quantitative susceptibility mapping correlates with cognitive decline in type 2 diabetes mellitus.Front Neurosci. 2023 Jan 30;17:1061156. doi: 10.3389/fnins.2023.1061156. eCollection 2023. Front Neurosci. 2023. PMID: 36793541 Free PMC article.
-
Quantifying iron deposition within the substantia nigra of Parkinson's disease by quantitative susceptibility mapping.J Neurol Sci. 2018 Mar 15;386:46-52. doi: 10.1016/j.jns.2018.01.008. Epub 2018 Jan 12. J Neurol Sci. 2018. PMID: 29406966
-
Simultaneous Increase of Mean Susceptibility and Mean Kurtosis in the Substantia Nigra as an MRI Neuroimaging Biomarker for Early-Stage Parkinson's Disease: A Systematic Review and Meta-Analysis.J Magn Reson Imaging. 2025 Apr;61(4):1797-1809. doi: 10.1002/jmri.29569. Epub 2024 Aug 29. J Magn Reson Imaging. 2025. PMID: 39210501
Cited by
-
Quantitative susceptibility mapping for iron monitoring of multiple subcortical nuclei in type 2 diabetes mellitus: a systematic review and meta-analysis.Front Endocrinol (Lausanne). 2024 Mar 6;15:1331831. doi: 10.3389/fendo.2024.1331831. eCollection 2024. Front Endocrinol (Lausanne). 2024. PMID: 38510699 Free PMC article.
-
Regional high iron deposition on brain quantitative susceptibility mapping correlates with cognitive decline in chronic kidney disease patients.Brain Imaging Behav. 2025 Apr;19(2):395-406. doi: 10.1007/s11682-025-00976-0. Epub 2025 Feb 11. Brain Imaging Behav. 2025. PMID: 39930019 Free PMC article.
-
The Role of Iron Homeostasis Imbalance in T2DM-Associated Cognitive Dysfunction: A Prospective Cohort Study Utilizing Quantitative Susceptibility Mapping.Hum Brain Mapp. 2025 Jun 15;46(9):e70263. doi: 10.1002/hbm.70263. Hum Brain Mapp. 2025. PMID: 40530831 Free PMC article.
References
-
- Calloni S. F., Conte G., Sbaraini S., Cilia R., Contarino V. E., Avignone S., et al. (2018). Multiparametric MR imaging of Parkinsonisms at 3 tesla: Its role in the differentiation of idiopathic Parkinson’s disease versus atypical Parkinsonian disorders. Eur. J. Radiol. 109 95–100. 10.1016/j.ejrad.2018.10.032 - DOI - PubMed
LinkOut - more resources
Full Text Sources