

Spatio-temporal changes in chimpanzee density and abundance in the Greater Mahale Ecosystem, Tanzania
- PMID: 36178009
- PMCID: PMC10078593
- DOI: 10.1002/eap.2715
Spatio-temporal changes in chimpanzee density and abundance in the Greater Mahale Ecosystem, Tanzania
Abstract
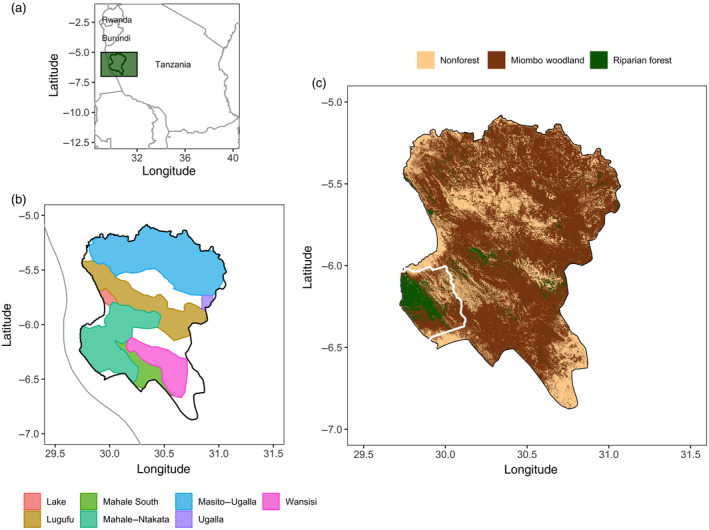
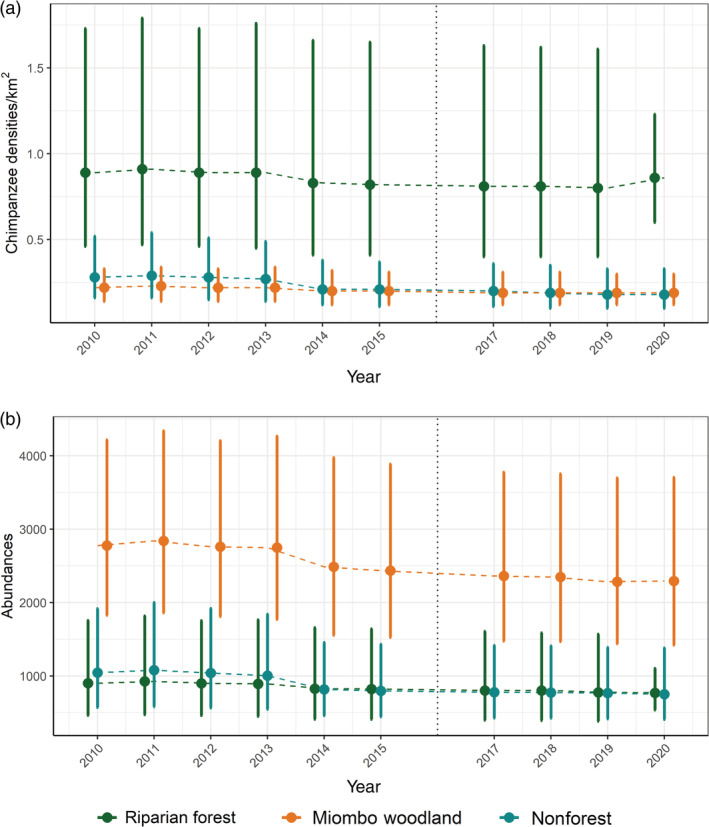
Species conservation and management require reliable information about animal distribution and population size. Better management actions within a species' range can be achieved by identifying the location and timing of population changes. In the Greater Mahale Ecosystem (GME), western Tanzania, deforestation due to the expansion of human settlements and agriculture, annual burning, and logging are known threats to wildlife. For one of the most charismatic species, the endangered eastern chimpanzee (Pan troglodytes schweinfurthii), approximately 75% of the individuals are distributed outside national park boundaries, requiring monitoring and protection efforts over a vast landscape of various protection statuses. These efforts are especially challenging when we lack data on trends in density and population size. To predict spatio-temporal chimpanzee density and abundance across the GME, we used density surface modeling, fitting a generalized additive model to a 10-year time-series data set of nest counts based on line-transect surveys. The chimpanzee population declined at an annual rate of 2.41%, including declines of 1.72% in riparian forests (from this point forward, forests), 2.05% in miombo woodlands (from this point forward, woodlands) and 3.45% in nonforests. These population declines were accompanied by ecosystem-wide declines in vegetation types of 1.36% and 0.32% per year for forests and woodlands, respectively; we estimated an annual increase of 1.35% for nonforests. Our model predicted the highest chimpanzee density in forests (0.86 chimpanzees/km2 , 95% confidence intervals (CIs) 0.60-1.23; as of 2020), followed by woodlands (0.19, 95% CI 0.12-0.30) and nonforests (0.18, 95% CI 0.10-1.33). Although forests represent only 6% of the landscape, they support nearly one-quarter of the chimpanzee population (769 chimpanzees, 95% CI 536-1103). Woodlands dominate the landscape (71%) and therefore support more than a half of the chimpanzee population (2294; 95% CI 1420-3707). The remaining quarter of the landscape is represented by nonforests and supports another quarter of the chimpanzee population (750; 95% CI 408-1381). Given the pressures on the remaining suitable habitat in Tanzania, and the need of chimpanzees to access both forest and woodland vegetation to survive, we urge future management actions to increase resources and expand the efforts to protect critical forest and woodland habitat and promote strategies and policies that more effectively prevent irreversible losses. We suggest that regular monitoring programs implement a systematic random design to effectively inform and allocate conservation actions and facilitate interannual comparisons for trend monitoring, measuring conservation success, and guiding adaptive management.
Keywords: conservation; density surface modeling; detection function estimation; eastern chimpanzee; generalized additive models; great apes; line-transect distance sampling; spatially explicit models.
© 2022 The Authors. Ecological Applications published by Wiley Periodicals LLC on behalf of The Ecological Society of America.
Conflict of interest statement
The authors declare no conflict of interest.
Figures
Similar articles
-
Ecological correlates of chimpanzee (Pan troglodytes schweinfurthii) density in Mahale Mountains National Park, Tanzania.PLoS One. 2021 Feb 12;16(2):e0246628. doi: 10.1371/journal.pone.0246628. eCollection 2021. PLoS One. 2021. PMID: 33577598 Free PMC article.
-
Population status of chimpanzees in the Masito-Ugalla Ecosystem, Tanzania.Am J Primatol. 2015 Oct;77(10):1027-35. doi: 10.1002/ajp.22438. Epub 2015 Jun 26. Am J Primatol. 2015. PMID: 26119006
-
Monitoring great ape and elephant abundance at large spatial scales: measuring effectiveness of a conservation landscape.PLoS One. 2010 Apr 23;5(4):e10294. doi: 10.1371/journal.pone.0010294. PLoS One. 2010. PMID: 20428233 Free PMC article.
-
Reaffirming the Loma Mountains National Park in Sierra Leone as a critical site for the conservation of West African chimpanzee (Pan troglodytes verus).Am J Primatol. 2023 Apr;85(4):e23469. doi: 10.1002/ajp.23469. Epub 2023 Jan 29. Am J Primatol. 2023. PMID: 36710071
-
Concerted conservation actions to support chimpanzee cultures.Philos Trans R Soc Lond B Biol Sci. 2025 May;380(1925):20240143. doi: 10.1098/rstb.2024.0143. Epub 2025 May 1. Philos Trans R Soc Lond B Biol Sci. 2025. PMID: 40308136 Free PMC article. Review.
Cited by
-
Chimpanzees (Pan troglodytes) Indicate Mammalian Abundance Across Broad Spatial Scales.Ecol Evol. 2025 Mar 15;15(3):e71000. doi: 10.1002/ece3.71000. eCollection 2025 Mar. Ecol Evol. 2025. PMID: 40092902 Free PMC article.
-
Camera Traps Document Infant Corpse Carrying Behaviour in Multiple Unhabituated Chimpanzee Populations.Ecol Evol. 2025 Jul 4;15(7):e71698. doi: 10.1002/ece3.71698. eCollection 2025 Jul. Ecol Evol. 2025. PMID: 40625317 Free PMC article.
-
Barriers to chimpanzee gene flow at the south-east edge of their distribution.Mol Ecol. 2023 Jul;32(14):3842-3858. doi: 10.1111/mec.16986. Epub 2023 Jun 5. Mol Ecol. 2023. PMID: 37277946 Free PMC article.
References
-
- Andres‐Bruemmer, D. , Hensen K., and Schenck C.. 2021. “Mission: Wilderness‐Annual Report 2020.” Frankfurt Zoological Society.
-
- Barlow, J. , França F., Gardner T. A., Hicks C. C., Lennox G. D., Berenguer E., Castello L., et al. 2018. “The Future of Hyperdiverse Tropical Ecosystems.” Nature 559: 517–26. - PubMed
-
- Bonnin, N. , Stewart F. A., Wich S. A., Pintea L., Jantz S. M., Dickson R., Bellis J., et al. 2020. “Modelling Landscape Connectivity Change for Chimpanzee Conservation in Tanzania.” Biological Conservation 252: 108816.
-
- Borchers, D. L. , Buckland S. T., Goedhart P. W., Clarke E. D., and Hedley S. L.. 1998. “Horvitz‐Thompson Estimators for Double Platform Line Transect Surveys.” Biometrics 54: 1221.
-
- Buckland, S. T. , Goudie I. B. J., and Borchers D. L.. 2000. “Wildlife Population Assessment: Past Developments and Future Directions.” Biometrics 56: 1–12. - PubMed
Publication types
MeSH terms
Associated data
LinkOut - more resources
Full Text Sources
